| Param | Original file | Final file |
|---|---|---|
| Filename | modeM0/AS1C02_042T01_9000001278_09155cztM0_level2.evt | modeM0/AS1C02_042T01_9000001278_09155cztM0_level2_quad_clean.evt |
| Size (bytes) | 830,995,200 | 178,643,520 |
| Size | 792.5 MB | 170.4 MB |
| Events in quadrant A | 6,853,644 | 1,143,109 |
| Events in quadrant B | 5,767,417 | 1,157,042 |
| Events in quadrant C | 5,491,052 | 1,147,064 |
| Events in quadrant D | 6,207,385 | 1,099,067 |
| Mode M0 | |||
|---|---|---|---|
| Quadrant | BADHDUFLAG | Total packets | Discarded packets |
| A | 0 | 28465 | 3 |
| B | 0 | 25740 | 2 |
| C | 0 | 25362 | 2 |
| D | 0 | 27250 | 2 |
| Mode M9 | |||
|---|---|---|---|
| Quadrant | BADHDUFLAG | Total packets | Discarded packets |
| A | 0 | 12 | 0 |
| B | 0 | 12 | 0 |
| C | 0 | 12 | 0 |
| D | 0 | 12 | 0 |
| Mode SS | |||
|---|---|---|---|
| Quadrant | BADHDUFLAG | Total packets | Discarded packets |
| A | 0 | 252 | 0 |
| B | 0 | 252 | 0 |
| C | 0 | 252 | 0 |
| D | 0 | 252 | 0 |
| Quadrant | Total seconds | Saturated seconds | Saturation percentage |
|---|---|---|---|
| A | 12514 | 125 | 0.998881% |
| B | 12514 | 86 | 0.687230% |
| C | 12514 | 82 | 0.655266% |
| D | 12514 | 171 | 1.366470% |
Noise dominated data is calculated using 1-second bins in cleaned event files. If a bin has >2000 counts, and if more than 50% of those come from <1% of pixels, then it is considered to be noise-dominated and hence unusable.
| Quadrant | # 1 sec bins | Bins with >0 counts | Bins with >2000 counts | High rate bins dominated by noise | Noise dominated (total time) | Noise dominated (detector-on time) | Marked lightcurve |
|---|---|---|---|---|---|---|---|
| A | 13664 | 12516 | 3 | 3 | 0.02% | 0.02% | 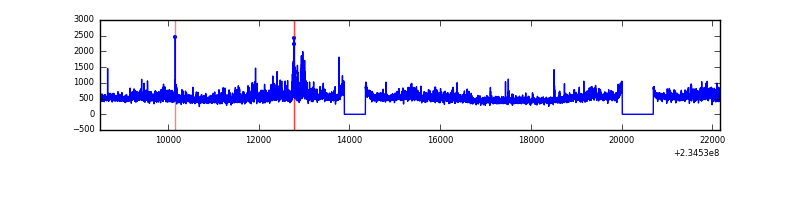 |
| B | 13664 | 12514 | 2 | 2 | 0.01% | 0.02% | 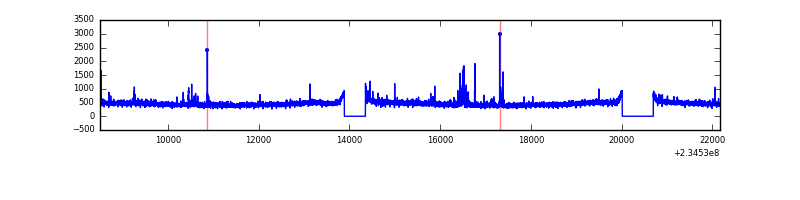 |
| C | 13664 | 12514 | 0 | 0 | 0.00% | 0.00% | 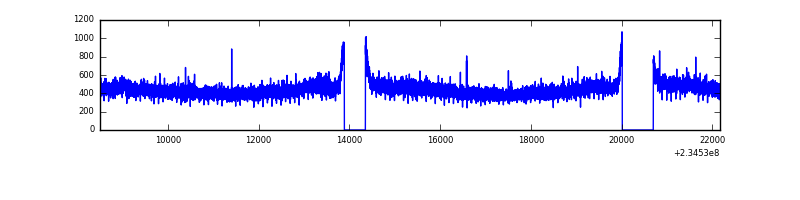 |
| D | 13664 | 12514 | 76 | 76 | 0.56% | 0.61% | 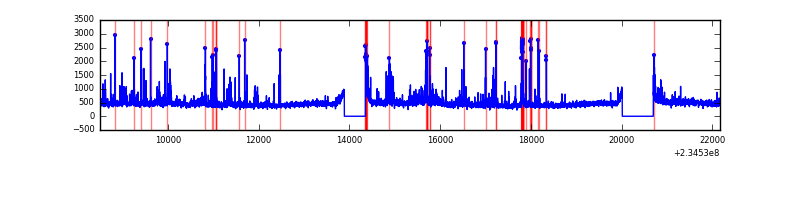 |
Top three noisy pixels from each quadrant. If the there are fewer than three noisy pixels in the level2.evt file, extra rows are filled as -1
| Pixel properties | Quadrant properties | ||||||
|---|---|---|---|---|---|---|---|
| Quadrant | DetID | PixID | Counts | Sigma | Mean | Median | Sigma |
| A | 8 | 5 | 1202719 | 4116.14 | 1426 | 1392 | 291.9 |
| A | 1 | 162 | 88711 | 299.18 | 1426 | 1392 | 291.9 |
| A | 1 | 178 | 17753 | 56.06 | 1426 | 1392 | 291.9 |
| B | 0 | 230 | 67050 | 241.66 | 1437 | 1399 | 271.7 |
| B | 12 | 111 | 29771 | 104.44 | 1437 | 1399 | 271.7 |
| B | 0 | 219 | 26911 | 93.91 | 1437 | 1399 | 271.7 |
| C | 8 | 208 | 11948 | 32.62 | 1400 | 1404 | 323.2 |
| C | 13 | 61 | 10446 | 27.98 | 1400 | 1404 | 323.2 |
| C | 14 | 67 | 7686 | 19.44 | 1400 | 1404 | 323.2 |
| D | 1 | 52 | 223953 | 593.6 | 1382 | 1352 | 375.0 |
| D | 2 | 14 | 173874 | 460.06 | 1382 | 1352 | 375.0 |
| D | 7 | 71 | 101383 | 266.75 | 1382 | 1352 | 375.0 |
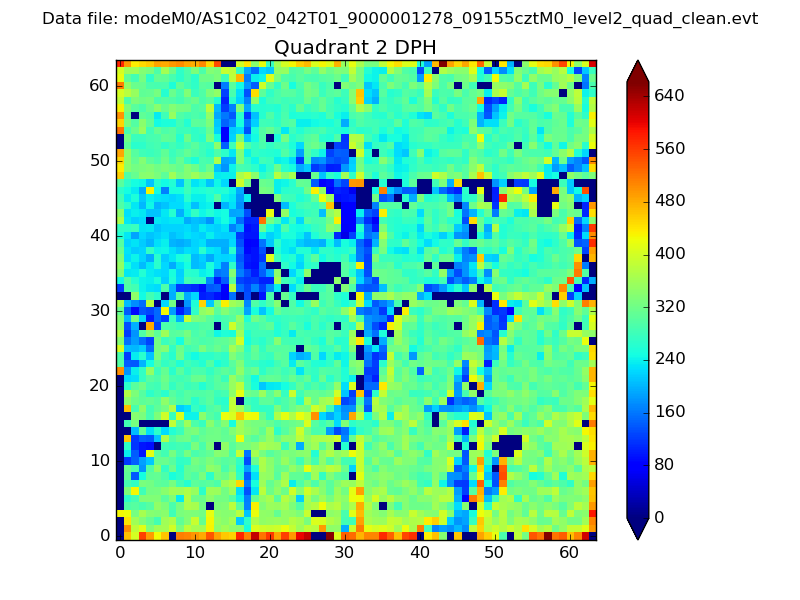
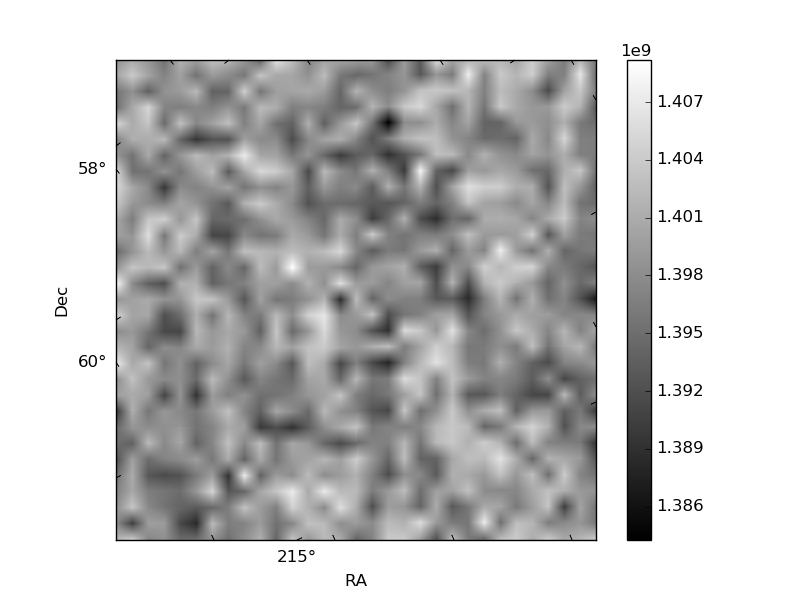
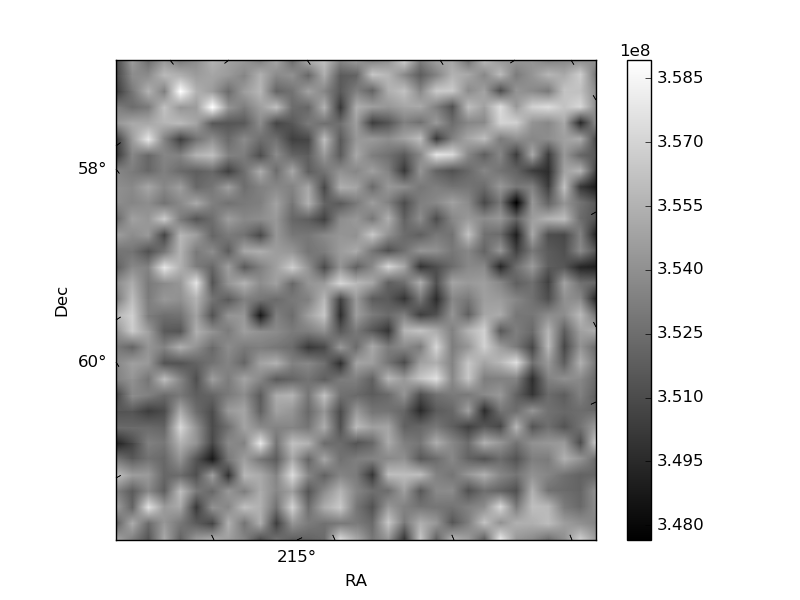
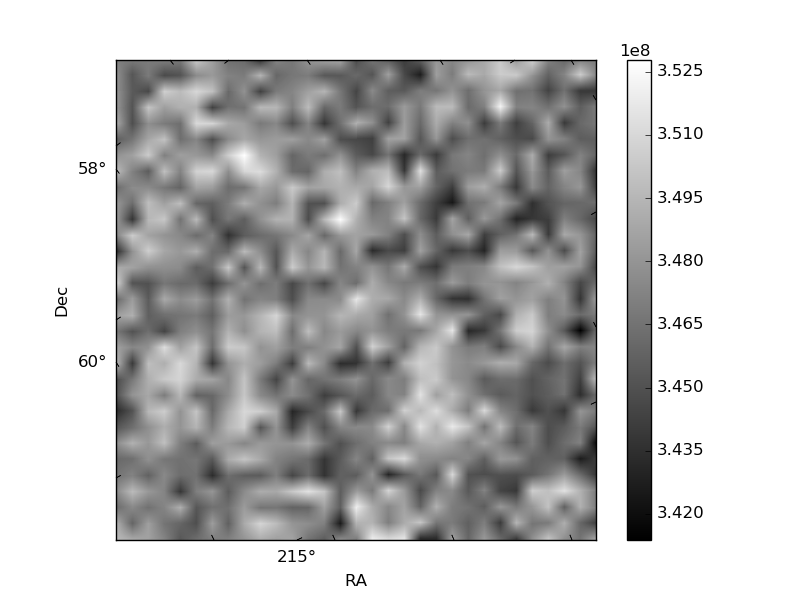
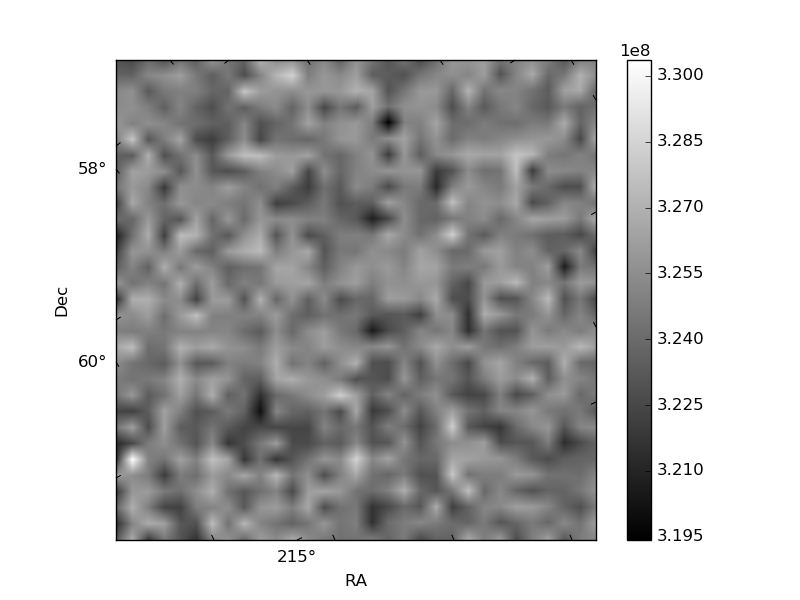
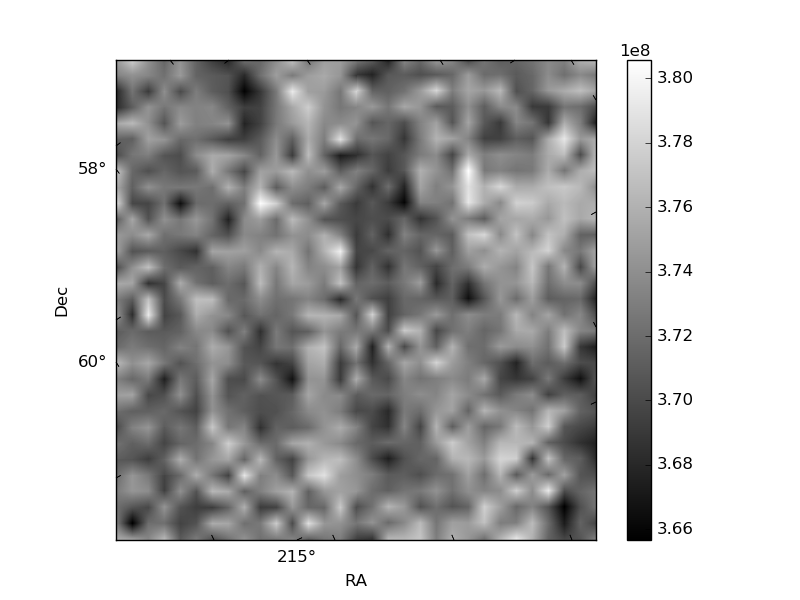
Histogram calculated using DETX and DETY for each event in the final _common_clean file
| Quadrant A | 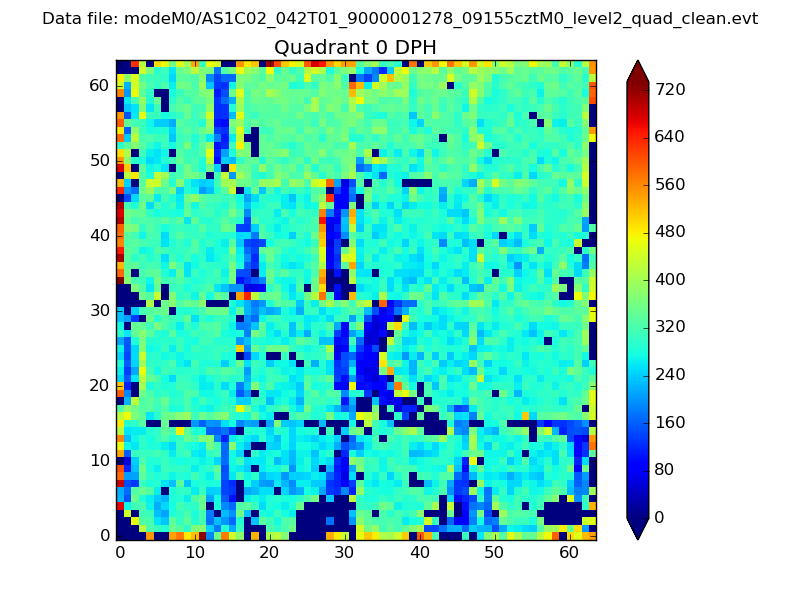 |
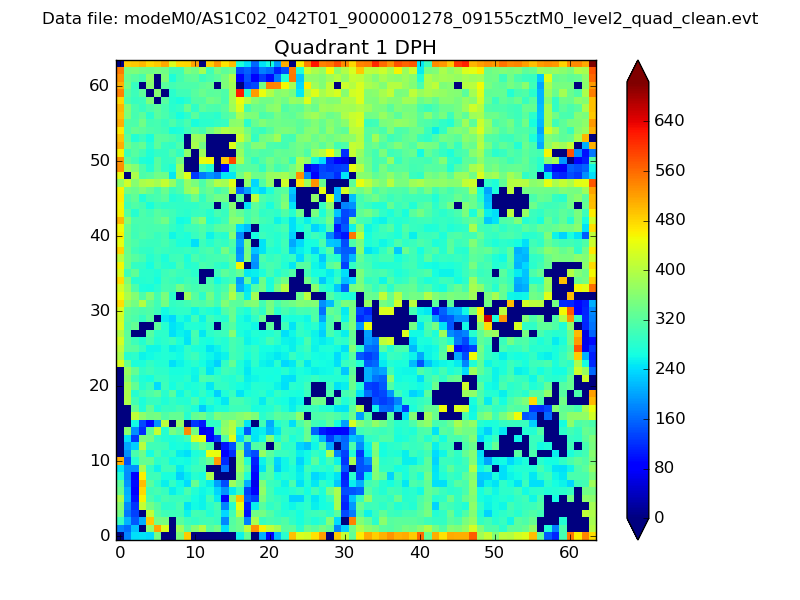 |
Quadrant B |
|---|---|---|---|
| Quadrant D | 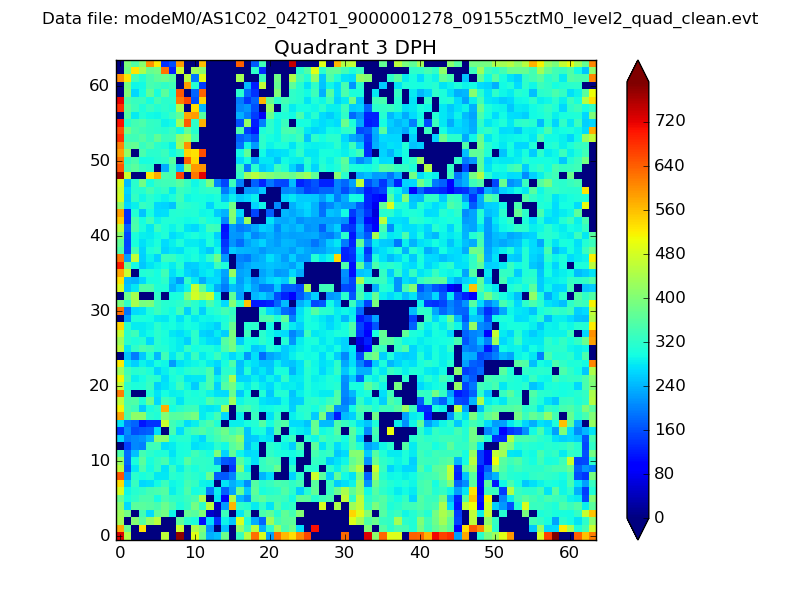 |
 |
Quadrant C |
| Plot type | Count rate plots | Images |
|---|---|---|
| Comparison with Poisson distribution Blue bars denote a histogram of data divided into 1 sec bins. Red curve is a Poisson curve with rate = median count rate of data. |
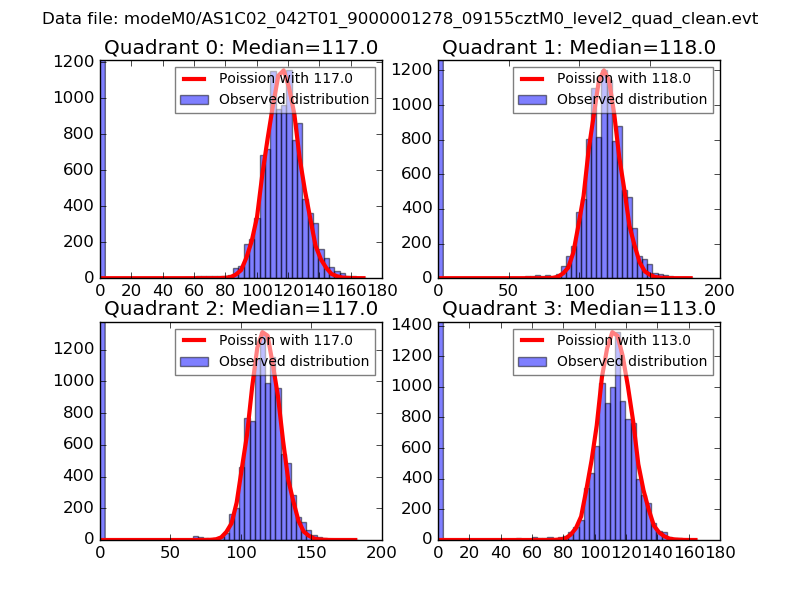 |
 |
| Quadrant-wise count rates Data is divided into 100 sec bins |
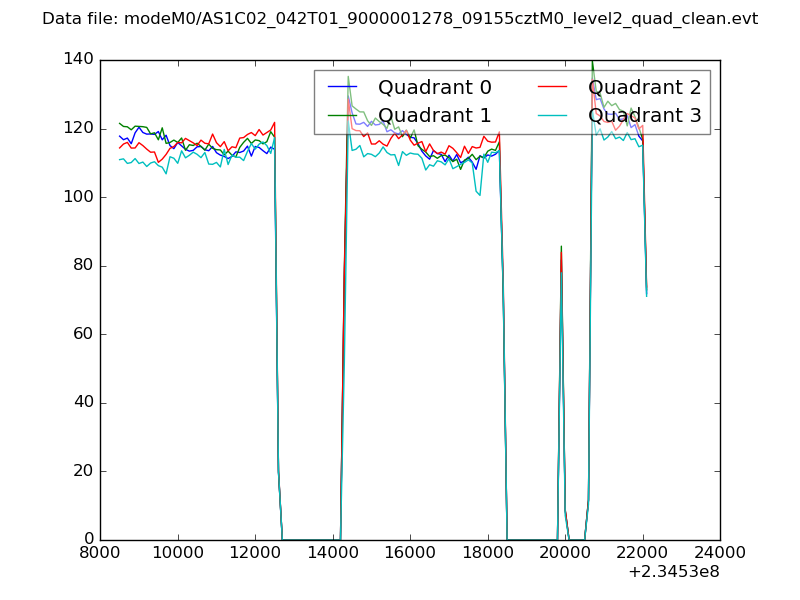 |
|
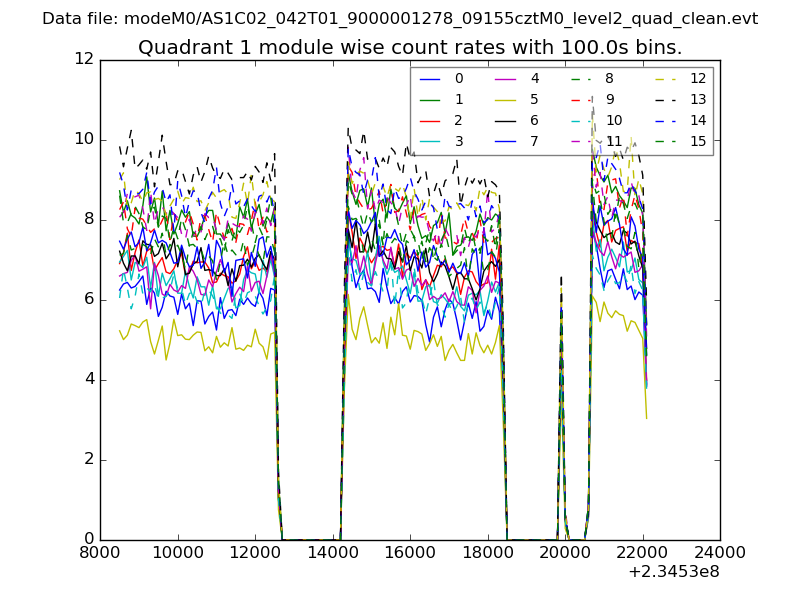
| Module-wise count rates for Quadrant A Data is divided into 100 sec bins |
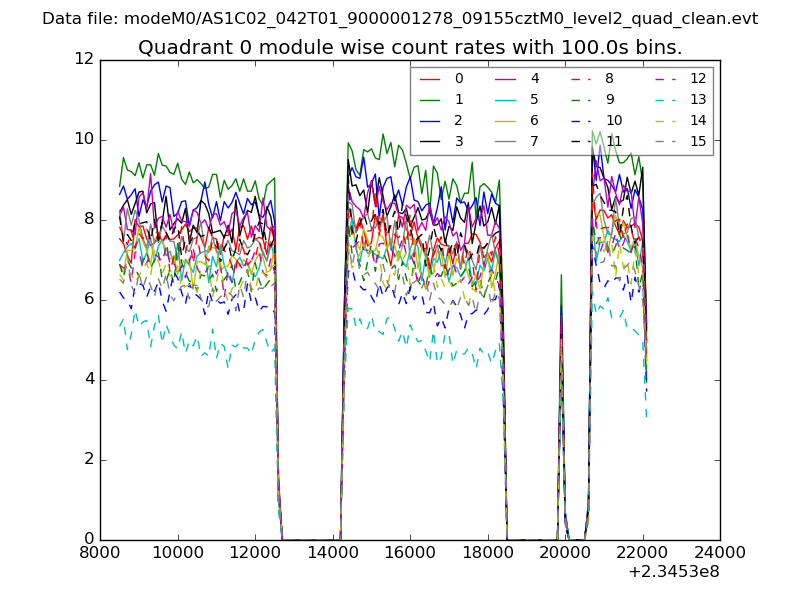 |
 |
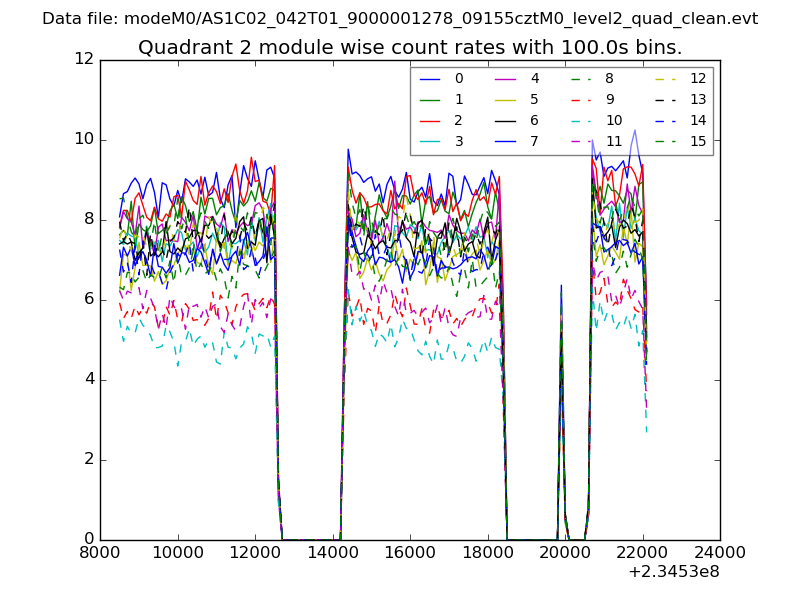
| Module-wise count rates for Quadrant B Data is divided into 100 sec bins |
 |
 |
| Module-wise count rates for Quadrant C Data is divided into 100 sec bins |
 |
 |
| Module-wise count rates for Quadrant D Data is divided into 100 sec bins |
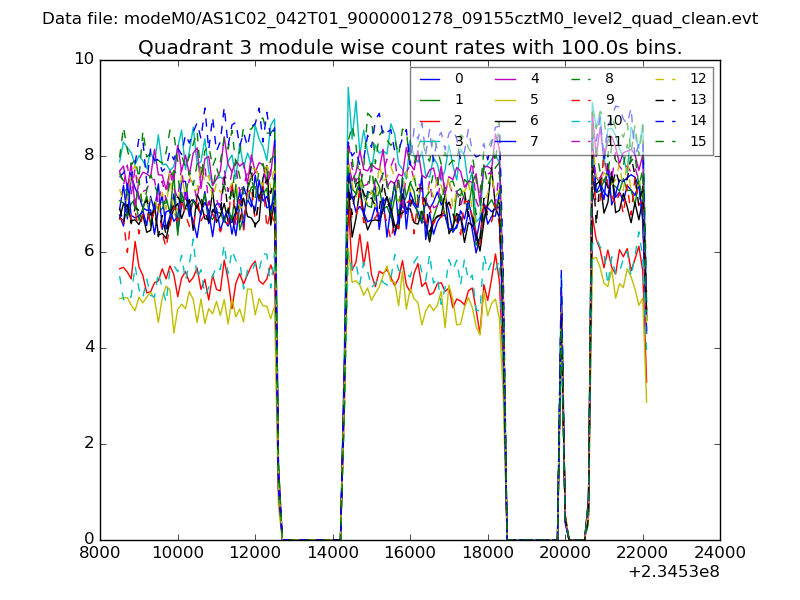 |
 |
| Parameter | Plot |
|---|---|
| CZT HV Monitor | 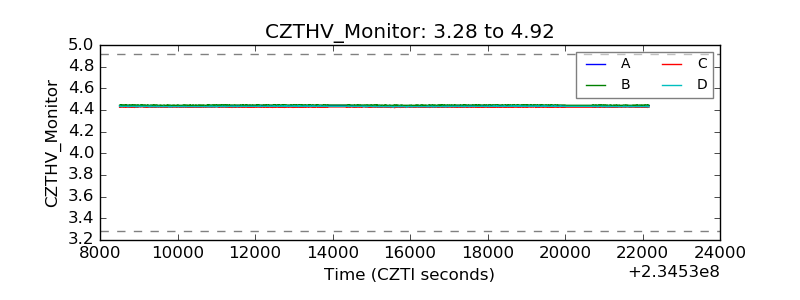 |
| D_VDD | 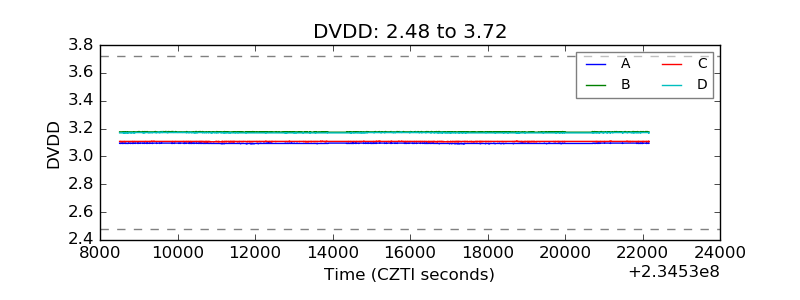 |
| Temperature 1 | 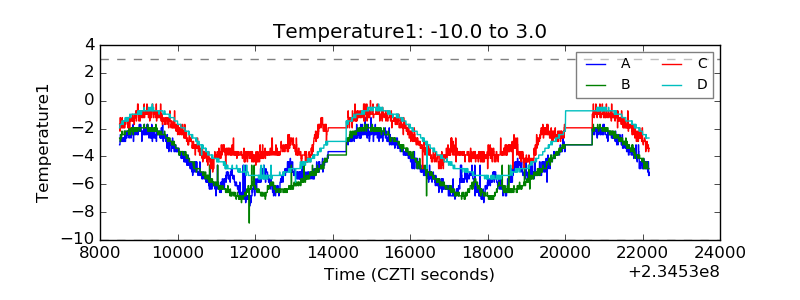 |
| Veto HV Monitor | 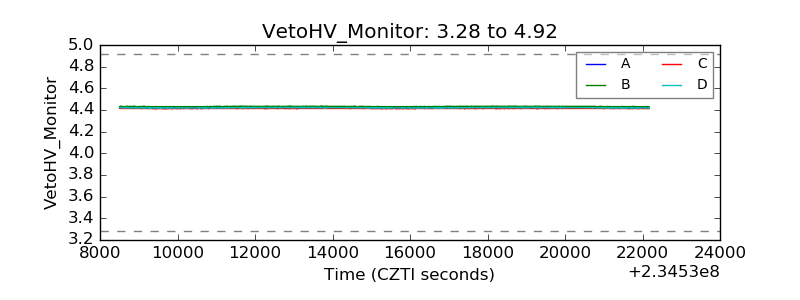 |
| Veto LLD | 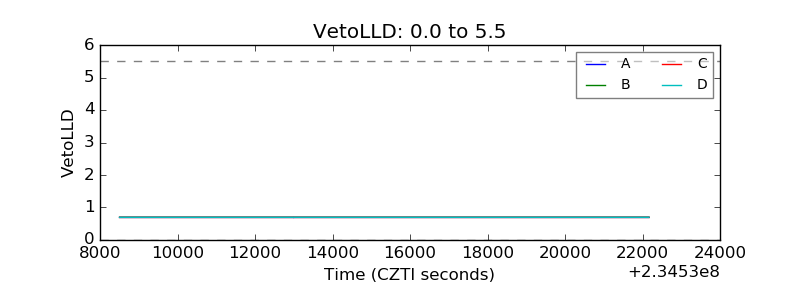 |
| Alpha Counter | 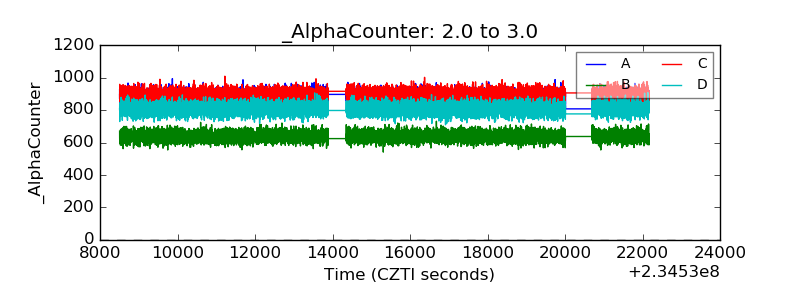 |
| _CPM_Rate | 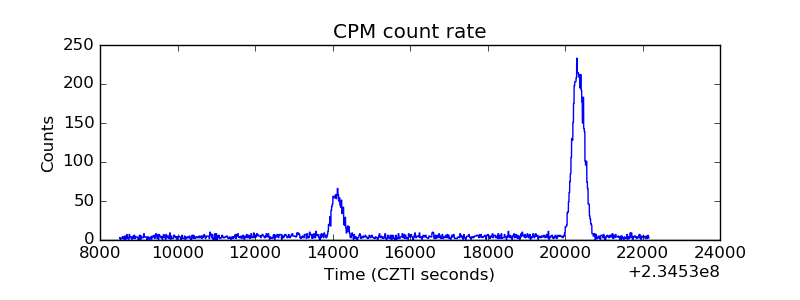 |
| CZT Counter | 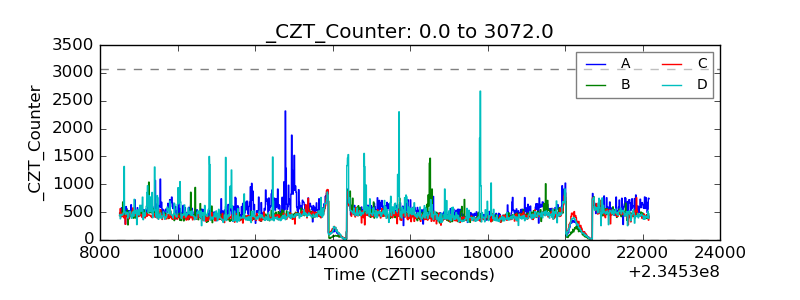 |
| +2.5 Volts monitor |  |
| +5 Volts monitor |  |
| _ROLL_ROT | 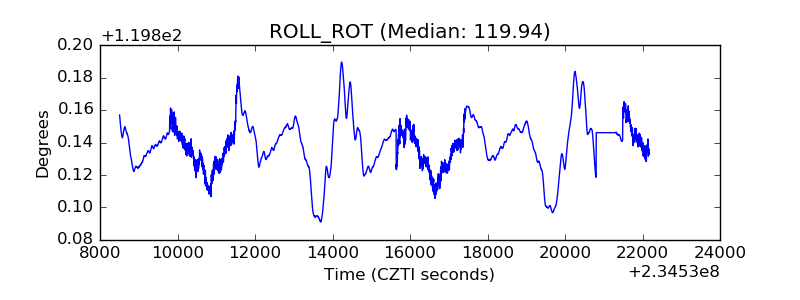 |
| _Roll_DEC | 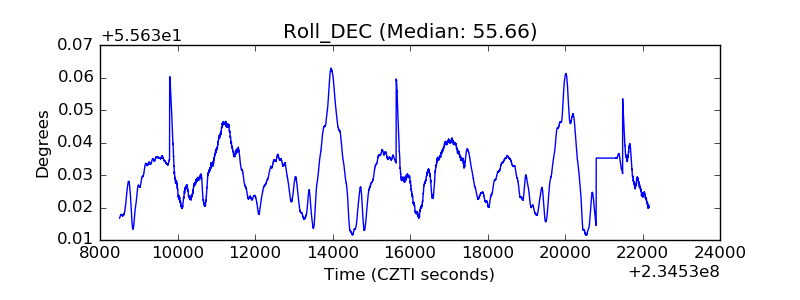 |
| _Roll_RA | 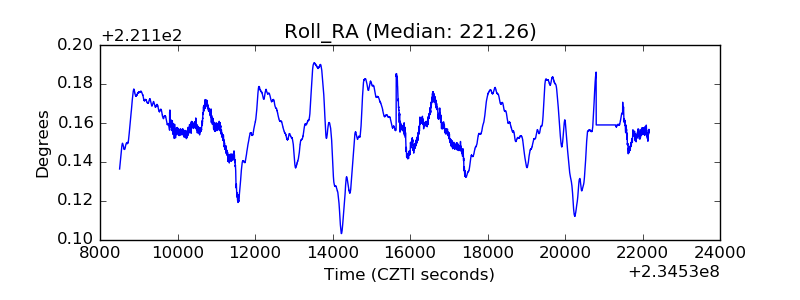 |
| Veto Counter | 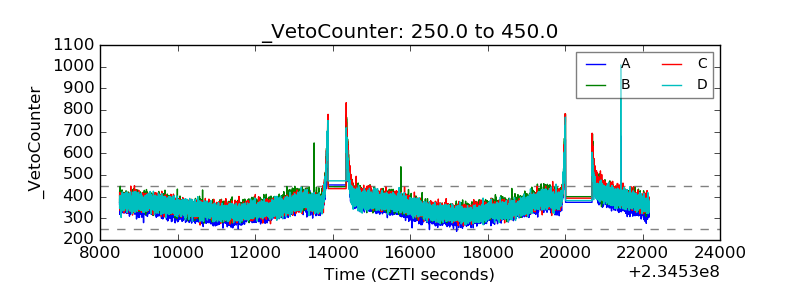 |