| Param | Original file | Final file |
|---|---|---|
| Filename | modeM0/AS1C02_042T01_9000001278_09156cztM0_level2.evt | modeM0/AS1C02_042T01_9000001278_09156cztM0_level2_quad_clean.evt |
| Size (bytes) | 461,347,200 | 100,808,640 |
| Size | 440.0 MB | 96.1 MB |
| Events in quadrant A | 3,914,988 | 643,244 |
| Events in quadrant B | 3,224,964 | 654,652 |
| Events in quadrant C | 3,054,364 | 652,149 |
| Events in quadrant D | 3,310,898 | 624,345 |
| Mode M0 | |||
|---|---|---|---|
| Quadrant | BADHDUFLAG | Total packets | Discarded packets |
| A | 0 | 16222 | 3 |
| B | 0 | 14329 | 2 |
| C | 0 | 13972 | 2 |
| D | 0 | 14761 | 2 |
| Mode M9 | |||
|---|---|---|---|
| Quadrant | BADHDUFLAG | Total packets | Discarded packets |
| A | 0 | 10 | 0 |
| B | 0 | 10 | 0 |
| C | 0 | 10 | 0 |
| D | 0 | 11 | 0 |
| Mode SS | |||
|---|---|---|---|
| Quadrant | BADHDUFLAG | Total packets | Discarded packets |
| A | 0 | 138 | 0 |
| B | 0 | 138 | 0 |
| C | 0 | 138 | 0 |
| D | 0 | 138 | 0 |
| Quadrant | Total seconds | Saturated seconds | Saturation percentage |
|---|---|---|---|
| A | 6874 | 62 | 0.901949% |
| B | 6874 | 46 | 0.669188% |
| C | 6874 | 41 | 0.596450% |
| D | 6874 | 60 | 0.872854% |
Noise dominated data is calculated using 1-second bins in cleaned event files. If a bin has >2000 counts, and if more than 50% of those come from <1% of pixels, then it is considered to be noise-dominated and hence unusable.
| Quadrant | # 1 sec bins | Bins with >0 counts | Bins with >2000 counts | High rate bins dominated by noise | Noise dominated (total time) | Noise dominated (detector-on time) | Marked lightcurve |
|---|---|---|---|---|---|---|---|
| A | 7734 | 6874 | 8 | 8 | 0.10% | 0.12% | 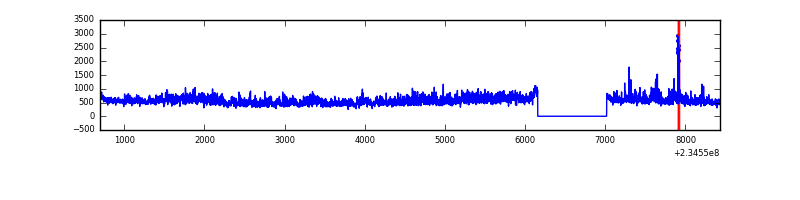 |
| B | 7734 | 6874 | 1 | 1 | 0.01% | 0.01% | 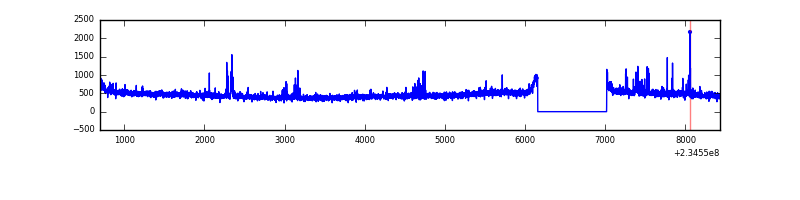 |
| C | 7734 | 6874 | 0 | 0 | 0.00% | 0.00% | 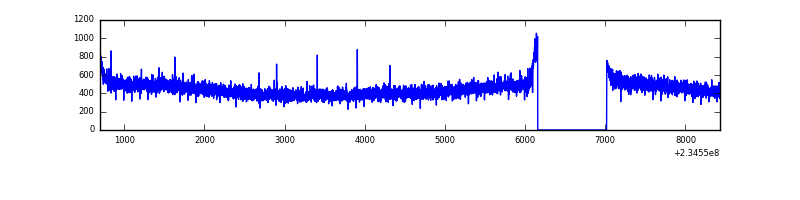 |
| D | 7734 | 6874 | 6 | 6 | 0.08% | 0.09% | 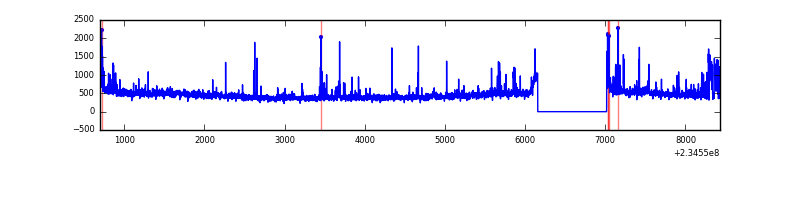 |
Top three noisy pixels from each quadrant. If the there are fewer than three noisy pixels in the level2.evt file, extra rows are filled as -1
| Pixel properties | Quadrant properties | ||||||
|---|---|---|---|---|---|---|---|
| Quadrant | DetID | PixID | Counts | Sigma | Mean | Median | Sigma |
| A | 8 | 5 | 748746 | 4640.65 | 788 | 770 | 161.2 |
| A | 1 | 162 | 74163 | 455.35 | 788 | 770 | 161.2 |
| A | 1 | 178 | 15040 | 88.53 | 788 | 770 | 161.2 |
| B | 8 | 234 | 38084 | 244.47 | 796 | 772 | 152.6 |
| B | 0 | 219 | 25576 | 162.52 | 796 | 772 | 152.6 |
| B | 0 | 229 | 24254 | 153.86 | 796 | 772 | 152.6 |
| C | 8 | 208 | 13552 | 70.27 | 778 | 782 | 181.7 |
| C | 13 | 61 | 5940 | 28.38 | 778 | 782 | 181.7 |
| C | 9 | 68 | 3616 | 15.59 | 778 | 782 | 181.7 |
| D | 1 | 52 | 156743 | 814.49 | 777 | 751 | 191.5 |
| D | 7 | 71 | 63828 | 329.35 | 777 | 751 | 191.5 |
| D | 13 | 104 | 39694 | 203.33 | 777 | 751 | 191.5 |
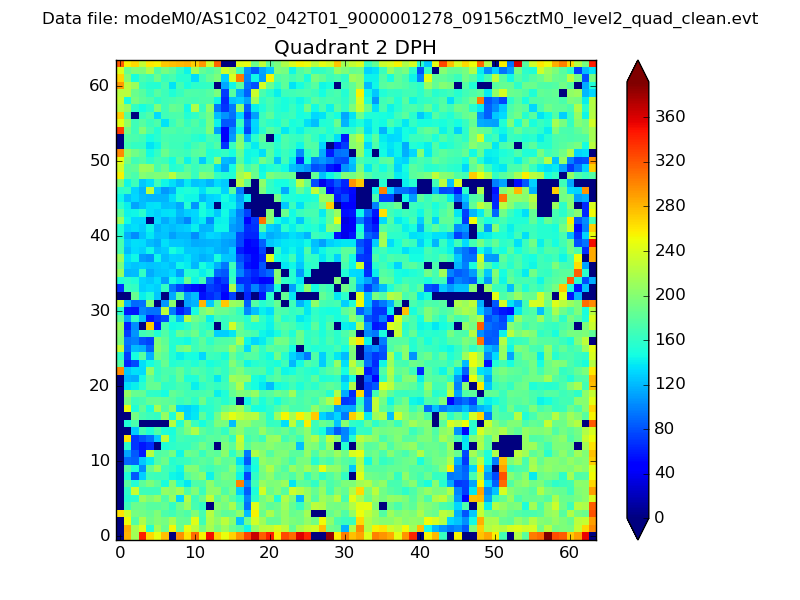
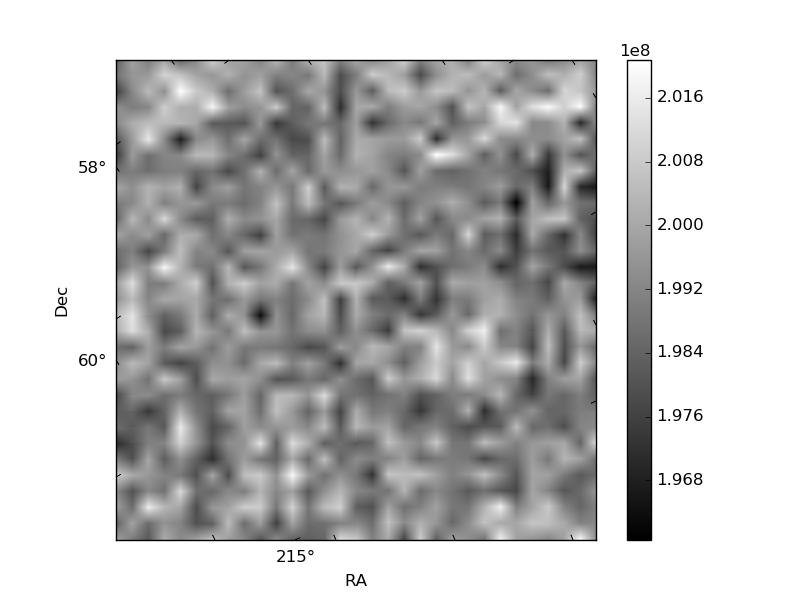
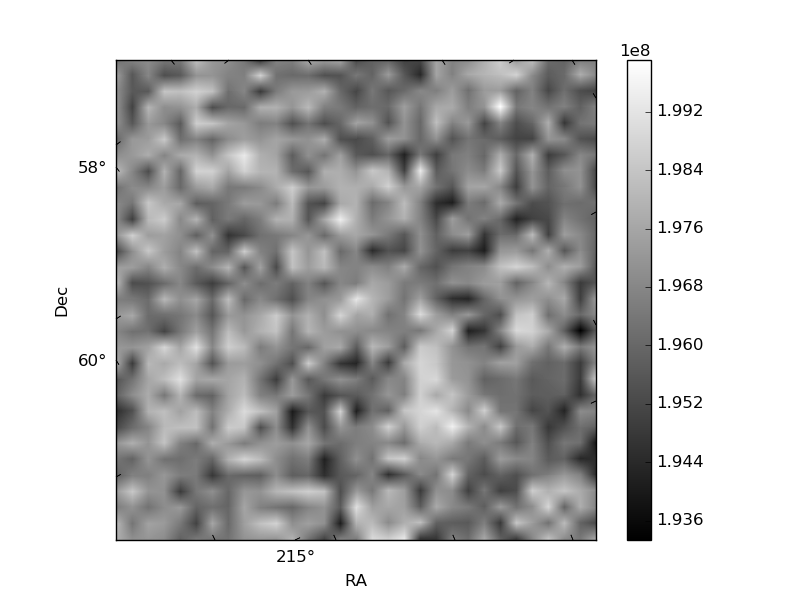
Histogram calculated using DETX and DETY for each event in the final _common_clean file
| Quadrant A |  |
 |
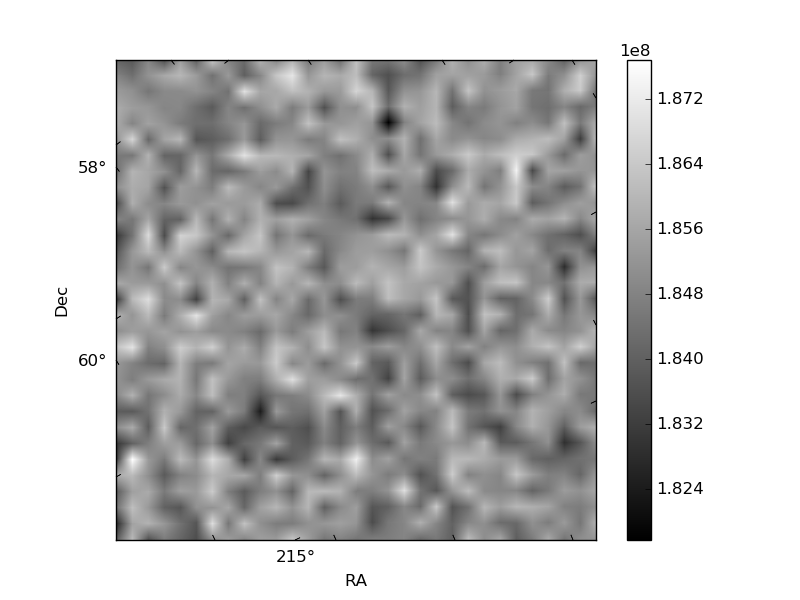
Quadrant B |
|---|---|---|---|
| Quadrant D |  |
 |
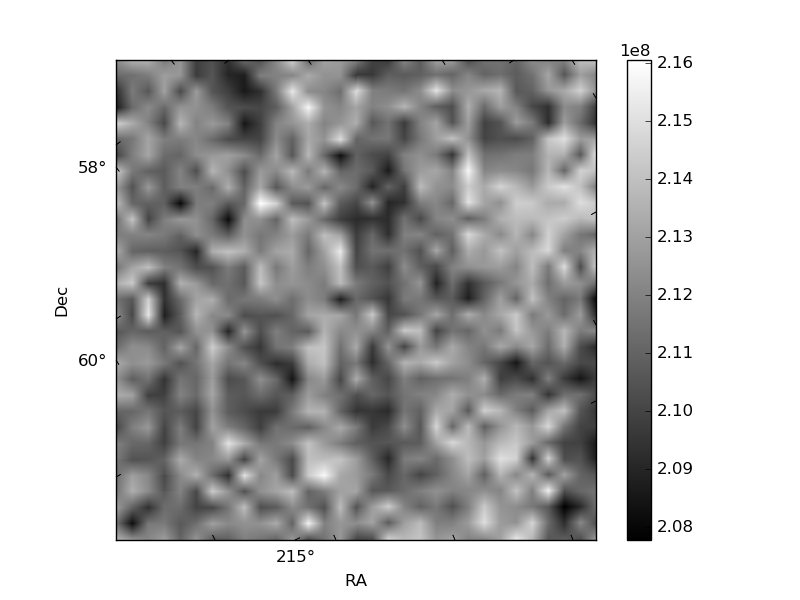
Quadrant C |
| Plot type | Count rate plots | Images |
|---|---|---|
| Comparison with Poisson distribution Blue bars denote a histogram of data divided into 1 sec bins. Red curve is a Poisson curve with rate = median count rate of data. |
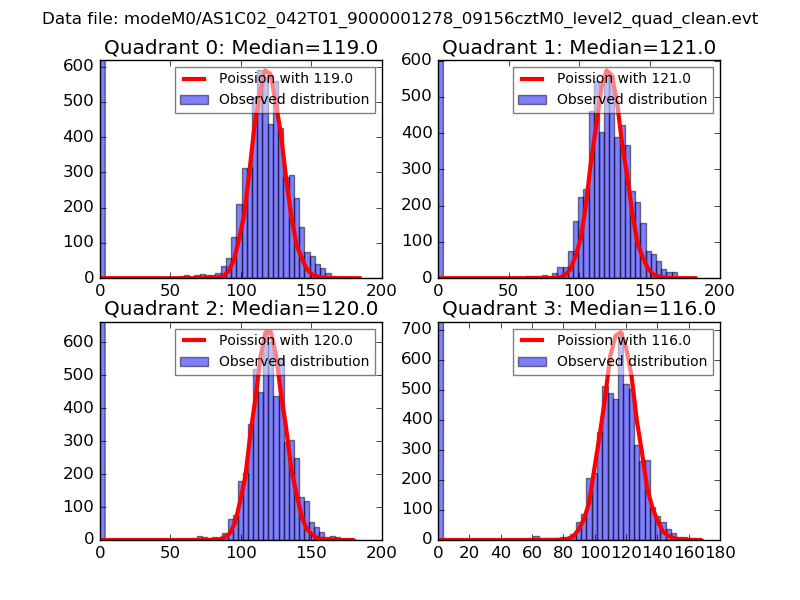 |
 |
| Quadrant-wise count rates Data is divided into 100 sec bins |
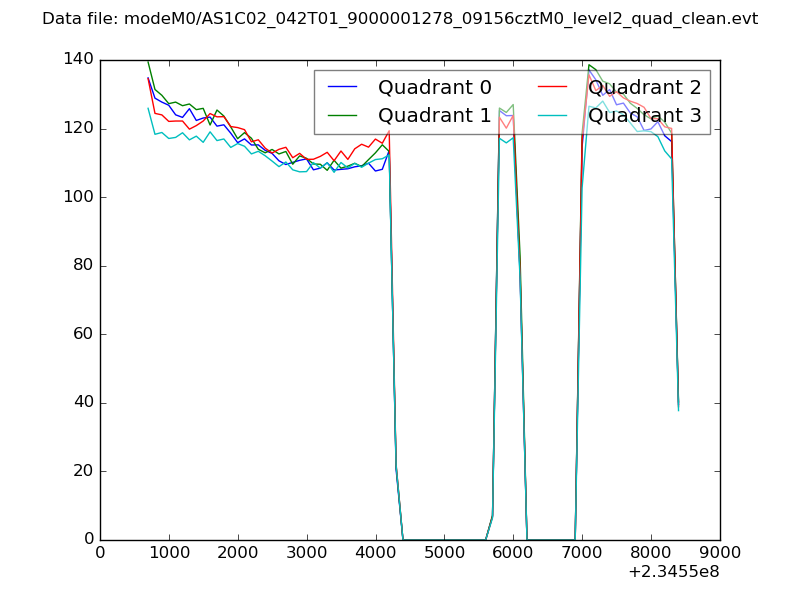 |
|
| Module-wise count rates for Quadrant A Data is divided into 100 sec bins |
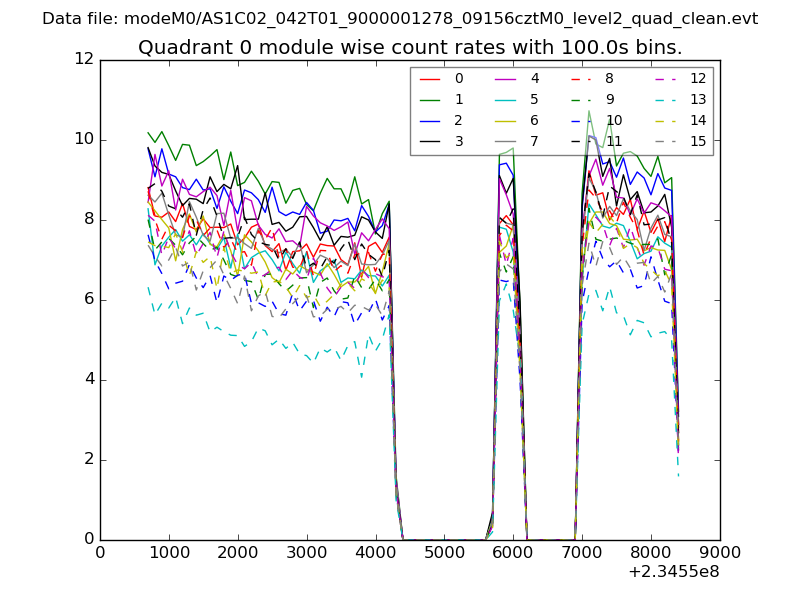 |
 |
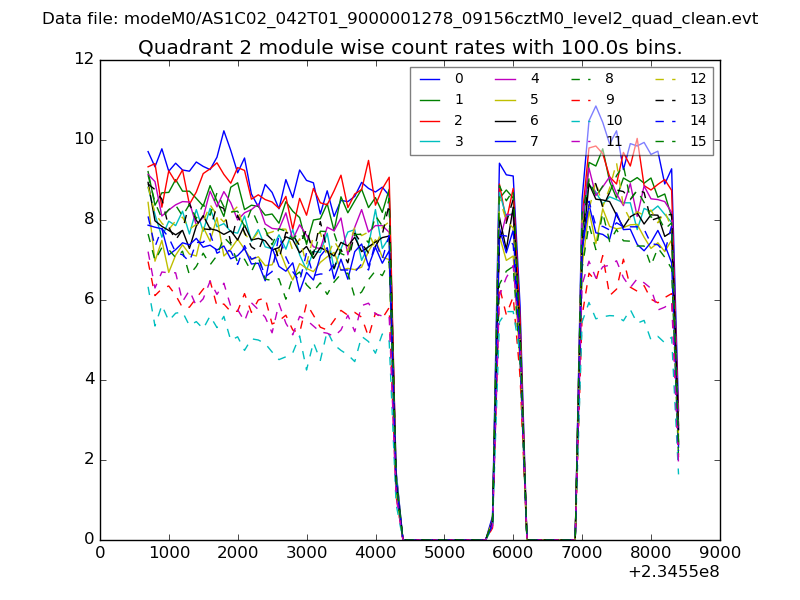
| Module-wise count rates for Quadrant B Data is divided into 100 sec bins |
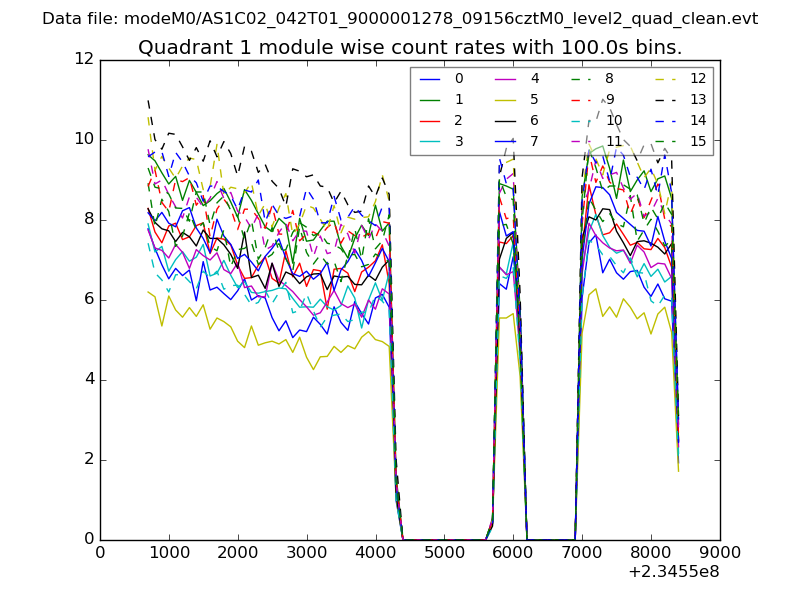 |
 |
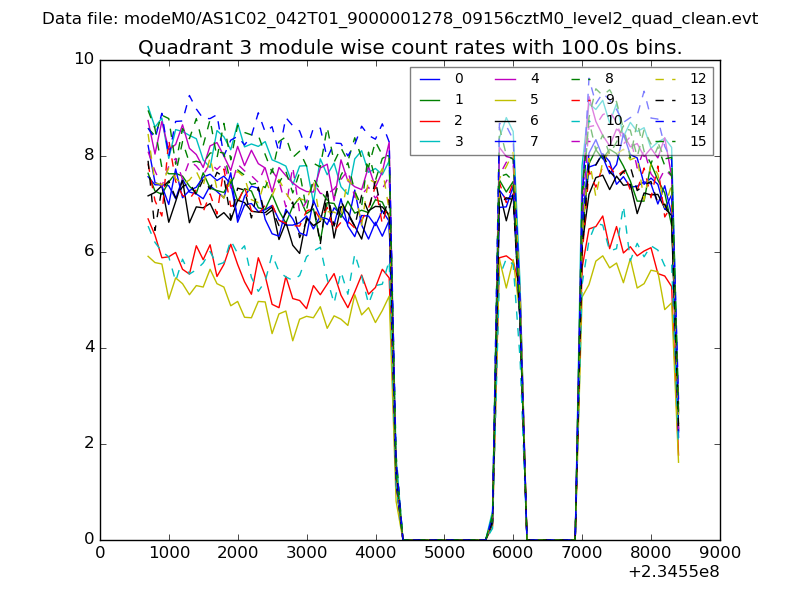
| Module-wise count rates for Quadrant C Data is divided into 100 sec bins |
 |
 |
| Module-wise count rates for Quadrant D Data is divided into 100 sec bins |
 |
 |
| Parameter | Plot |
|---|---|
| CZT HV Monitor | 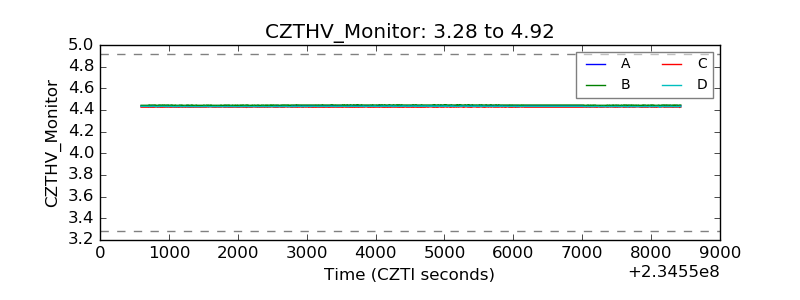 |
| D_VDD | 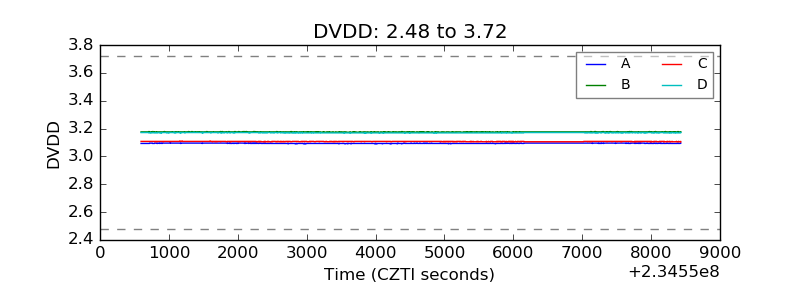 |
| Temperature 1 | 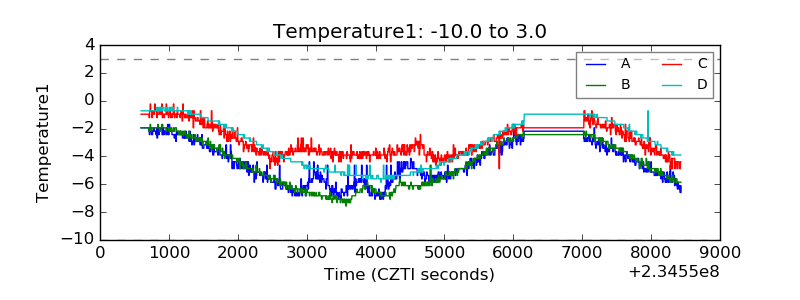 |
| Veto HV Monitor | 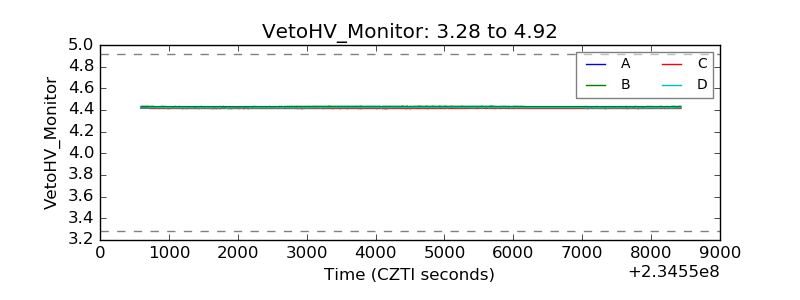 |
| Veto LLD |  |
| Alpha Counter | 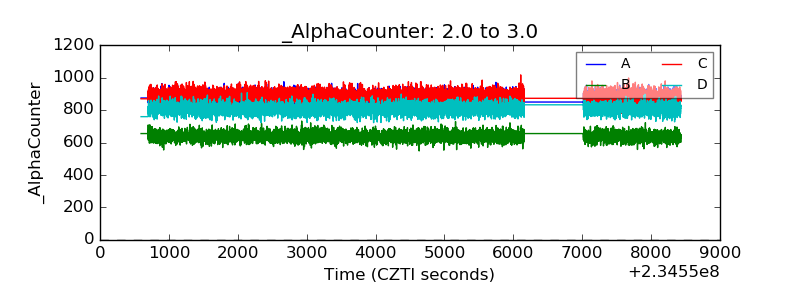 |
| _CPM_Rate | 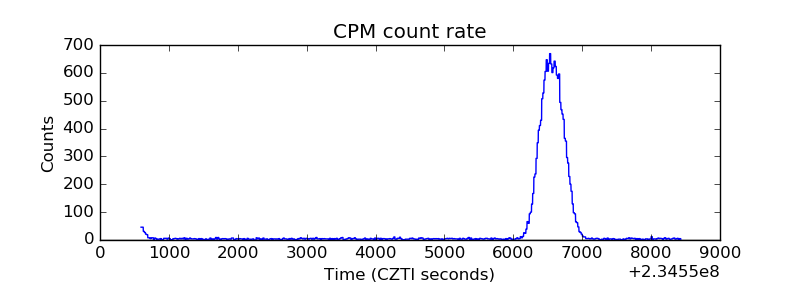 |
| CZT Counter | 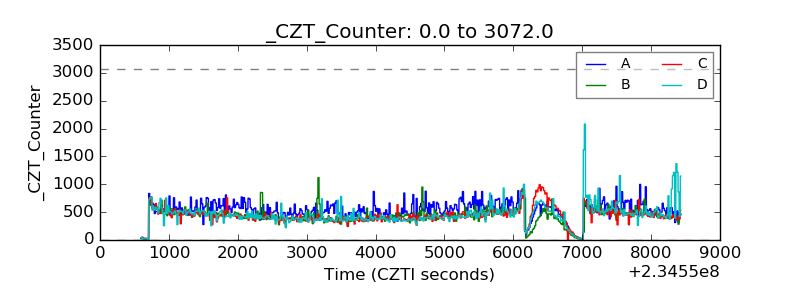 |
| +2.5 Volts monitor |  |
| +5 Volts monitor | 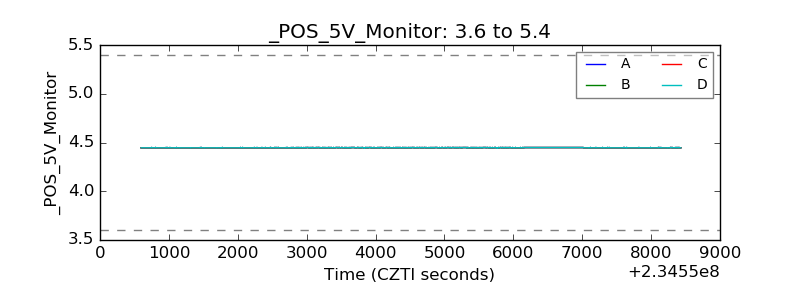 |
| _ROLL_ROT | 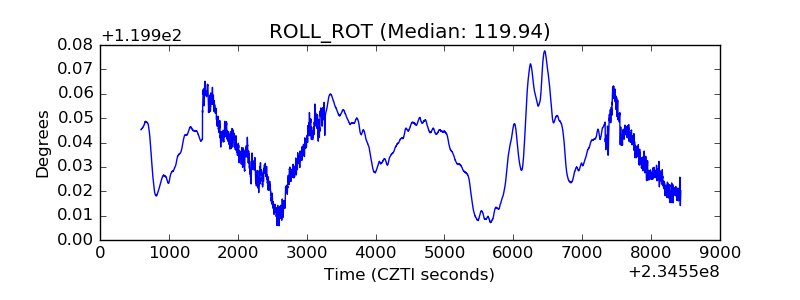 |
| _Roll_DEC | 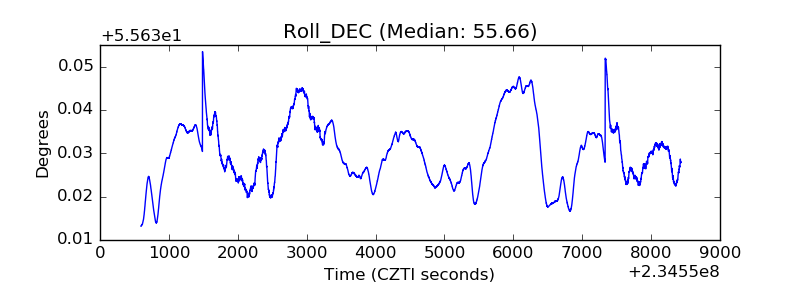 |
| _Roll_RA | 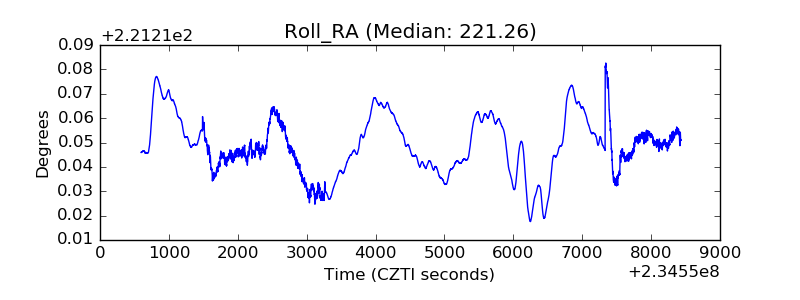 |
| Veto Counter | 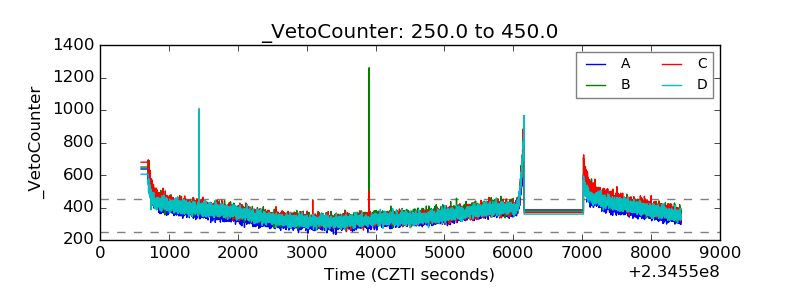 |