| Param | Original file | Final file |
|---|---|---|
| Filename | modeM0/AS1C02_042T01_9000001278_09157cztM0_level2.evt | modeM0/AS1C02_042T01_9000001278_09157cztM0_level2_quad_clean.evt |
| Size (bytes) | 435,663,360 | 95,947,200 |
| Size | 415.5 MB | 91.5 MB |
| Events in quadrant A | 3,545,566 | 612,216 |
| Events in quadrant B | 3,042,582 | 620,528 |
| Events in quadrant C | 2,879,526 | 624,290 |
| Events in quadrant D | 3,287,992 | 598,708 |
| Mode M0 | |||
|---|---|---|---|
| Quadrant | BADHDUFLAG | Total packets | Discarded packets |
| A | 0 | 14832 | 3 |
| B | 0 | 13539 | 2 |
| C | 0 | 13156 | 2 |
| D | 0 | 14313 | 2 |
| Mode M9 | |||
|---|---|---|---|
| Quadrant | BADHDUFLAG | Total packets | Discarded packets |
| A | 0 | 15 | 0 |
| B | 0 | 15 | 0 |
| C | 0 | 15 | 0 |
| D | 0 | 16 | 0 |
| Mode SS | |||
|---|---|---|---|
| Quadrant | BADHDUFLAG | Total packets | Discarded packets |
| A | 0 | 130 | 0 |
| B | 0 | 130 | 0 |
| C | 0 | 130 | 0 |
| D | 0 | 130 | 0 |
| Quadrant | Total seconds | Saturated seconds | Saturation percentage |
|---|---|---|---|
| A | 6454 | 46 | 0.712736% |
| B | 6454 | 29 | 0.449334% |
| C | 6454 | 24 | 0.371862% |
| D | 6454 | 56 | 0.867679% |
Noise dominated data is calculated using 1-second bins in cleaned event files. If a bin has >2000 counts, and if more than 50% of those come from <1% of pixels, then it is considered to be noise-dominated and hence unusable.
| Quadrant | # 1 sec bins | Bins with >0 counts | Bins with >2000 counts | High rate bins dominated by noise | Noise dominated (total time) | Noise dominated (detector-on time) | Marked lightcurve |
|---|---|---|---|---|---|---|---|
| A | 7479 | 6454 | 15 | 15 | 0.20% | 0.23% | 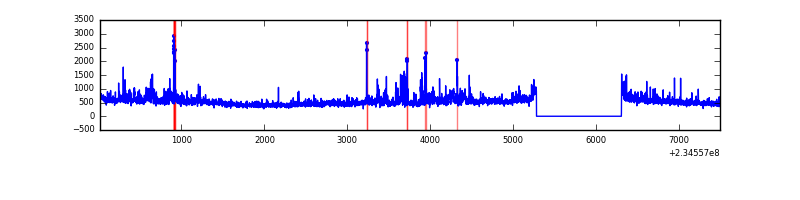 |
| B | 7479 | 6454 | 1 | 1 | 0.01% | 0.02% | 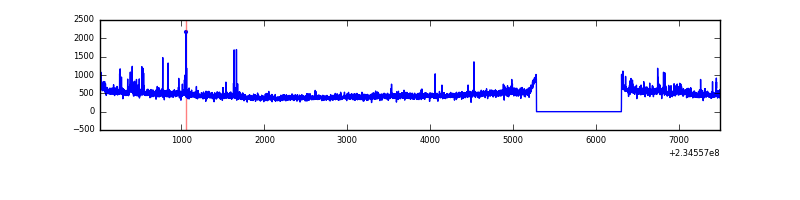 |
| C | 7479 | 6454 | 0 | 0 | 0.00% | 0.00% | 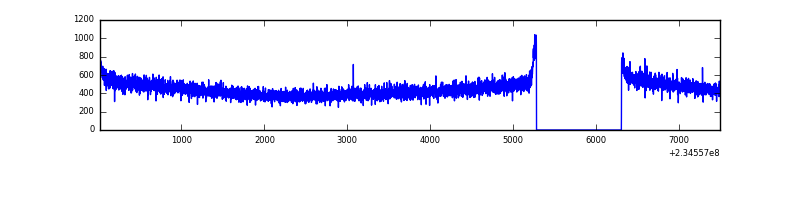 |
| D | 7479 | 6454 | 21 | 21 | 0.28% | 0.33% | 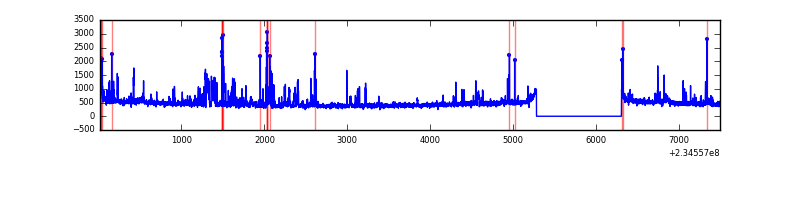 |
Top three noisy pixels from each quadrant. If the there are fewer than three noisy pixels in the level2.evt file, extra rows are filled as -1
| Pixel properties | Quadrant properties | ||||||
|---|---|---|---|---|---|---|---|
| Quadrant | DetID | PixID | Counts | Sigma | Mean | Median | Sigma |
| A | 8 | 5 | 590972 | 3921.57 | 738 | 721 | 150.5 |
| A | 1 | 162 | 56257 | 368.98 | 738 | 721 | 150.5 |
| A | 5 | 16 | 11227 | 69.8 | 738 | 721 | 150.5 |
| B | 8 | 234 | 45439 | 315.33 | 747 | 730 | 141.8 |
| B | 0 | 219 | 31957 | 220.24 | 747 | 730 | 141.8 |
| B | 0 | 229 | 24630 | 168.57 | 747 | 730 | 141.8 |
| C | 9 | 68 | 7725 | 41.18 | 733 | 738 | 169.7 |
| C | 8 | 208 | 6845 | 36.0 | 733 | 738 | 169.7 |
| C | 13 | 61 | 5716 | 29.34 | 733 | 738 | 169.7 |
| D | 1 | 52 | 153709 | 792.74 | 721 | 706 | 193.0 |
| D | 2 | 14 | 94180 | 484.31 | 721 | 706 | 193.0 |
| D | 13 | 104 | 93723 | 481.94 | 721 | 706 | 193.0 |
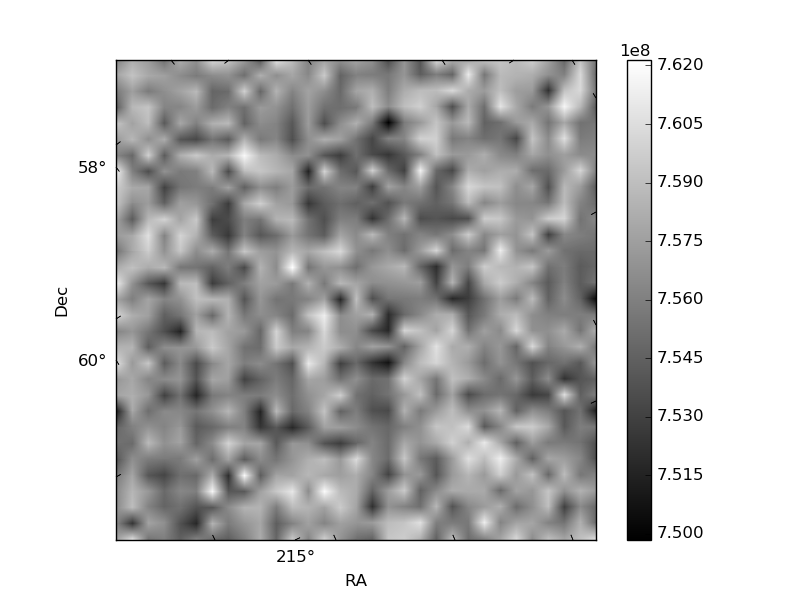
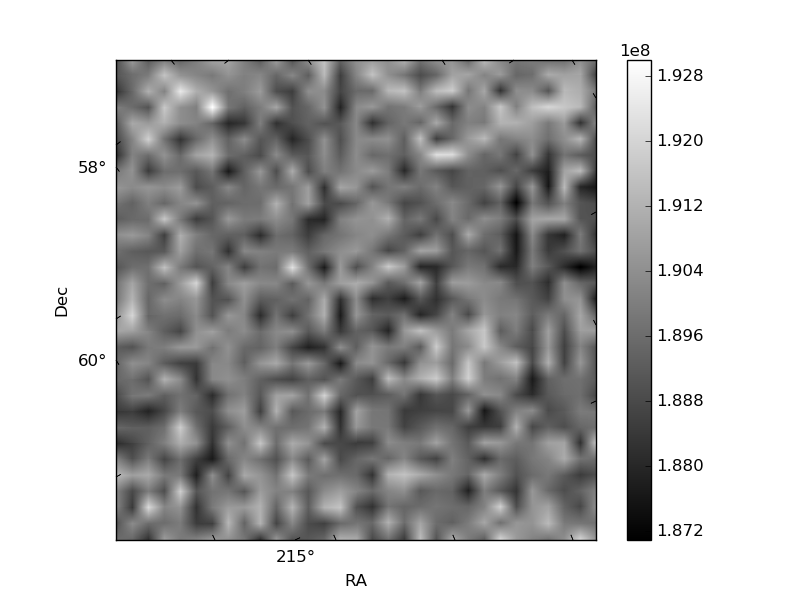
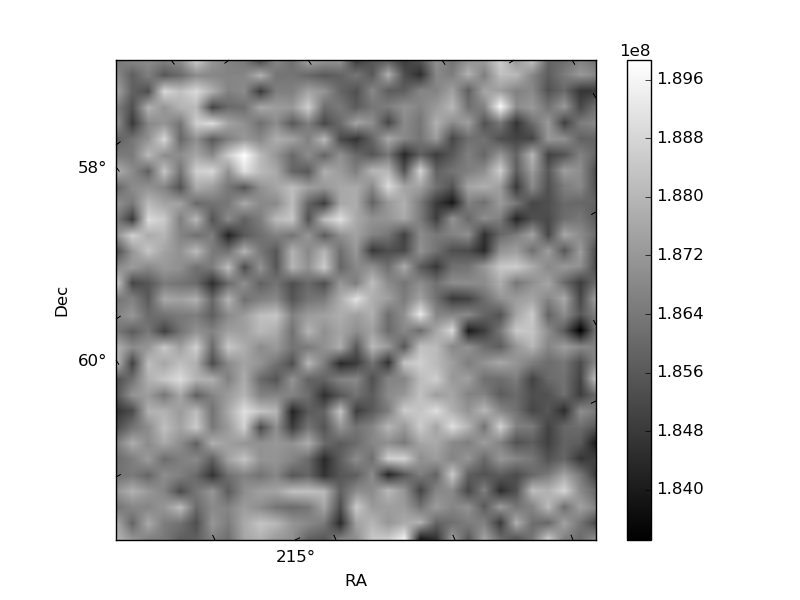
Histogram calculated using DETX and DETY for each event in the final _common_clean file
| Quadrant A | 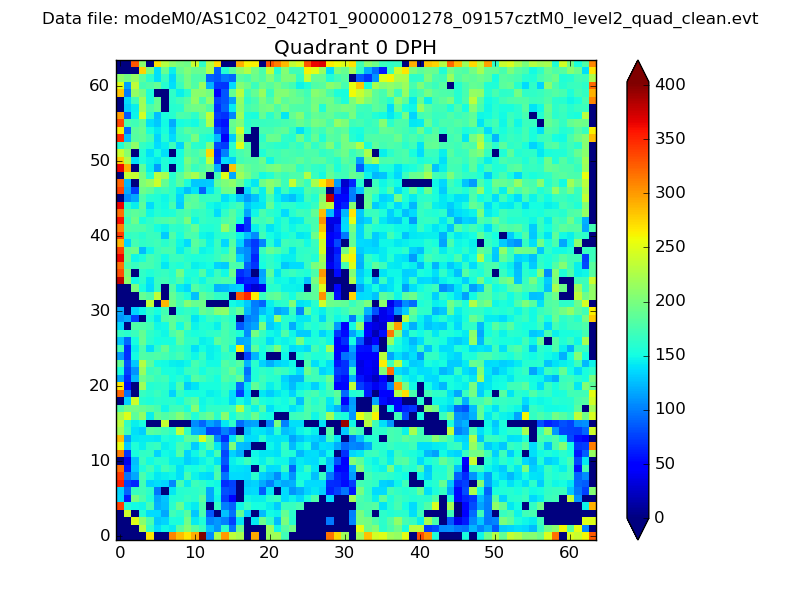 |
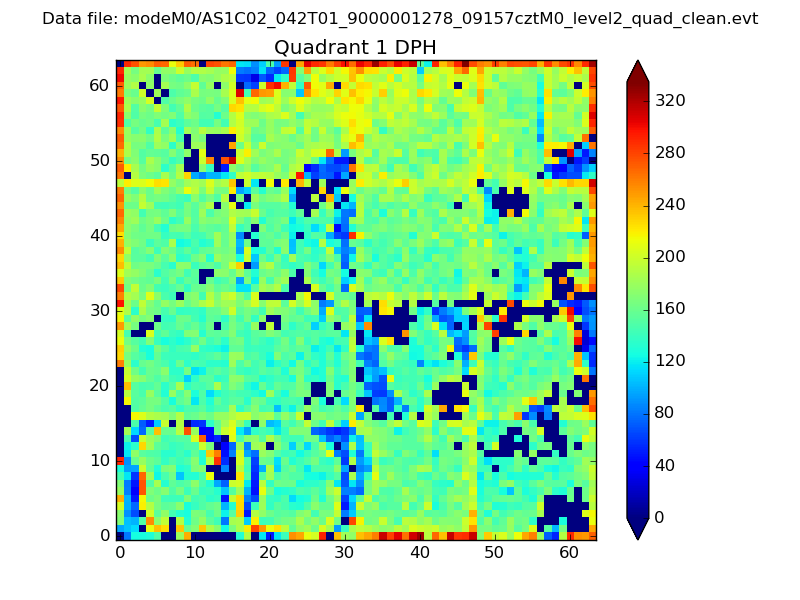 |
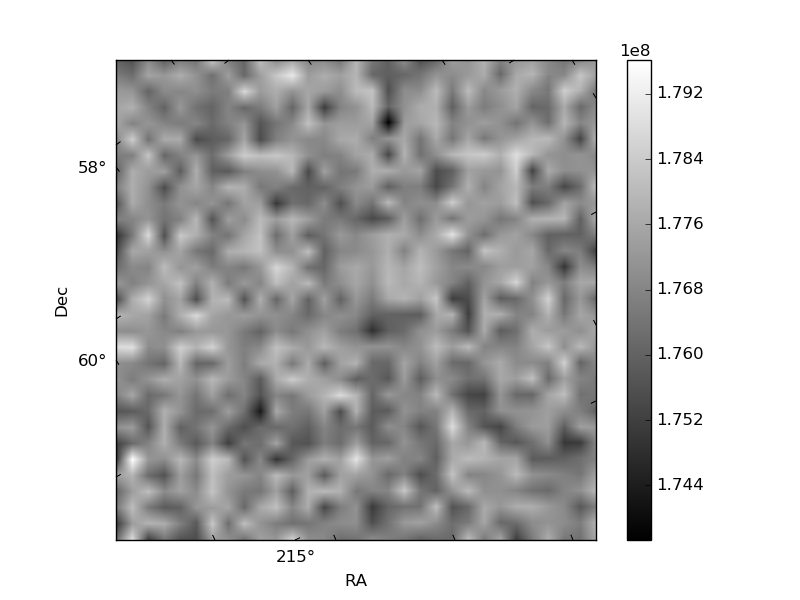
Quadrant B |
|---|---|---|---|
| Quadrant D | 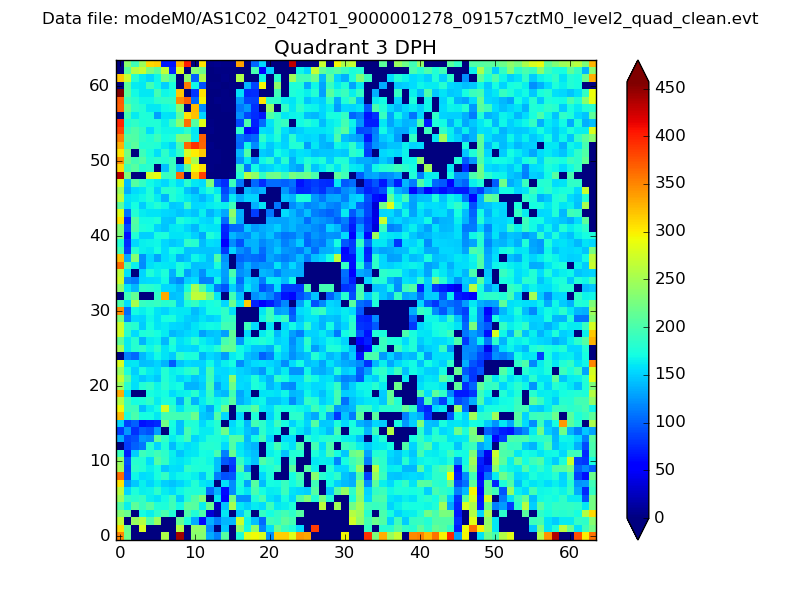 |
 |
Quadrant C |
| Plot type | Count rate plots | Images |
|---|---|---|
| Comparison with Poisson distribution Blue bars denote a histogram of data divided into 1 sec bins. Red curve is a Poisson curve with rate = median count rate of data. |
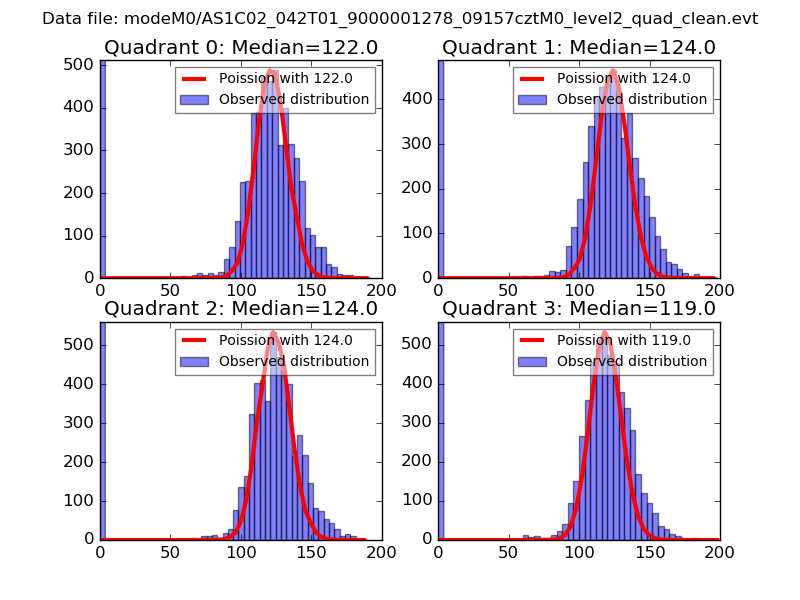 |
 |
| Quadrant-wise count rates Data is divided into 100 sec bins |
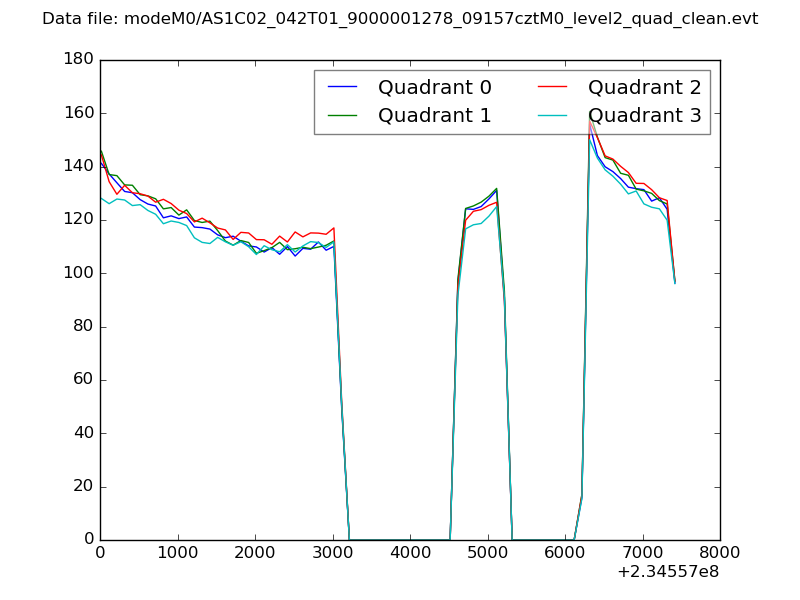 |
|
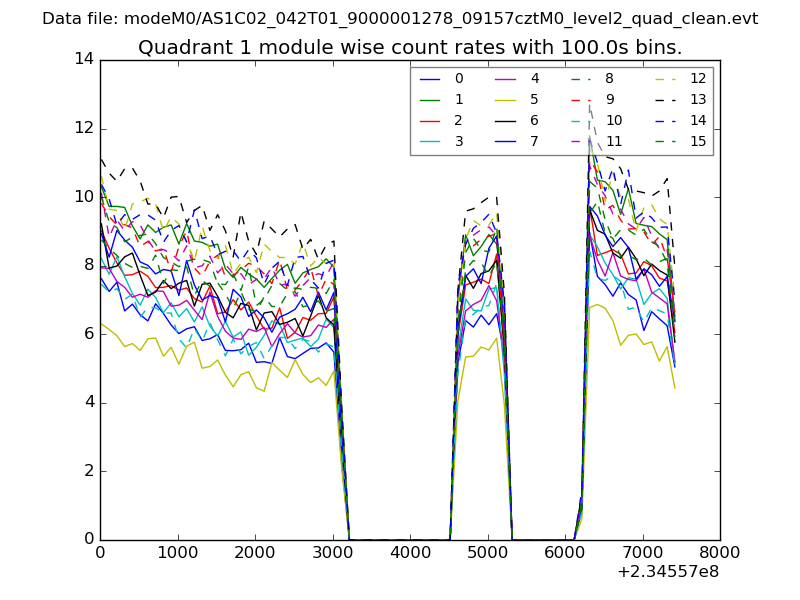
| Module-wise count rates for Quadrant A Data is divided into 100 sec bins |
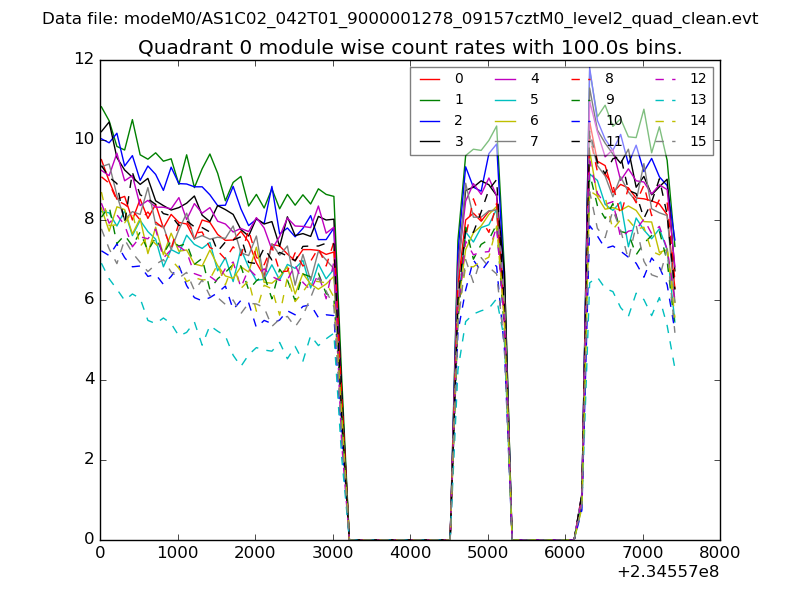 |
 |
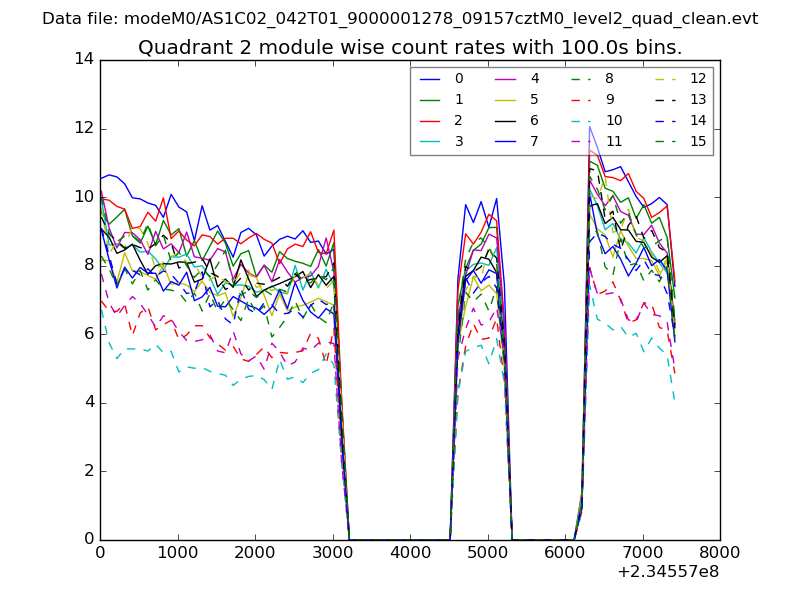
| Module-wise count rates for Quadrant B Data is divided into 100 sec bins |
 |
 |
| Module-wise count rates for Quadrant C Data is divided into 100 sec bins |
 |
 |
| Module-wise count rates for Quadrant D Data is divided into 100 sec bins |
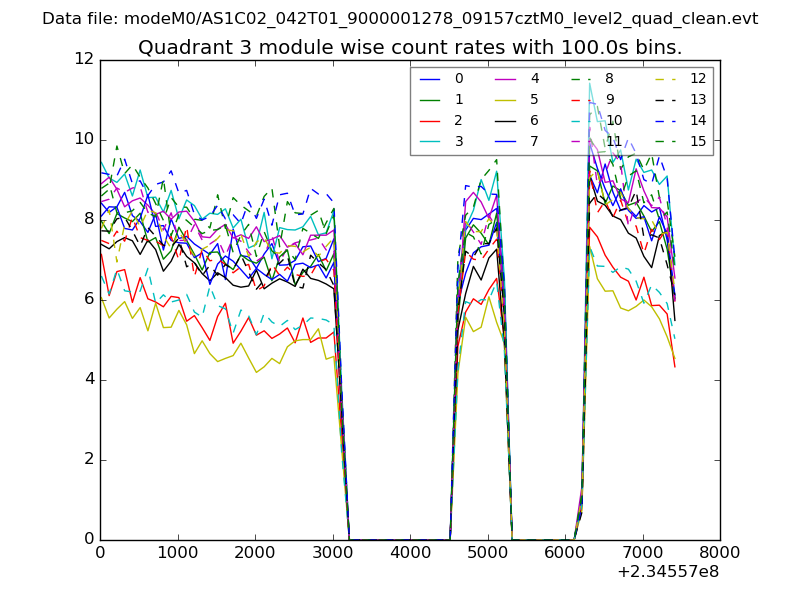 |
 |
| Parameter | Plot |
|---|---|
| CZT HV Monitor | 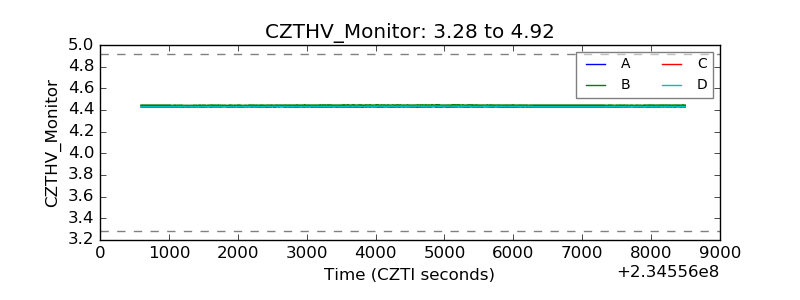 |
| D_VDD | 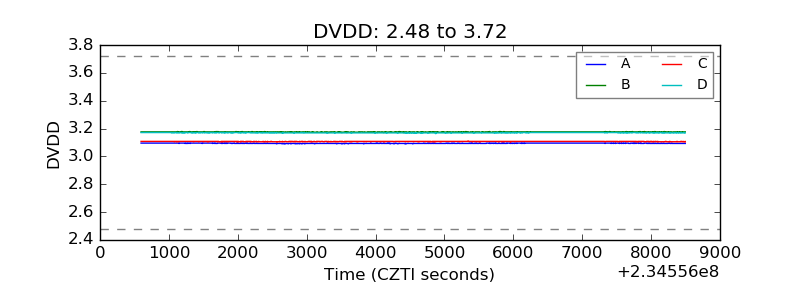 |
| Temperature 1 | 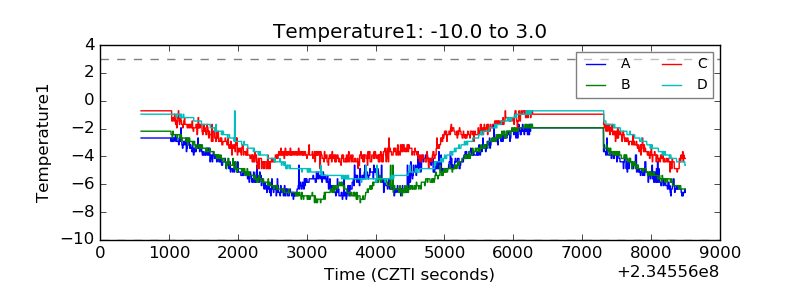 |
| Veto HV Monitor |  |
| Veto LLD | 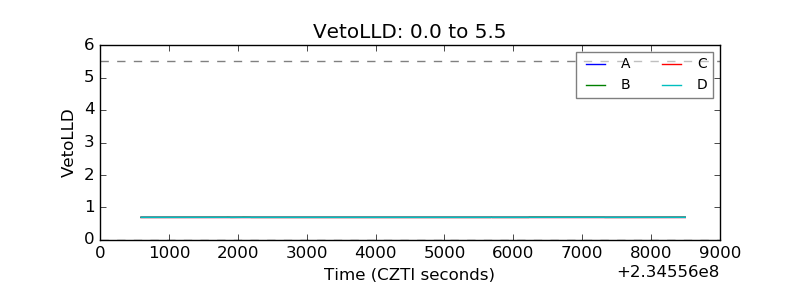 |
| Alpha Counter | 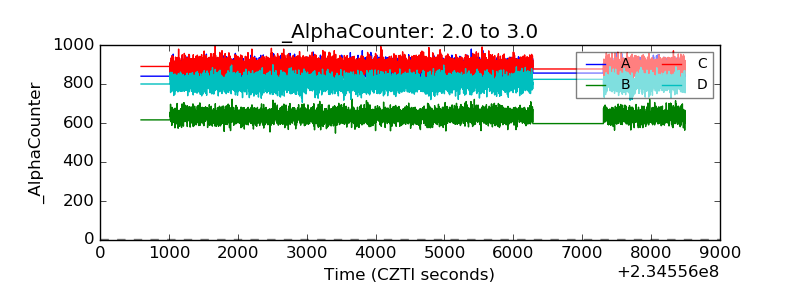 |
| _CPM_Rate | 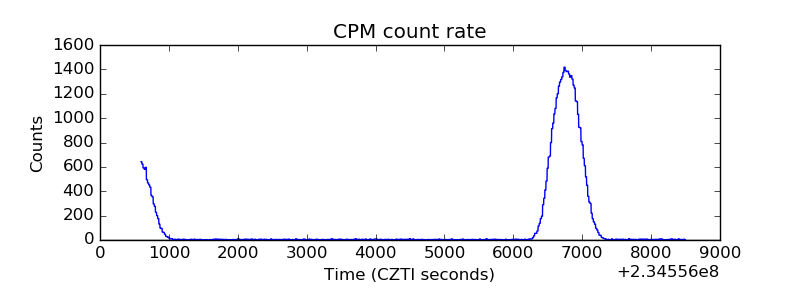 |
| CZT Counter |  |
| +2.5 Volts monitor | 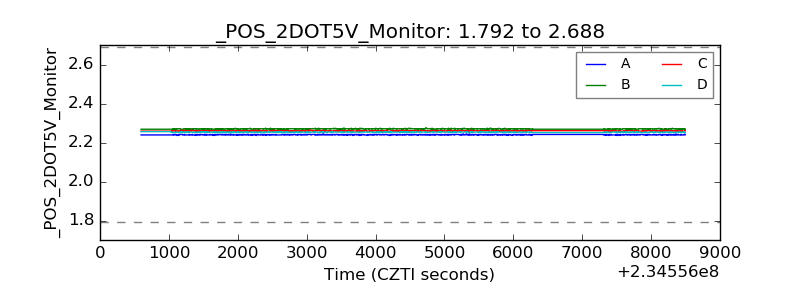 |
| +5 Volts monitor |  |
| _ROLL_ROT | 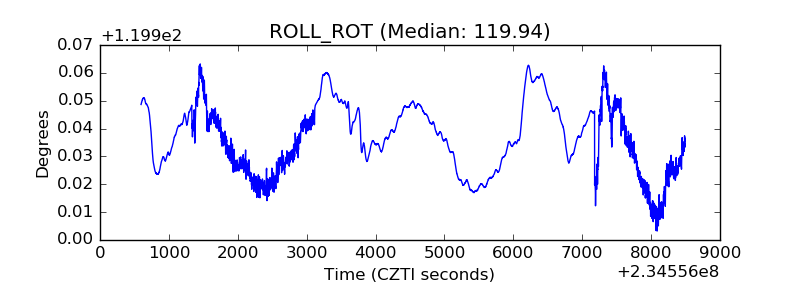 |
| _Roll_DEC | 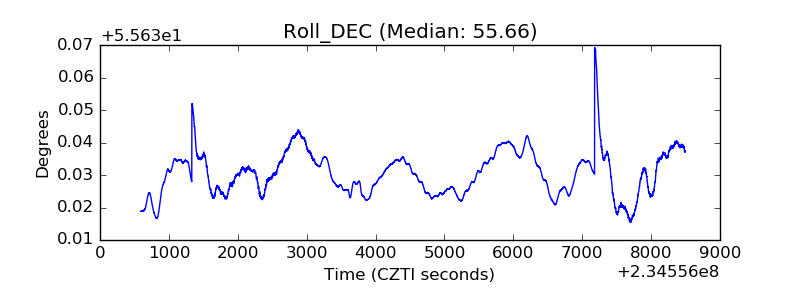 |
| _Roll_RA | 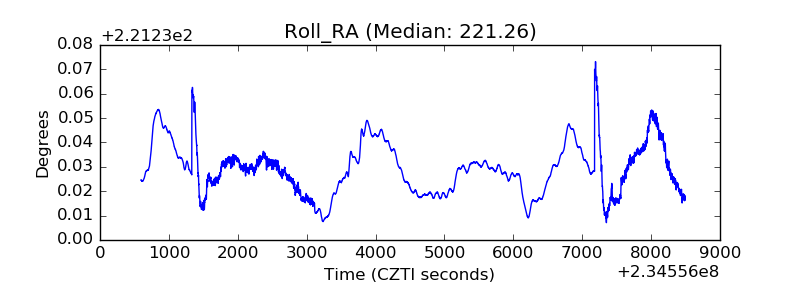 |
| Veto Counter | 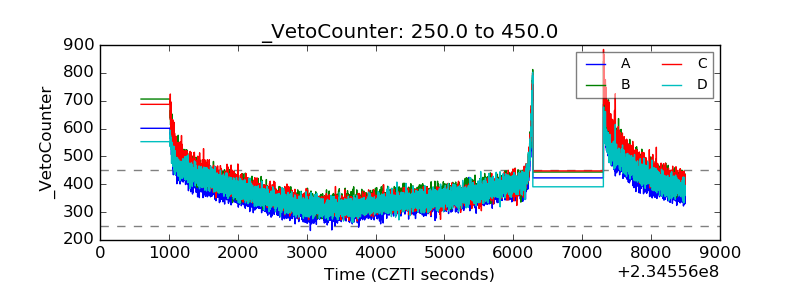 |