| Param | Original file | Final file |
|---|---|---|
| Filename | modeM0/AS1C02_042T01_9000001278_09160cztM0_level2.evt | modeM0/AS1C02_042T01_9000001278_09160cztM0_level2_quad_clean.evt |
| Size (bytes) | 416,649,600 | 96,347,520 |
| Size | 397.3 MB | 91.9 MB |
| Events in quadrant A | 3,433,863 | 618,968 |
| Events in quadrant B | 3,051,336 | 640,481 |
| Events in quadrant C | 2,771,228 | 634,428 |
| Events in quadrant D | 2,949,097 | 600,188 |
| Mode M0 | |||
|---|---|---|---|
| Quadrant | BADHDUFLAG | Total packets | Discarded packets |
| A | 0 | 14277 | 138 |
| B | 0 | 13363 | 147 |
| C | 0 | 12550 | 87 |
| D | 0 | 13307 | 94 |
| Mode M9 | |||
|---|---|---|---|
| Quadrant | BADHDUFLAG | Total packets | Discarded packets |
| A | 0 | 20 | 0 |
| B | 0 | 20 | 0 |
| C | 0 | 20 | 0 |
| D | 0 | 21 | 0 |
| Mode SS | |||
|---|---|---|---|
| Quadrant | BADHDUFLAG | Total packets | Discarded packets |
| A | 0 | 124 | 2 |
| B | 0 | 124 | 0 |
| C | 0 | 124 | 4 |
| D | 0 | 124 | 4 |
| Quadrant | Total seconds | Saturated seconds | Saturation percentage |
|---|---|---|---|
| A | 6071 | 51 | 0.840059% |
| B | 6065 | 49 | 0.807914% |
| C | 6086 | 14 | 0.230036% |
| D | 6084 | 30 | 0.493097% |
Noise dominated data is calculated using 1-second bins in cleaned event files. If a bin has >2000 counts, and if more than 50% of those come from <1% of pixels, then it is considered to be noise-dominated and hence unusable.
| Quadrant | # 1 sec bins | Bins with >0 counts | Bins with >2000 counts | High rate bins dominated by noise | Noise dominated (total time) | Noise dominated (detector-on time) | Marked lightcurve |
|---|---|---|---|---|---|---|---|
| A | 7403 | 6128 | 21 | 21 | 0.28% | 0.34% | 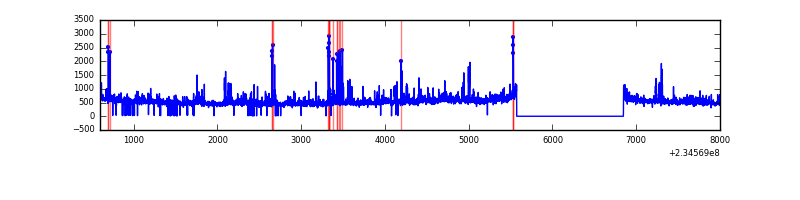 |
| B | 7403 | 6126 | 12 | 12 | 0.16% | 0.20% | 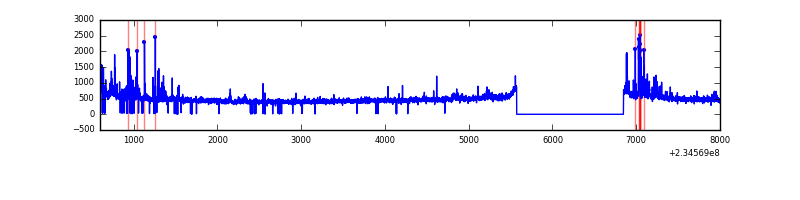 |
| C | 7403 | 6128 | 0 | 0 | 0.00% | 0.00% | 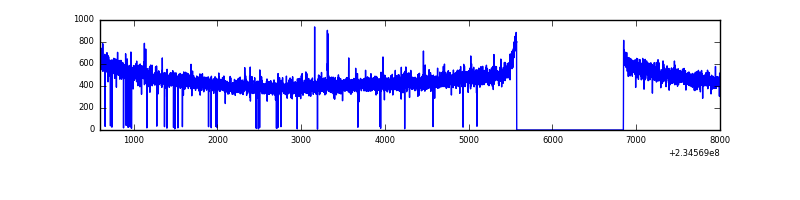 |
| D | 7403 | 6129 | 25 | 25 | 0.34% | 0.41% |  |
Top three noisy pixels from each quadrant. If the there are fewer than three noisy pixels in the level2.evt file, extra rows are filled as -1
| Pixel properties | Quadrant properties | ||||||
|---|---|---|---|---|---|---|---|
| Quadrant | DetID | PixID | Counts | Sigma | Mean | Median | Sigma |
| A | 8 | 5 | 541511 | 3765.86 | 713 | 700 | 143.6 |
| A | 1 | 162 | 71708 | 494.45 | 713 | 700 | 143.6 |
| A | 13 | 251 | 26103 | 176.89 | 713 | 700 | 143.6 |
| B | 8 | 234 | 86586 | 640.8 | 727 | 710 | 134.0 |
| B | 0 | 85 | 67155 | 495.81 | 727 | 710 | 134.0 |
| B | 0 | 219 | 21435 | 154.65 | 727 | 710 | 134.0 |
| C | 13 | 61 | 5281 | 28.02 | 709 | 714 | 163.0 |
| C | 12 | 4 | 4384 | 22.52 | 709 | 714 | 163.0 |
| C | 8 | 222 | 3478 | 16.96 | 709 | 714 | 163.0 |
| D | 1 | 52 | 108371 | 593.66 | 691 | 675 | 181.4 |
| D | 7 | 71 | 67392 | 367.77 | 691 | 675 | 181.4 |
| D | 2 | 14 | 57702 | 314.35 | 691 | 675 | 181.4 |
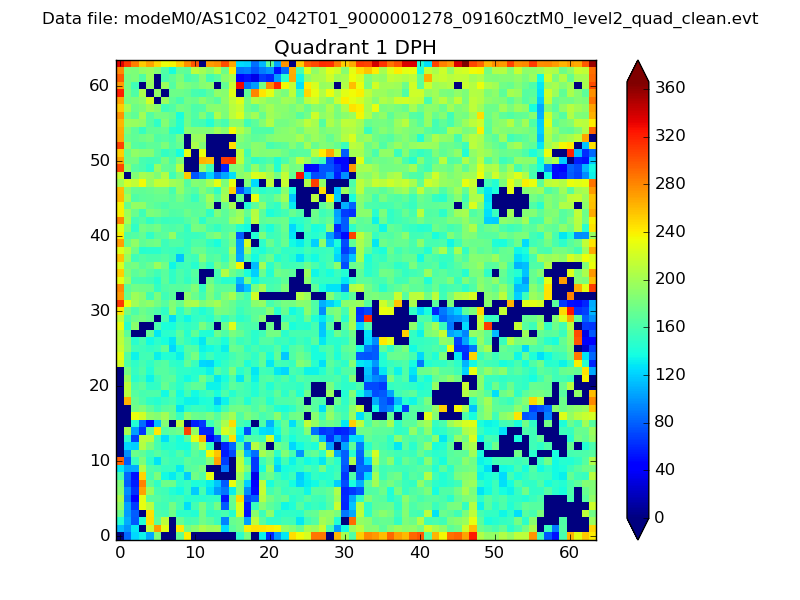
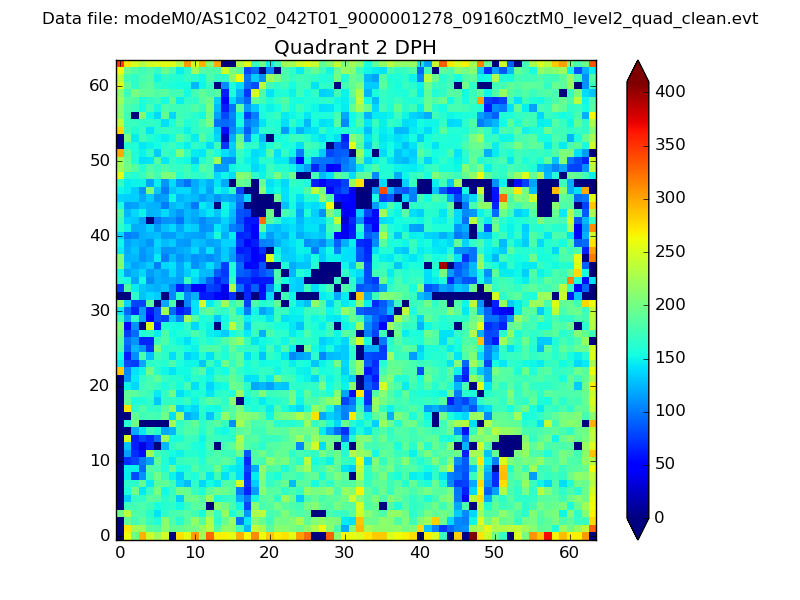
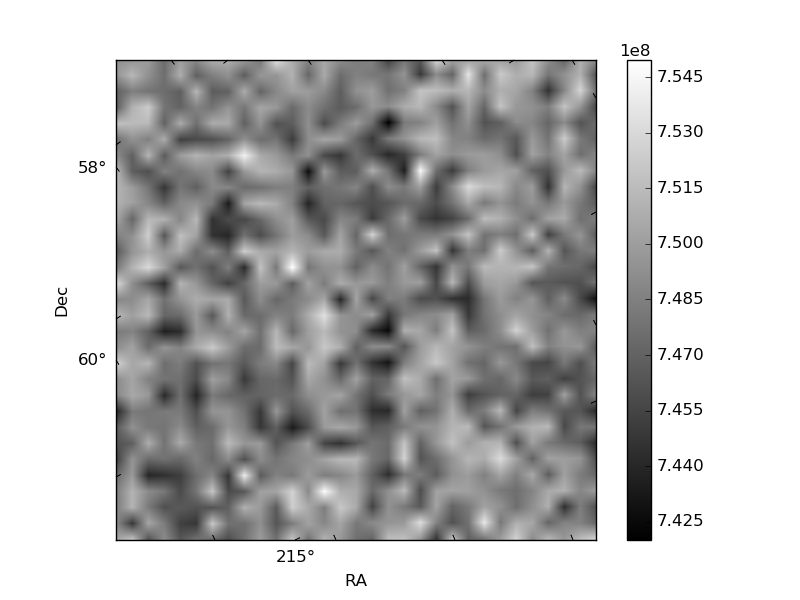
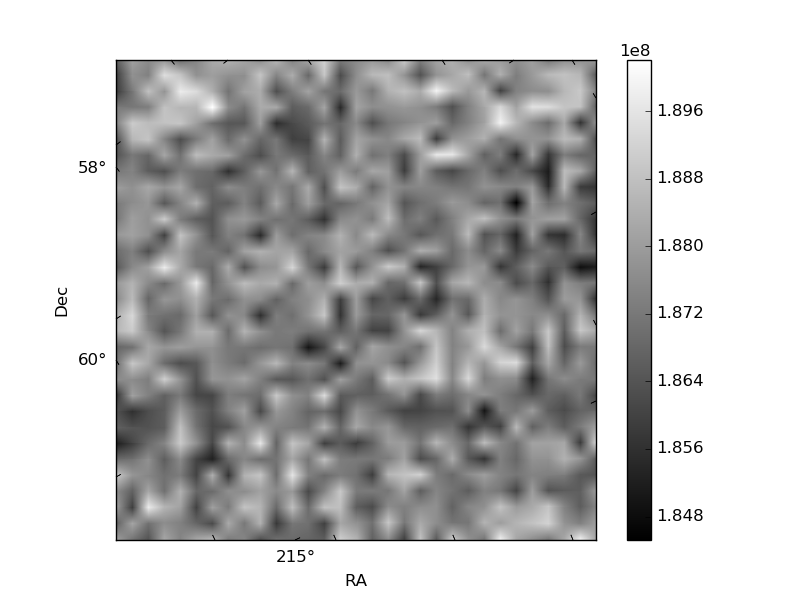
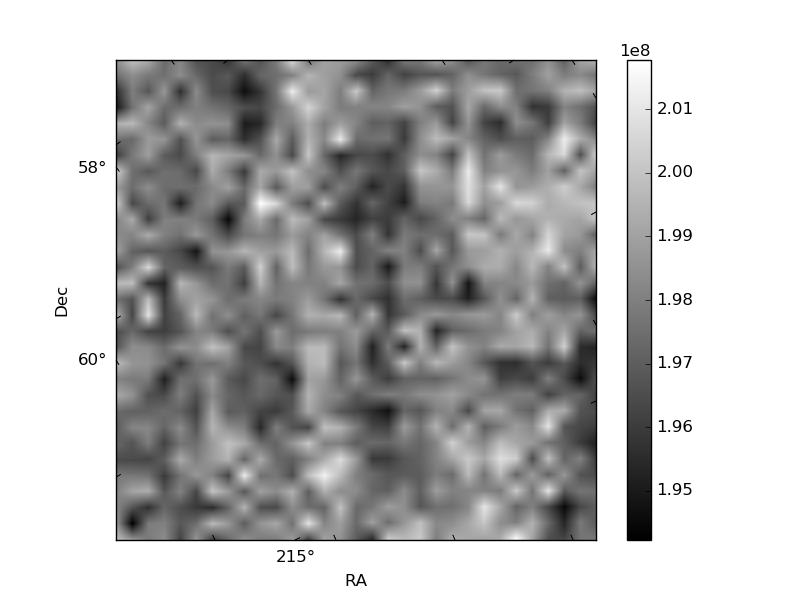
Histogram calculated using DETX and DETY for each event in the final _common_clean file
| Quadrant A | 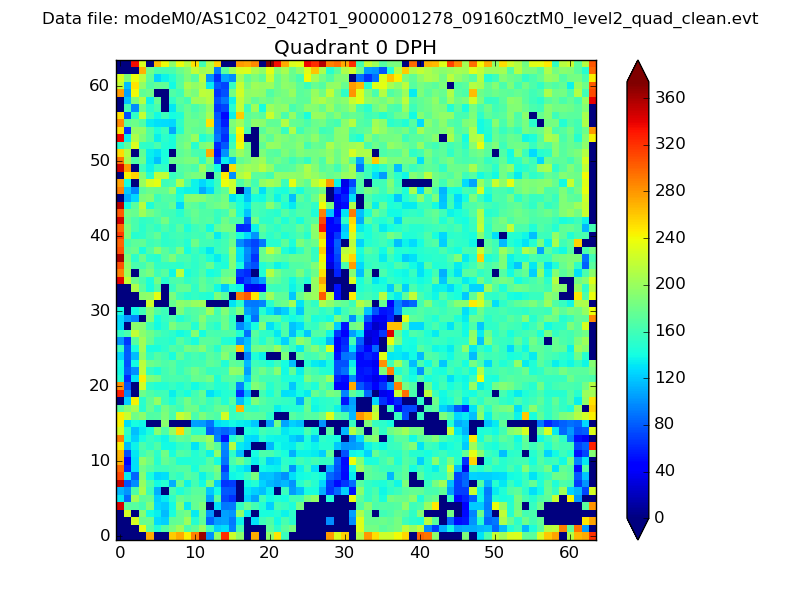 |
 |
Quadrant B |
|---|---|---|---|
| Quadrant D | 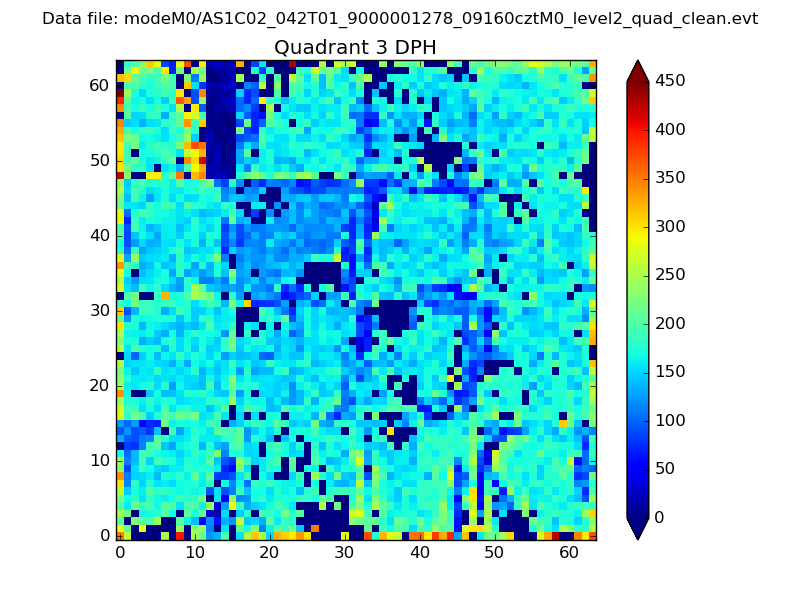 |
 |
Quadrant C |
| Plot type | Count rate plots | Images |
|---|---|---|
| Comparison with Poisson distribution Blue bars denote a histogram of data divided into 1 sec bins. Red curve is a Poisson curve with rate = median count rate of data. |
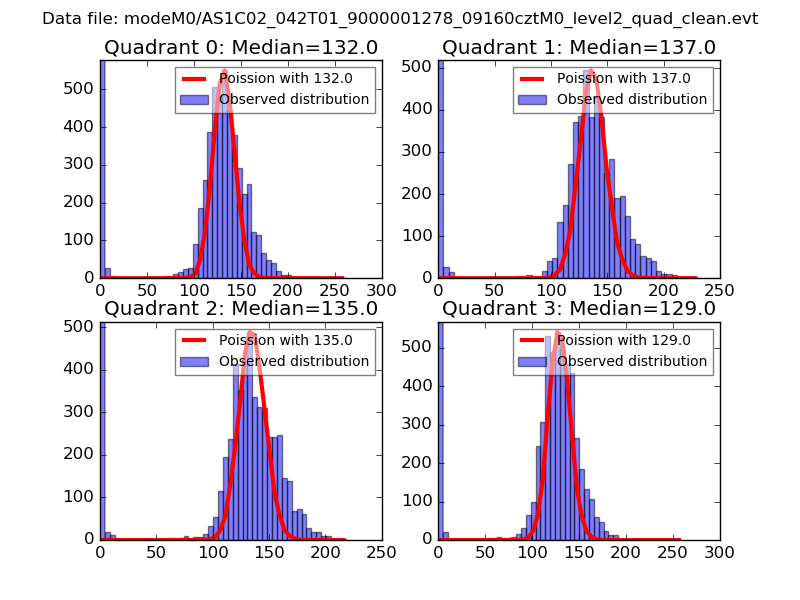 |
 |
| Quadrant-wise count rates Data is divided into 100 sec bins |
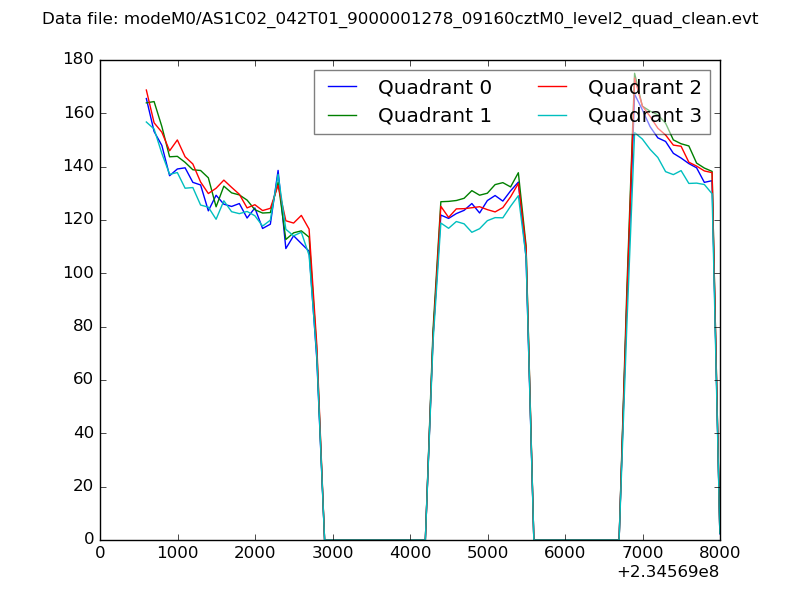 |
|
| Module-wise count rates for Quadrant A Data is divided into 100 sec bins |
 |
 |
| Module-wise count rates for Quadrant B Data is divided into 100 sec bins |
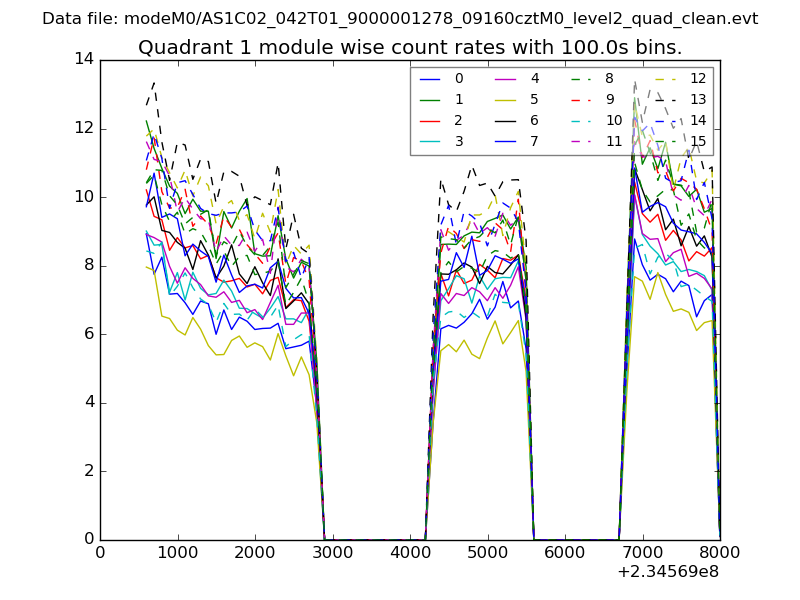 |
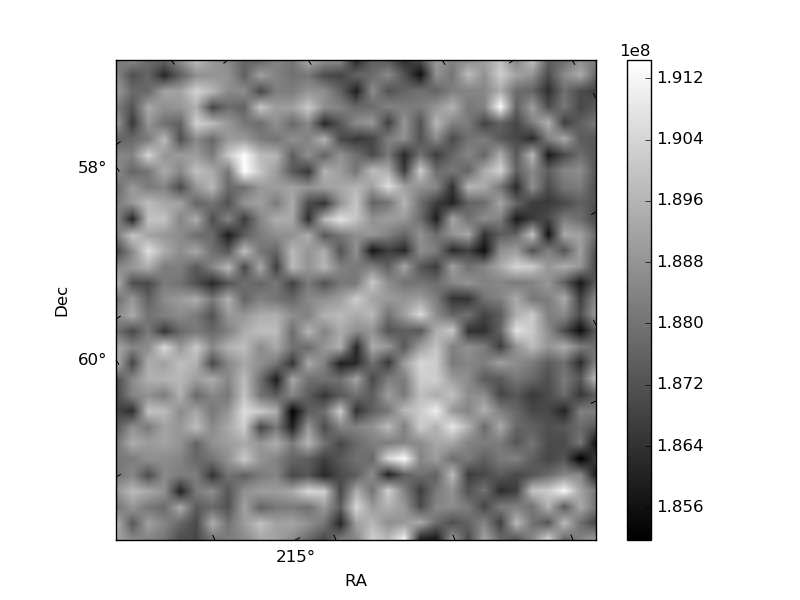 |
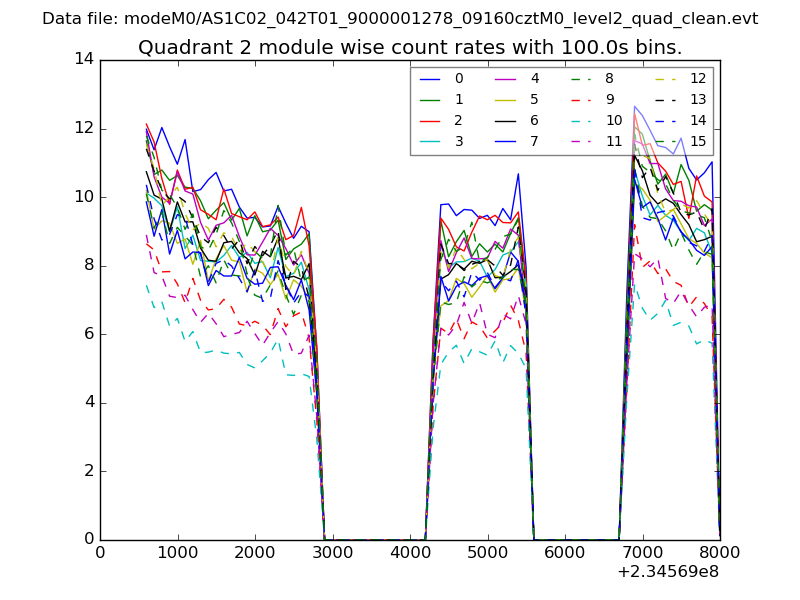
| Module-wise count rates for Quadrant C Data is divided into 100 sec bins |
 |
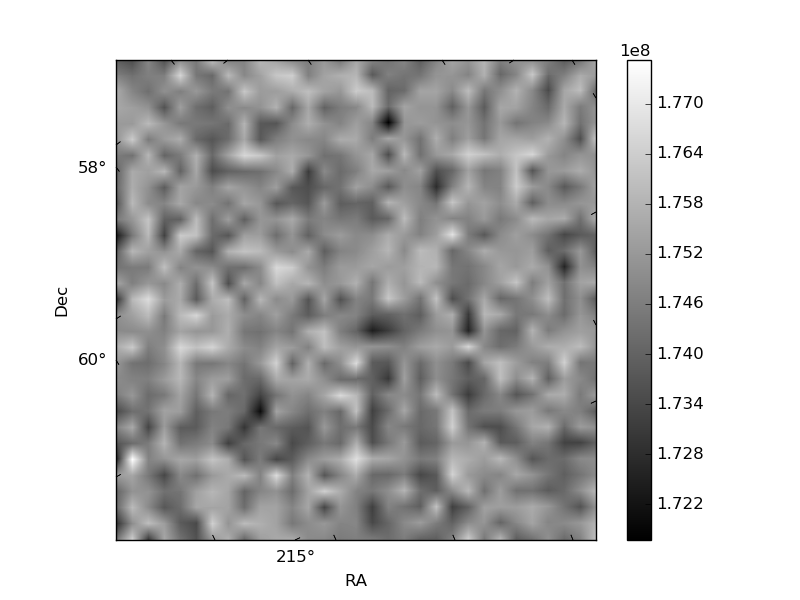 |
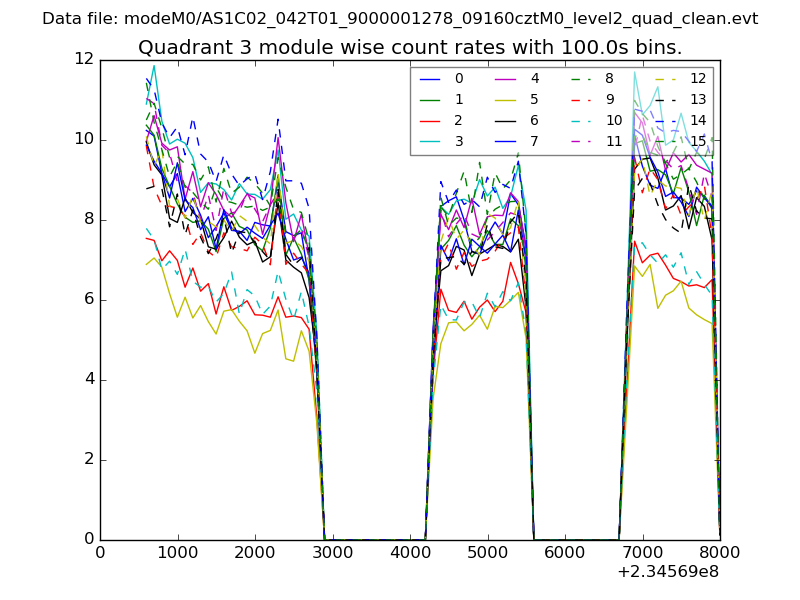
| Module-wise count rates for Quadrant D Data is divided into 100 sec bins |
 |
 |
| Parameter | Plot |
|---|---|
| CZT HV Monitor | 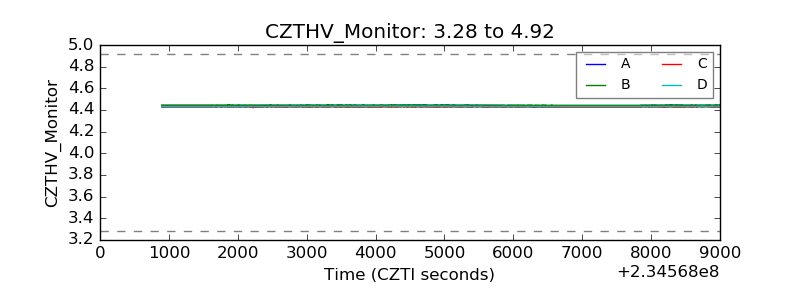 |
| D_VDD | 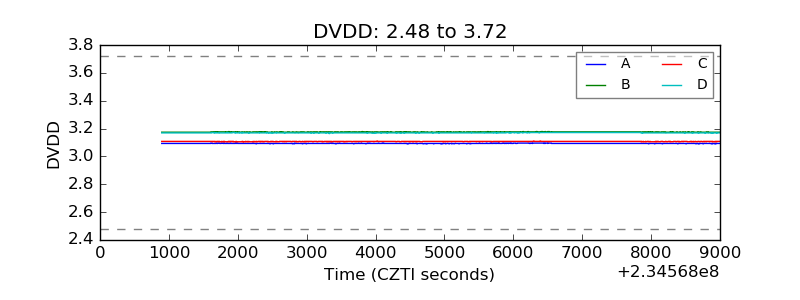 |
| Temperature 1 | 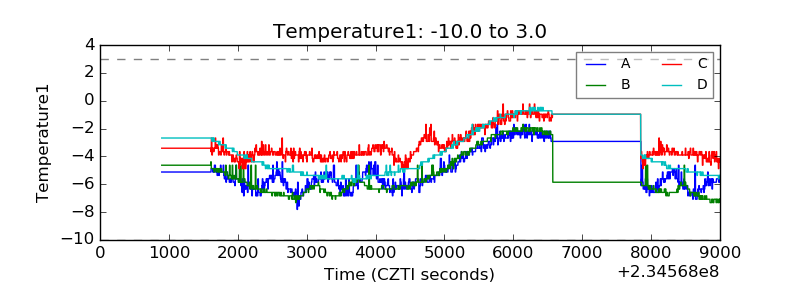 |
| Veto HV Monitor | 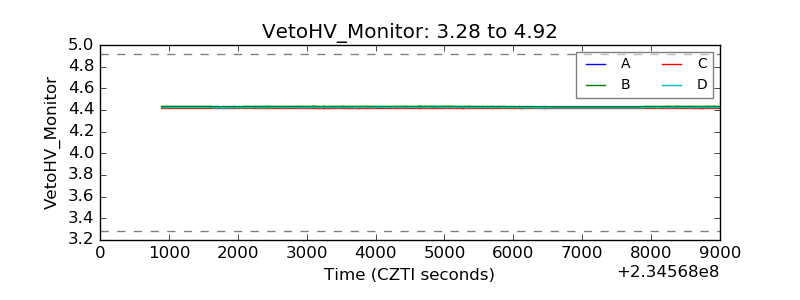 |
| Veto LLD |  |
| Alpha Counter | 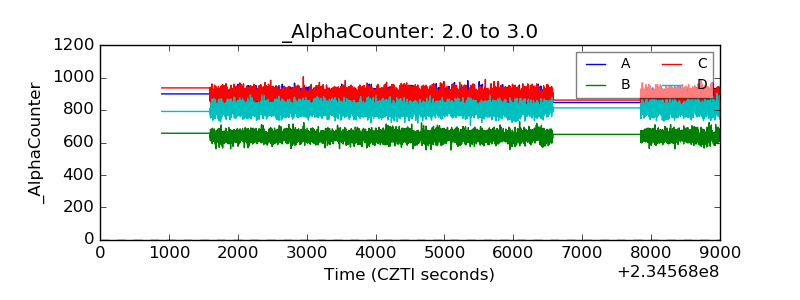 |
| _CPM_Rate | 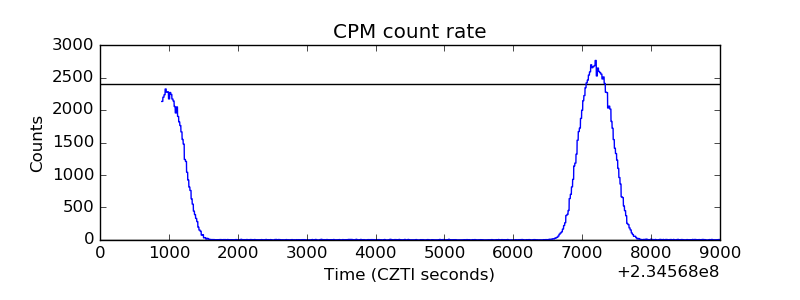 |
| CZT Counter | 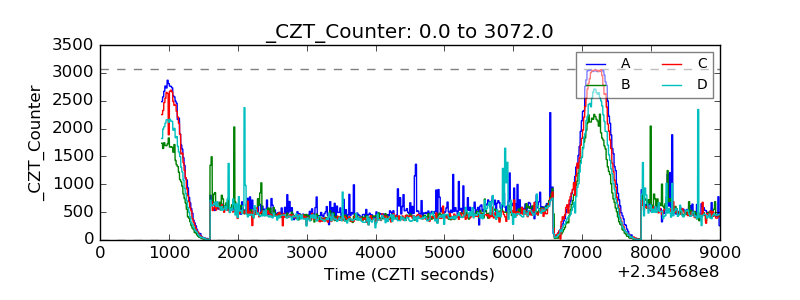 |
| +2.5 Volts monitor |  |
| +5 Volts monitor |  |
| _ROLL_ROT |  |
| _Roll_DEC | 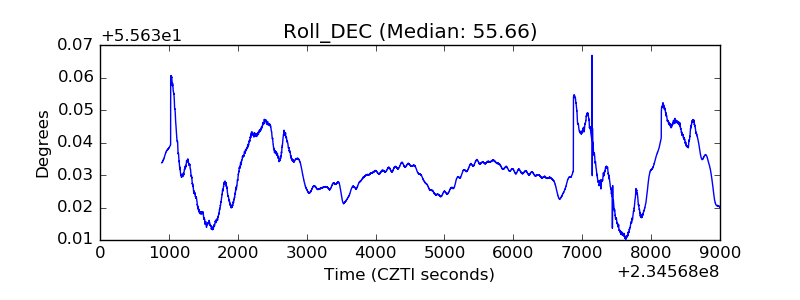 |
| _Roll_RA | 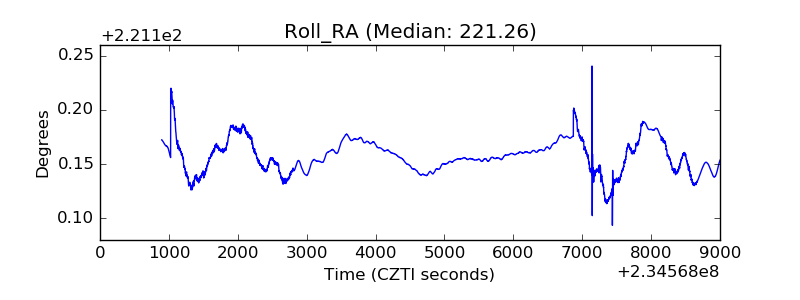 |
| Veto Counter | 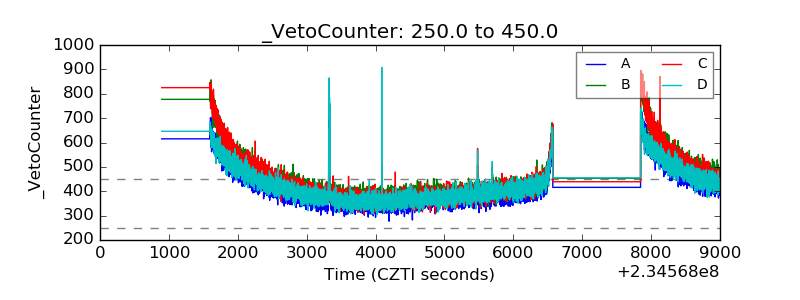 |