| Param | Original file | Final file |
|---|---|---|
| Filename | modeM0/AS1C02_027T01_9000001280cztM0_level2.fits | modeM0/AS1C02_027T01_9000001280cztM0_level2_quad_clean.evt |
| Size (bytes) | 540,665,280 | 780,013,440 |
| Size | 515.6 MB | 743.9 MB |
| Events in quadrant A | 3,214,840 | 5,064,835 |
| Events in quadrant B | 3,118,952 | 5,071,871 |
| Events in quadrant C | 3,228,320 | 4,942,591 |
| Events in quadrant D | 2,768,288 | 4,504,931 |
| Mode M0 | |||
|---|---|---|---|
| Quadrant | BADHDUFLAG | Total packets | Discarded packets |
| A | 0 | 137302 | 0 |
| B | 0 | 132686 | 0 |
| C | 0 | 120254 | 0 |
| D | 0 | 140258 | 0 |
| Mode M9 | |||
|---|---|---|---|
| Quadrant | BADHDUFLAG | Total packets | Discarded packets |
| A | 0 | 85 | 0 |
| B | 0 | 85 | 0 |
| C | 0 | 85 | 0 |
| D | 0 | 85 | 0 |
| Mode SS | |||
|---|---|---|---|
| Quadrant | BADHDUFLAG | Total packets | Discarded packets |
| A | 0 | 1200 | 0 |
| B | 0 | 1200 | 0 |
| C | 0 | 1200 | 0 |
| D | 0 | 1200 | 0 |
| Quadrant | Total seconds | Saturated seconds | Saturation percentage |
|---|---|---|---|
| A | 58934 | 1403 | 2.380629% |
| B | 58935 | 1449 | 2.458641% |
| C | 58935 | 738 | 1.252227% |
| D | 58935 | 2032 | 3.447866% |
Noise dominated data is calculated using 1-second bins in cleaned event files. If a bin has >2000 counts, and if more than 50% of those come from <1% of pixels, then it is considered to be noise-dominated and hence unusable.
| Quadrant | # 1 sec bins | Bins with >0 counts | Bins with >2000 counts | High rate bins dominated by noise | Noise dominated (total time) | Noise dominated (detector-on time) | Marked lightcurve |
|---|---|---|---|---|---|---|---|
| A | 67289 | 58921 | 0 | 0 | 0.00% | 0.00% | 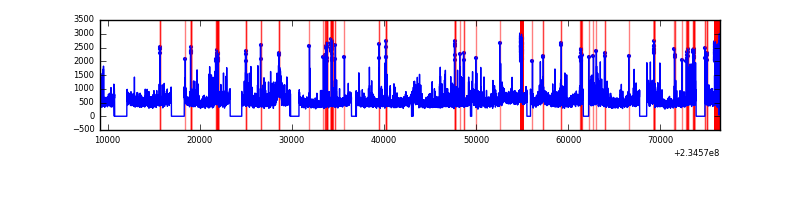 |
| B | 67289 | 58922 | 0 | 0 | 0.00% | 0.00% | 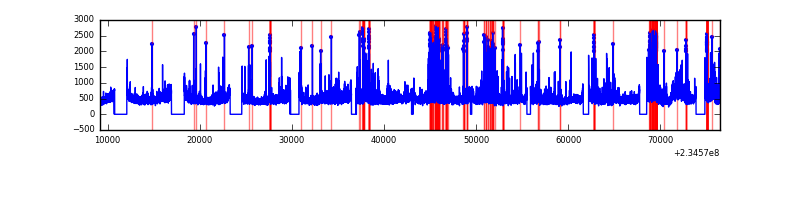 |
| C | 67289 | 58923 | 0 | 0 | 0.00% | 0.00% | 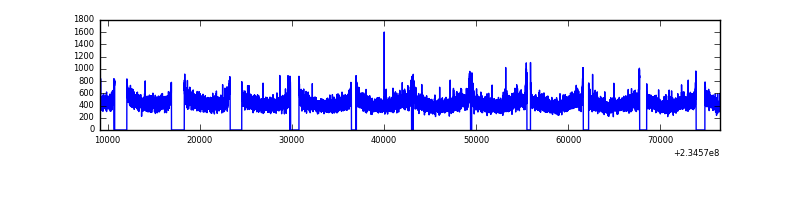 |
| D | 67289 | 58852 | 0 | 0 | 0.00% | 0.00% | 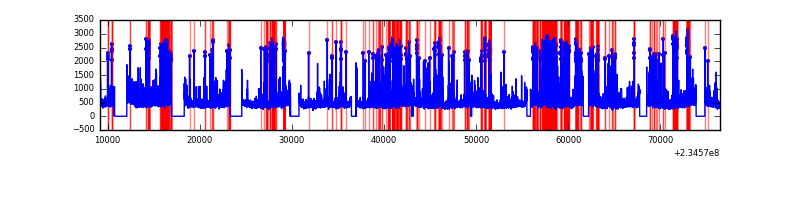 |
Top three noisy pixels from each quadrant. If the there are fewer than three noisy pixels in the level2.evt file, extra rows are filled as -1
| Pixel properties | Quadrant properties | ||||||
|---|---|---|---|---|---|---|---|
| Quadrant | DetID | PixID | Counts | Sigma | Mean | Median | Sigma |
| A | 0 | 29 | 3222 | 11.59 | 837 | 785 | 210.2 |
| A | 7 | 110 | 2604 | 8.65 | 837 | 785 | 210.2 |
| A | 0 | 30 | 2542 | 8.36 | 837 | 785 | 210.2 |
| B | 2 | 9 | 2788 | 12.51 | 823 | 785 | 160.1 |
| B | 3 | 17 | 2108 | 8.26 | 823 | 785 | 160.1 |
| B | 12 | 226 | 2108 | 8.26 | 823 | 785 | 160.1 |
| C | 12 | 241 | 2242 | 6.55 | 852 | 794 | 221.1 |
| C | 2 | 191 | 2175 | 6.25 | 852 | 794 | 221.1 |
| C | 9 | 188 | 2130 | 6.04 | 852 | 794 | 221.1 |
| D | 3 | 14 | 2146 | 6.82 | 787 | 720 | 208.9 |
| D | 6 | 231 | 2061 | 6.42 | 787 | 720 | 208.9 |
| D | 3 | 31 | 1980 | 6.03 | 787 | 720 | 208.9 |
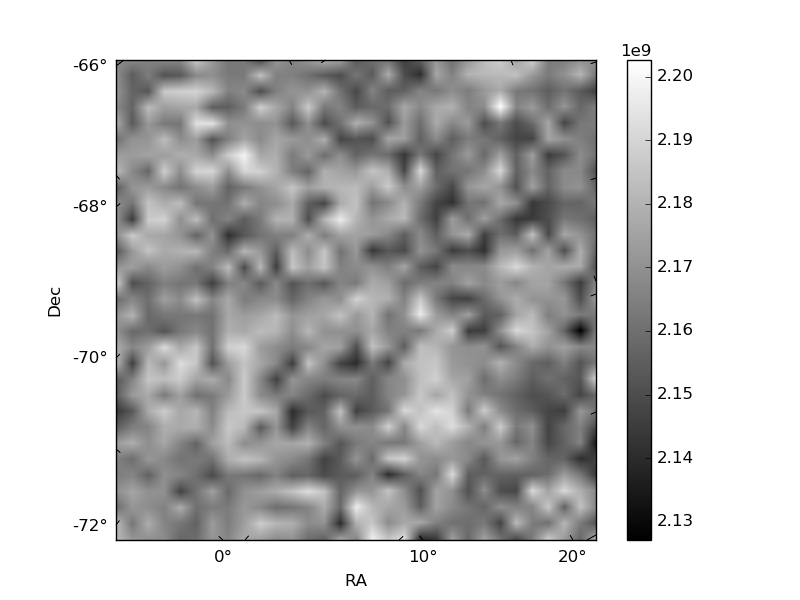
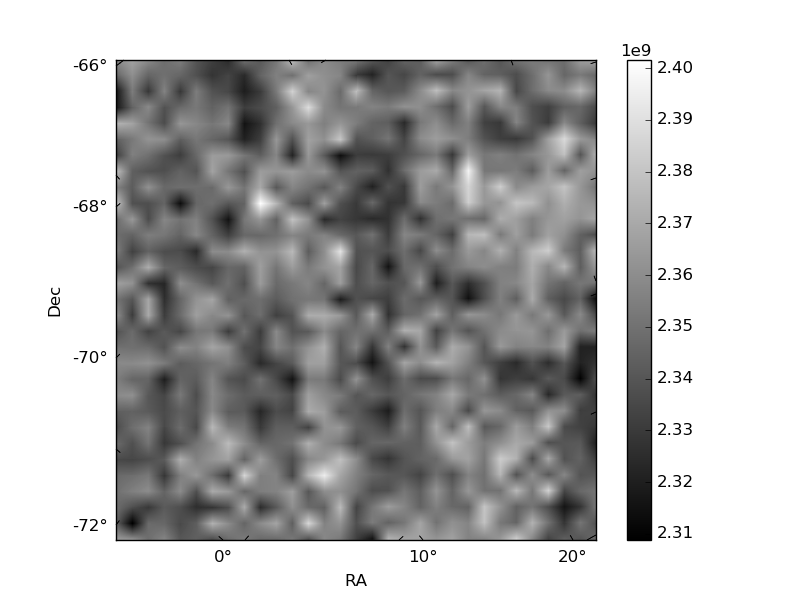
Histogram calculated using DETX and DETY for each event in the final _common_clean file
| Quadrant A | 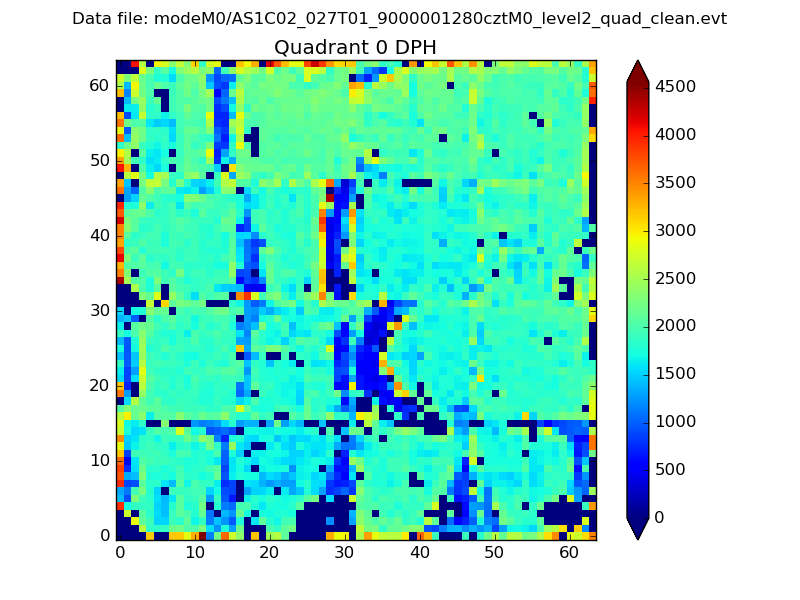 |
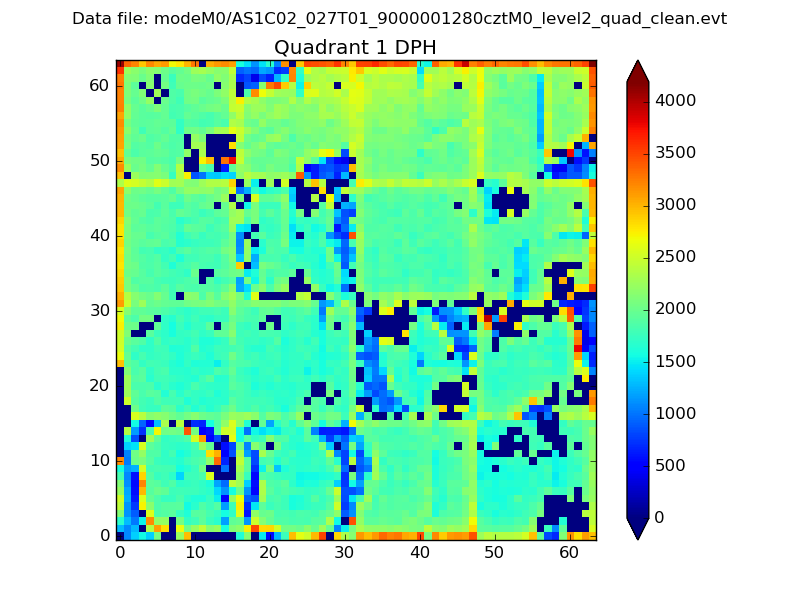 |
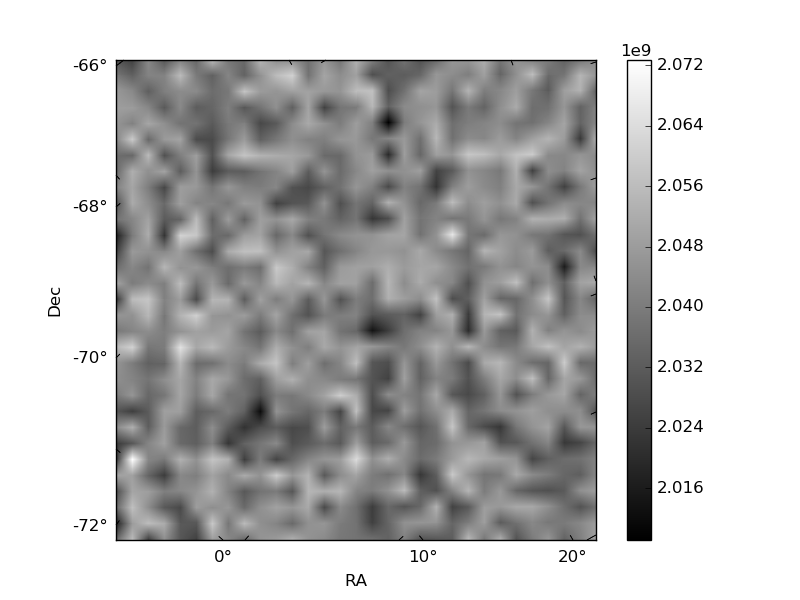
Quadrant B |
|---|---|---|---|
| Quadrant D | 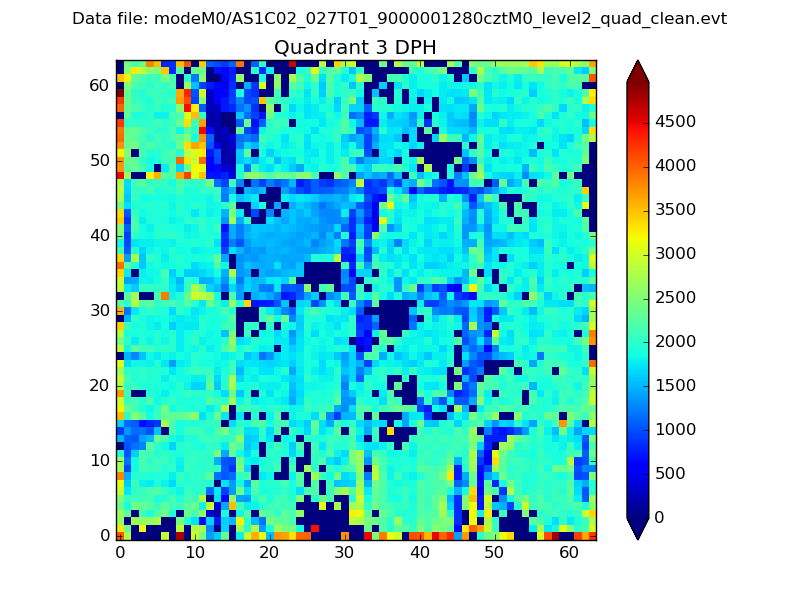 |
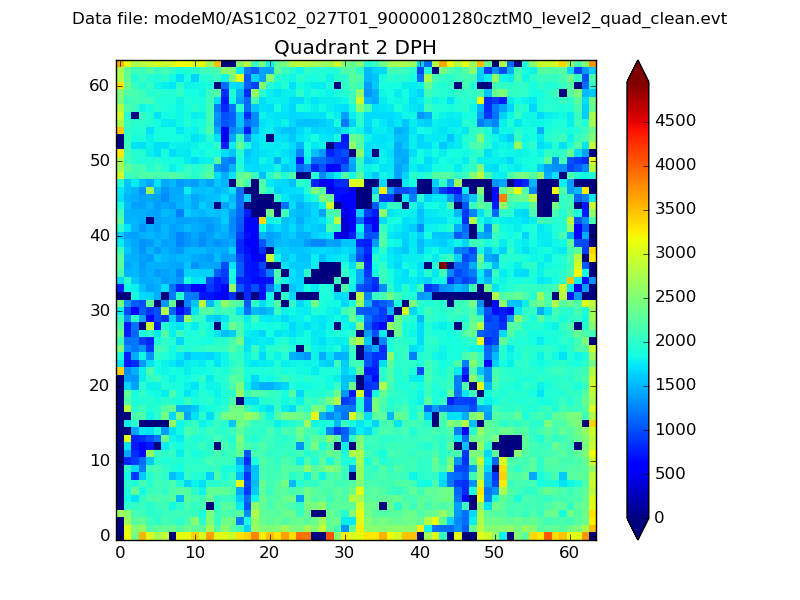 |
Quadrant C |
| Plot type | Count rate plots | Images |
|---|---|---|
| Comparison with Poisson distribution Blue bars denote a histogram of data divided into 1 sec bins. Red curve is a Poisson curve with rate = median count rate of data. |
 |
 |
| Quadrant-wise count rates Data is divided into 100 sec bins |
 |
|
| Module-wise count rates for Quadrant A Data is divided into 100 sec bins |
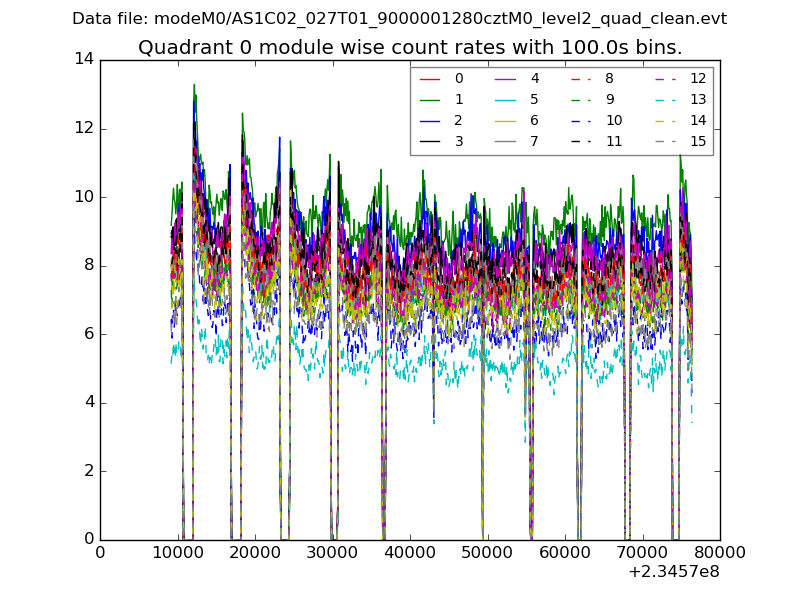 |
 |
| Module-wise count rates for Quadrant B Data is divided into 100 sec bins |
 |
 |
| Module-wise count rates for Quadrant C Data is divided into 100 sec bins |
 |
 |
| Module-wise count rates for Quadrant D Data is divided into 100 sec bins |
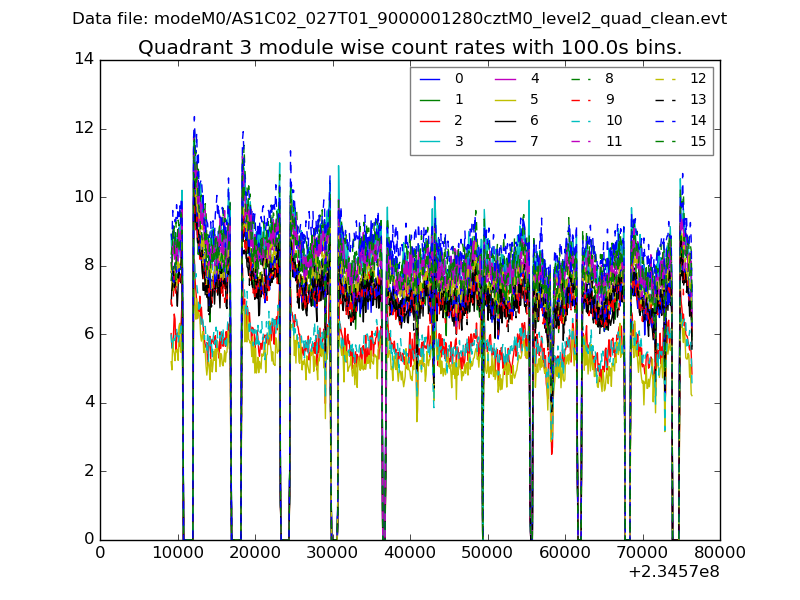 |
 |
| Parameter | Plot |
|---|---|
| CZT HV Monitor | 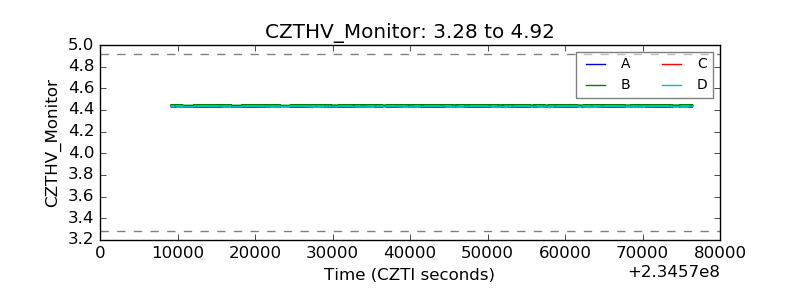 |
| D_VDD | 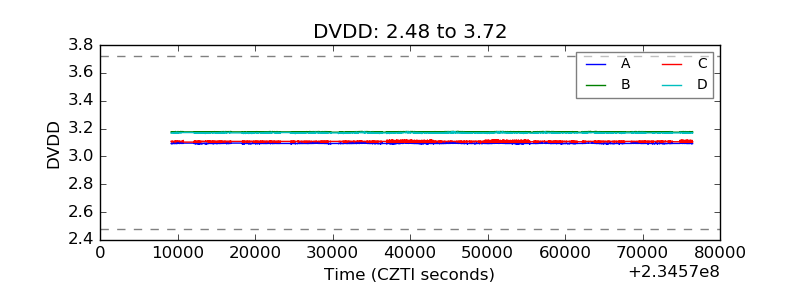 |
| Temperature 1 | 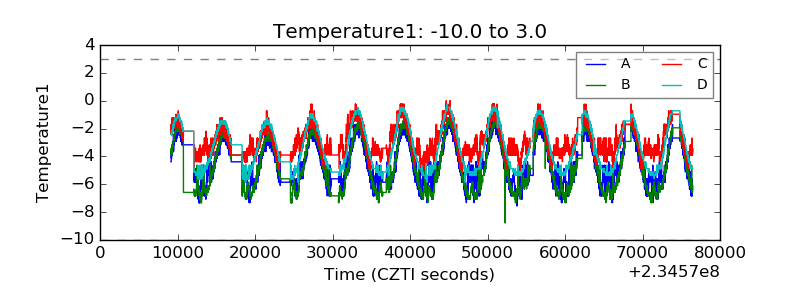 |
| Veto HV Monitor |  |
| Veto LLD |  |
| Alpha Counter |  |
| _CPM_Rate |  |
| CZT Counter | 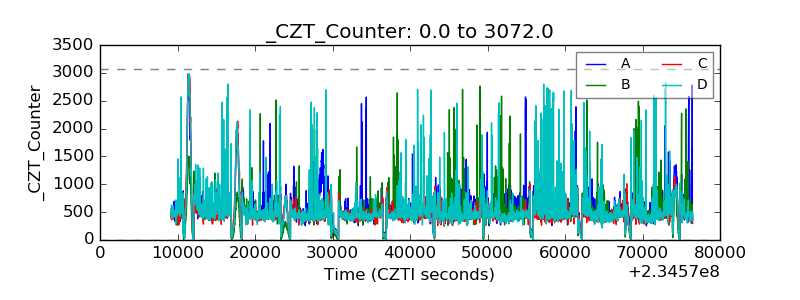 |
| +2.5 Volts monitor | 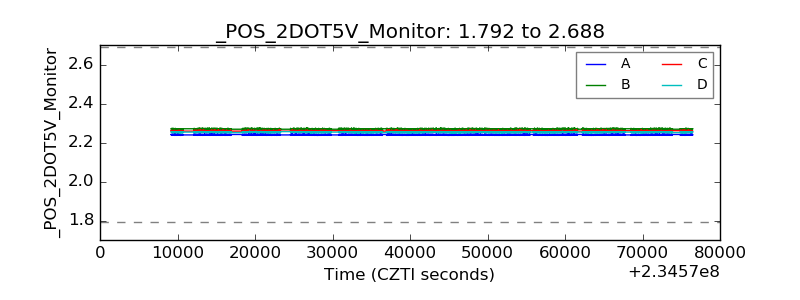 |
| +5 Volts monitor | 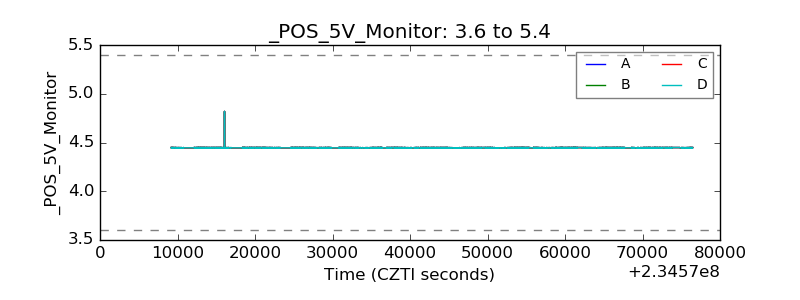 |
| _ROLL_ROT |  |
| _Roll_DEC | 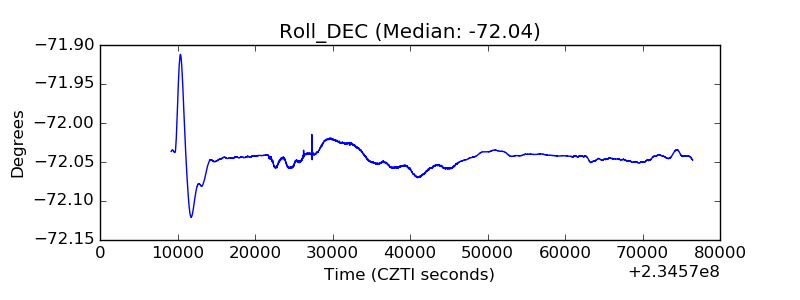 |
| _Roll_RA | 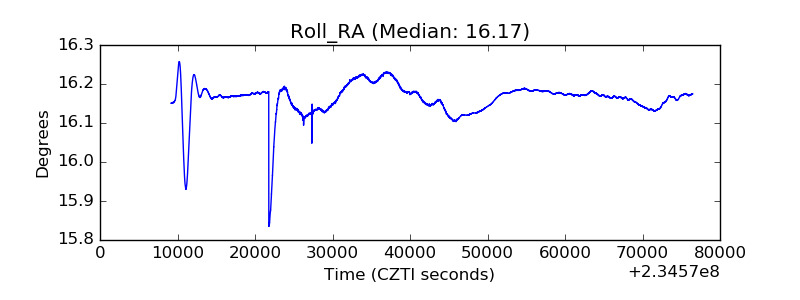 |
| Veto Counter |  |