| Param | Original file | Final file |
|---|---|---|
| Filename | modeM0/AS1C02_027T01_9000001280_09161cztM0_level2.evt | modeM0/AS1C02_027T01_9000001280_09161cztM0_level2_quad_clean.evt |
| Size (bytes) | 223,372,800 | 64,031,040 |
| Size | 213.0 MB | 61.1 MB |
| Events in quadrant A | 1,664,348 | 429,105 |
| Events in quadrant B | 1,575,467 | 439,071 |
| Events in quadrant C | 1,494,660 | 437,149 |
| Events in quadrant D | 1,819,849 | 415,109 |
| Mode M0 | |||
|---|---|---|---|
| Quadrant | BADHDUFLAG | Total packets | Discarded packets |
| A | 0 | 6858 | 2 |
| B | 0 | 6530 | 1 |
| C | 0 | 6334 | 1 |
| D | 0 | 7445 | 1 |
| Mode M9 | |||
|---|---|---|---|
| Quadrant | BADHDUFLAG | Total packets | Discarded packets |
| A | 0 | 13 | 0 |
| B | 0 | 13 | 0 |
| C | 0 | 13 | 0 |
| D | 0 | 13 | 0 |
| Mode SS | |||
|---|---|---|---|
| Quadrant | BADHDUFLAG | Total packets | Discarded packets |
| A | 0 | 64 | 0 |
| B | 0 | 64 | 0 |
| C | 0 | 64 | 0 |
| D | 0 | 64 | 0 |
| Quadrant | Total seconds | Saturated seconds | Saturation percentage |
|---|---|---|---|
| A | 3068 | 21 | 0.684485% |
| B | 3068 | 34 | 1.108214% |
| C | 3068 | 13 | 0.423729% |
| D | 3068 | 26 | 0.847458% |
Noise dominated data is calculated using 1-second bins in cleaned event files. If a bin has >2000 counts, and if more than 50% of those come from <1% of pixels, then it is considered to be noise-dominated and hence unusable.
| Quadrant | # 1 sec bins | Bins with >0 counts | Bins with >2000 counts | High rate bins dominated by noise | Noise dominated (total time) | Noise dominated (detector-on time) | Marked lightcurve |
|---|---|---|---|---|---|---|---|
| A | 4413 | 3069 | 0 | 0 | 0.00% | 0.00% | 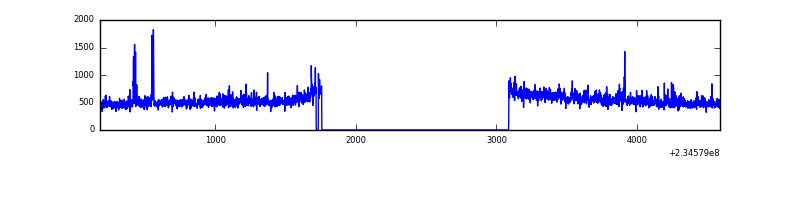 |
| B | 4413 | 3069 | 0 | 0 | 0.00% | 0.00% | 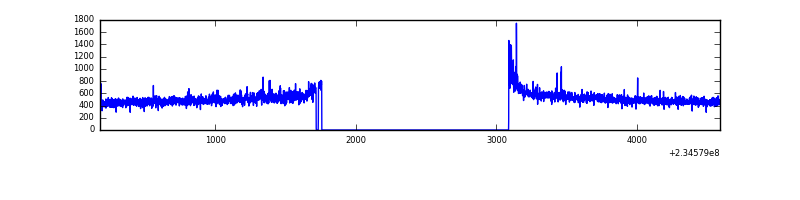 |
| C | 4413 | 3070 | 0 | 0 | 0.00% | 0.00% | 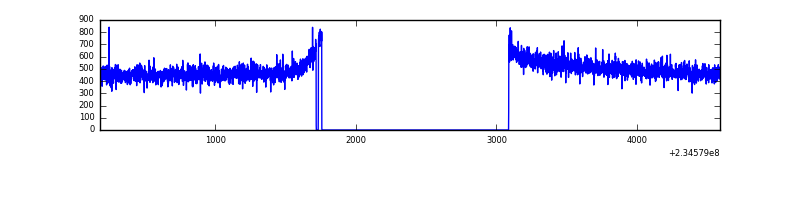 |
| D | 4413 | 3069 | 9 | 9 | 0.20% | 0.29% | 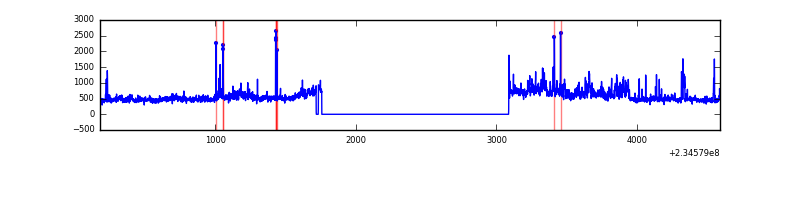 |
Top three noisy pixels from each quadrant. If the there are fewer than three noisy pixels in the level2.evt file, extra rows are filled as -1
| Pixel properties | Quadrant properties | ||||||
|---|---|---|---|---|---|---|---|
| Quadrant | DetID | PixID | Counts | Sigma | Mean | Median | Sigma |
| A | 8 | 5 | 90281 | 1141.48 | 387 | 379 | 78.8 |
| A | 1 | 162 | 37184 | 467.31 | 387 | 379 | 78.8 |
| A | 15 | 174 | 12812 | 157.86 | 387 | 379 | 78.8 |
| B | 0 | 214 | 22462 | 303.95 | 391 | 383 | 72.6 |
| B | 8 | 234 | 13742 | 183.9 | 391 | 383 | 72.6 |
| B | 0 | 229 | 9705 | 128.33 | 391 | 383 | 72.6 |
| C | 13 | 61 | 3016 | 29.72 | 382 | 384 | 88.6 |
| C | 14 | 67 | 1196 | 9.17 | 382 | 384 | 88.6 |
| C | 12 | 4 | 1112 | 8.22 | 382 | 384 | 88.6 |
| D | 1 | 52 | 301499 | 3015.9 | 375 | 366 | 99.8 |
| D | 13 | 104 | 23717 | 233.86 | 375 | 366 | 99.8 |
| D | 7 | 71 | 20671 | 203.36 | 375 | 366 | 99.8 |
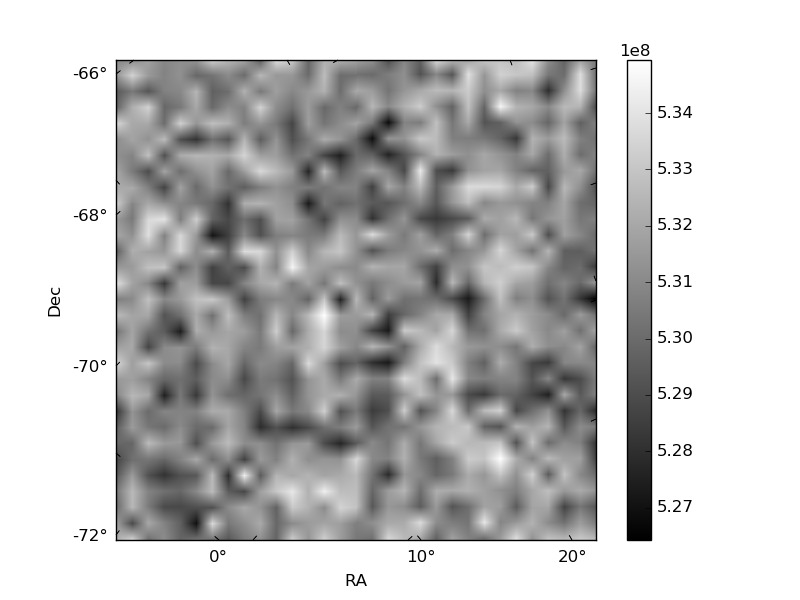
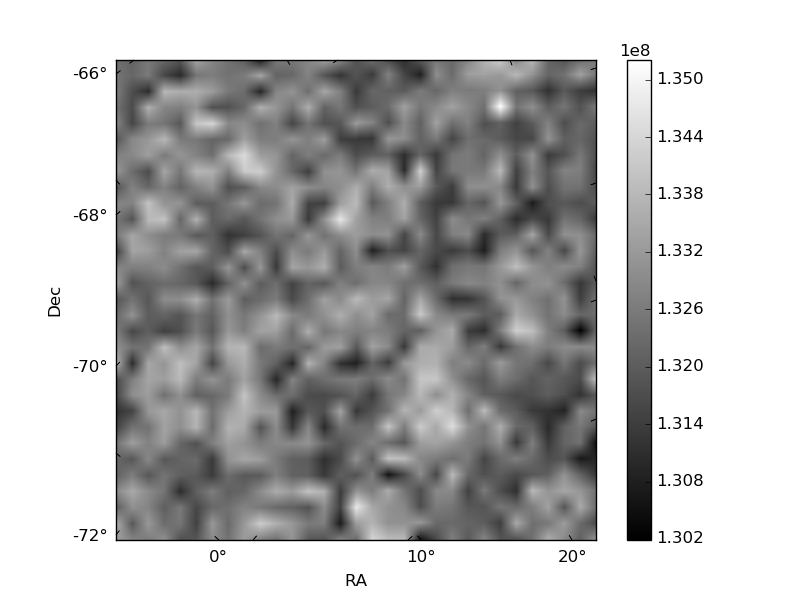
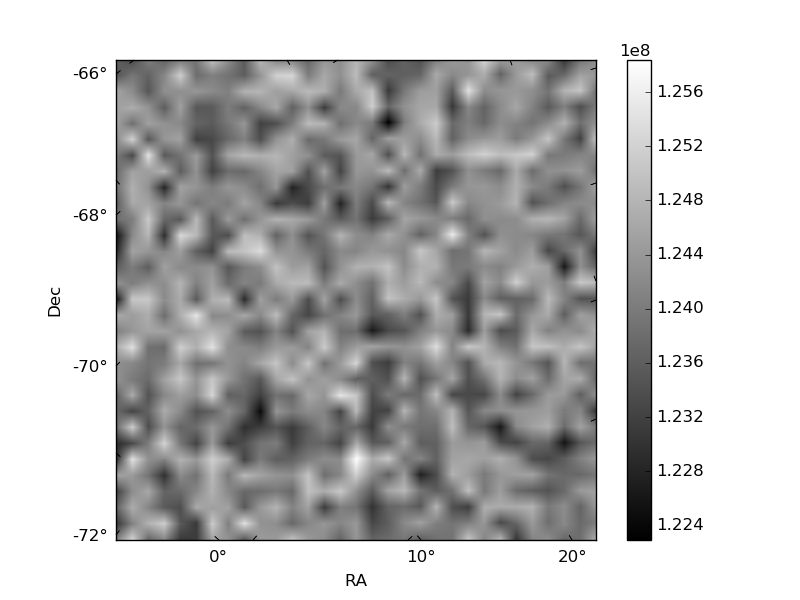
Histogram calculated using DETX and DETY for each event in the final _common_clean file
| Quadrant A | 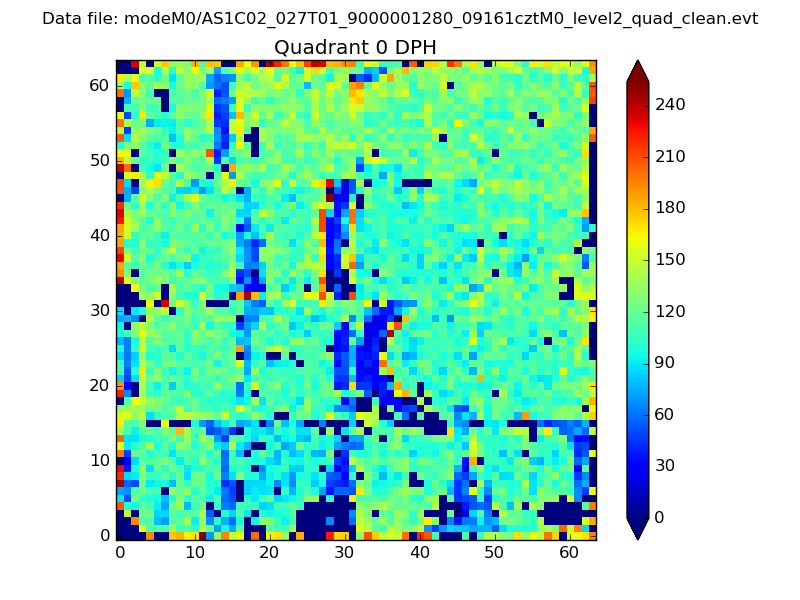 |
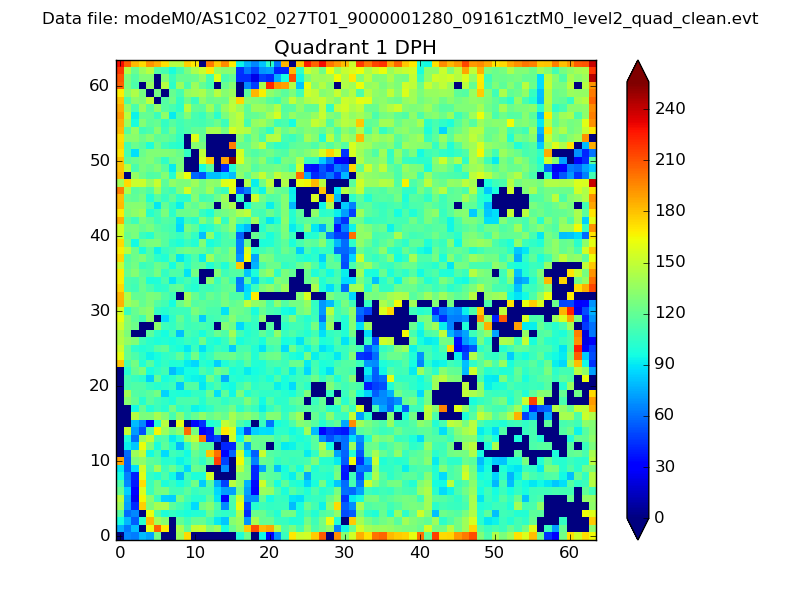 |
Quadrant B |
|---|---|---|---|
| Quadrant D | 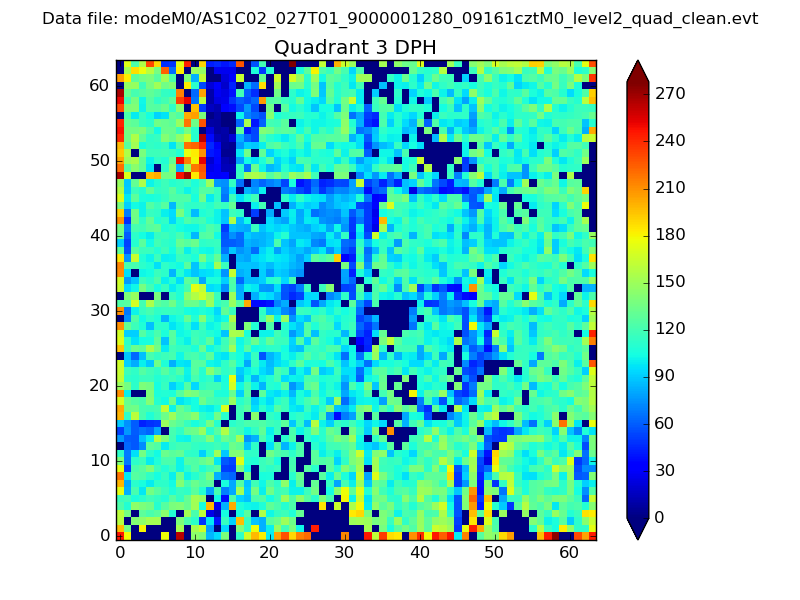 |
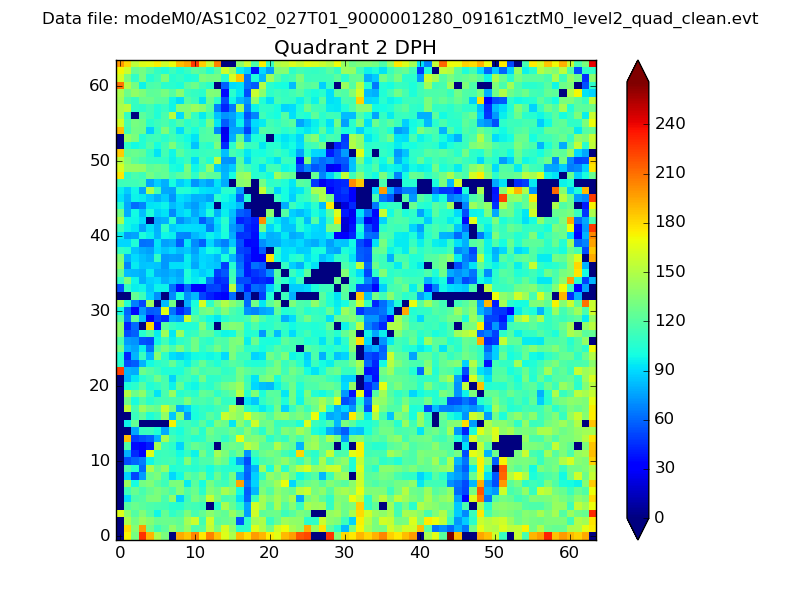 |
Quadrant C |
| Plot type | Count rate plots | Images |
|---|---|---|
| Comparison with Poisson distribution Blue bars denote a histogram of data divided into 1 sec bins. Red curve is a Poisson curve with rate = median count rate of data. |
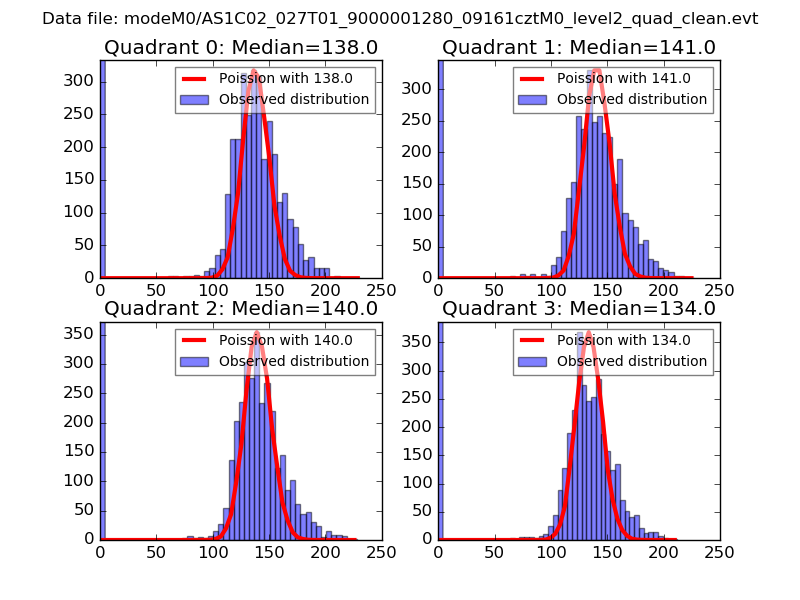 |
 |
| Quadrant-wise count rates Data is divided into 100 sec bins |
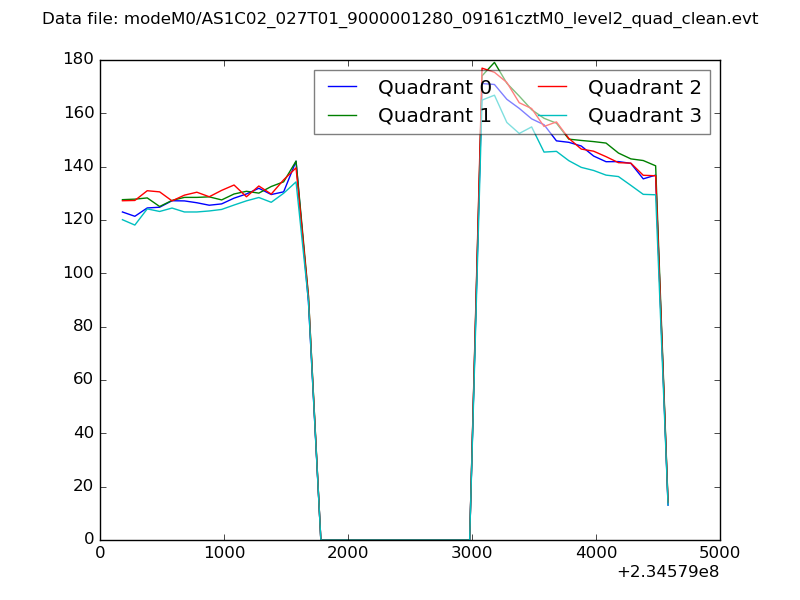 |
|
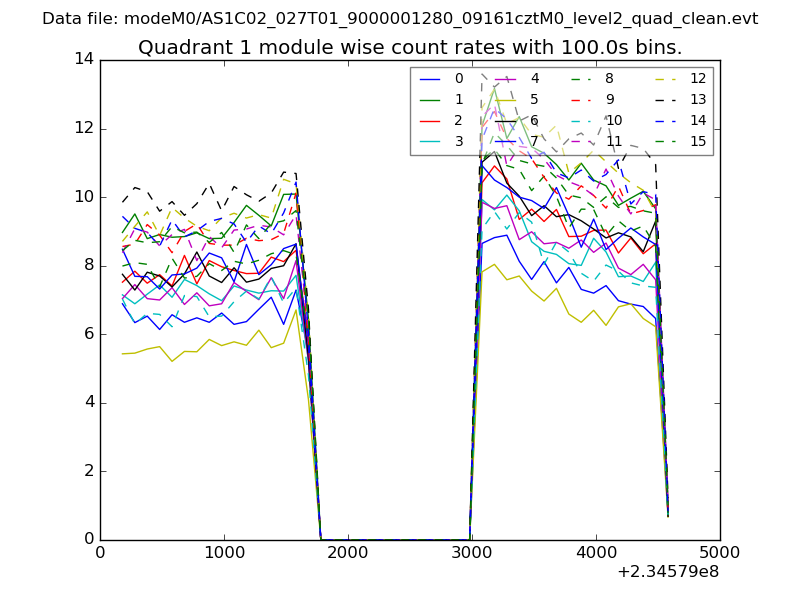
| Module-wise count rates for Quadrant A Data is divided into 100 sec bins |
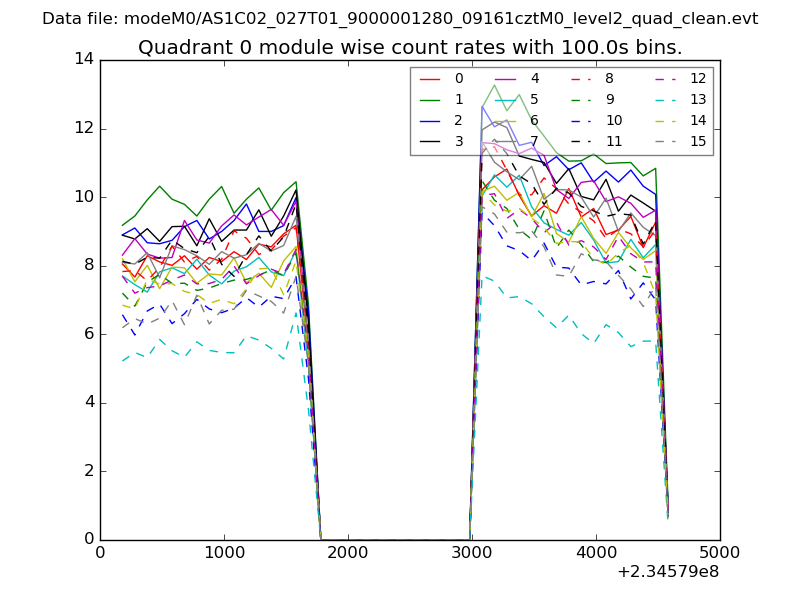 |
 |
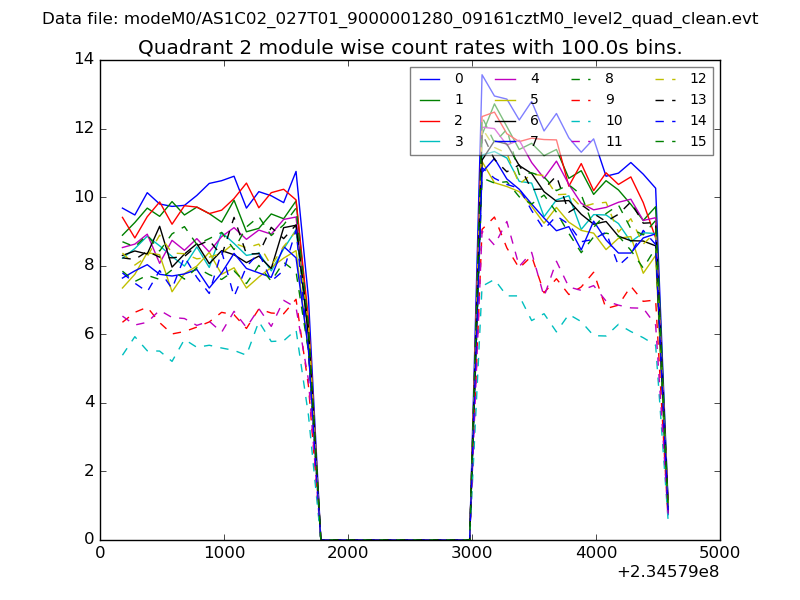
| Module-wise count rates for Quadrant B Data is divided into 100 sec bins |
 |
 |
| Module-wise count rates for Quadrant C Data is divided into 100 sec bins |
 |
 |
| Module-wise count rates for Quadrant D Data is divided into 100 sec bins |
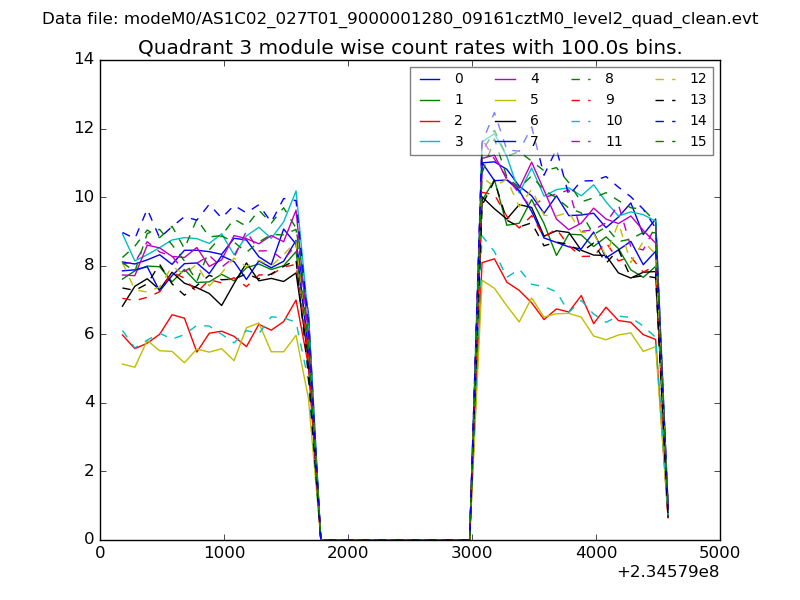 |
 |
| Parameter | Plot |
|---|---|
| CZT HV Monitor | 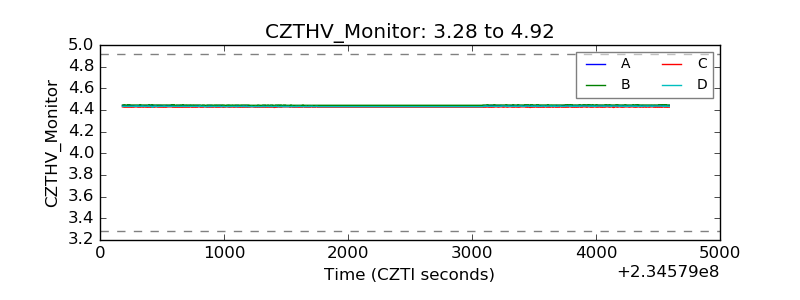 |
| D_VDD | 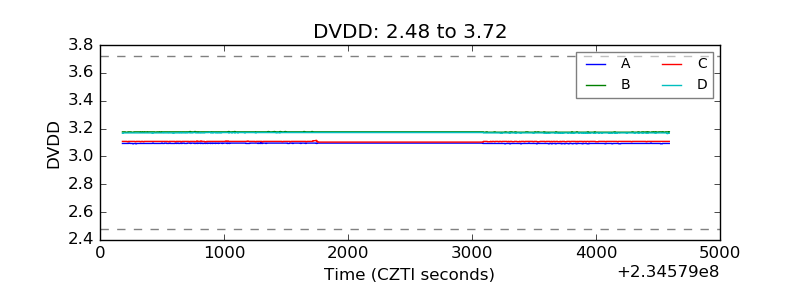 |
| Temperature 1 | 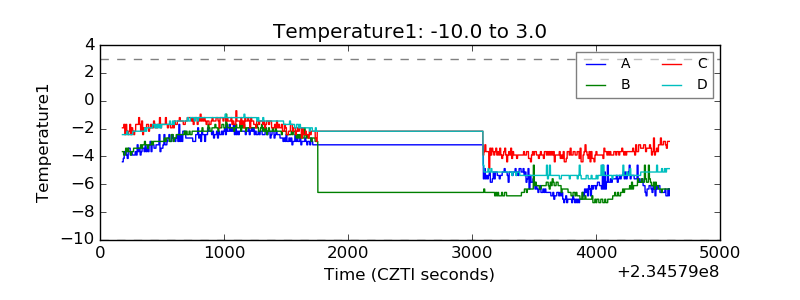 |
| Veto HV Monitor | 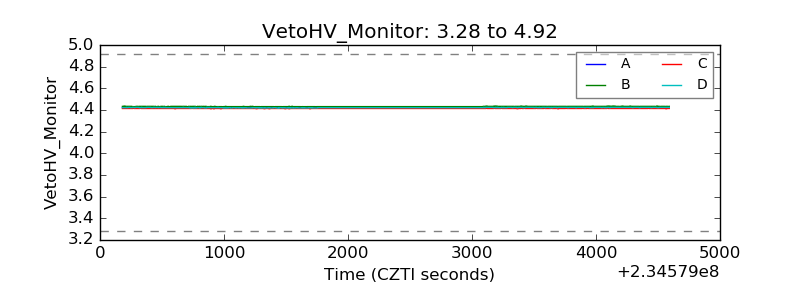 |
| Veto LLD | 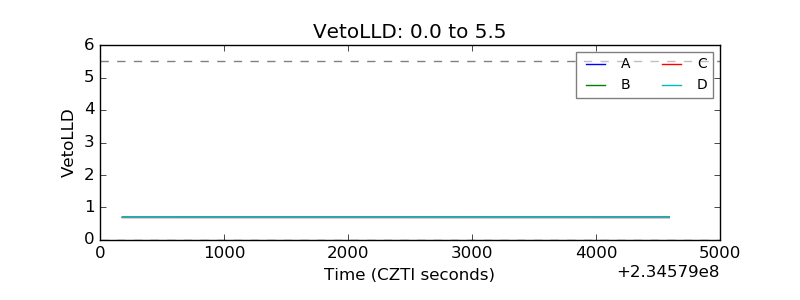 |
| Alpha Counter | 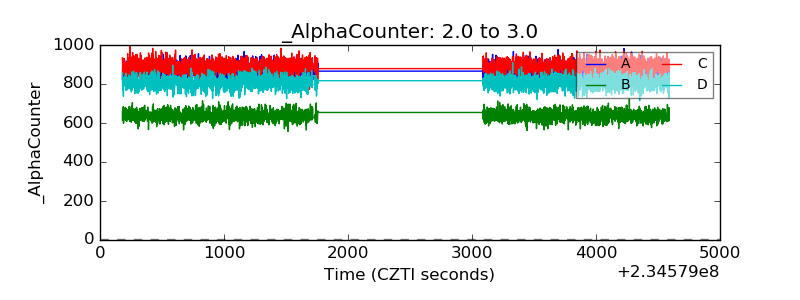 |
| _CPM_Rate | 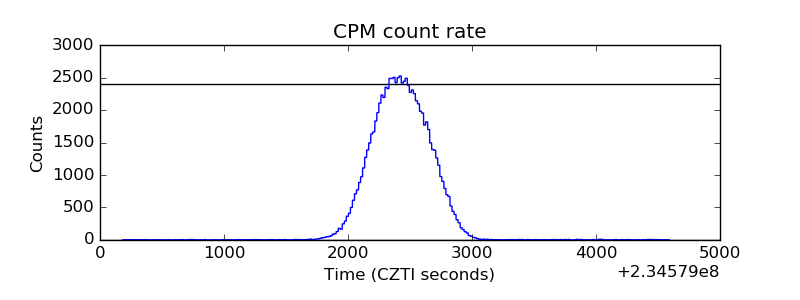 |
| CZT Counter | 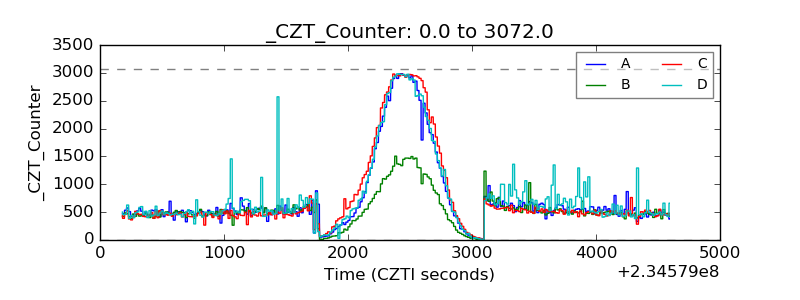 |
| +2.5 Volts monitor |  |
| +5 Volts monitor |  |
| _ROLL_ROT | 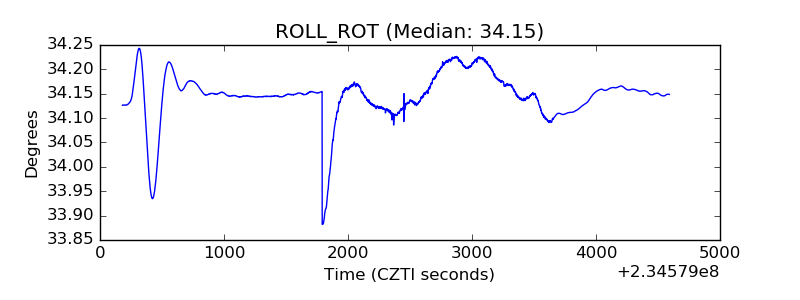 |
| _Roll_DEC | 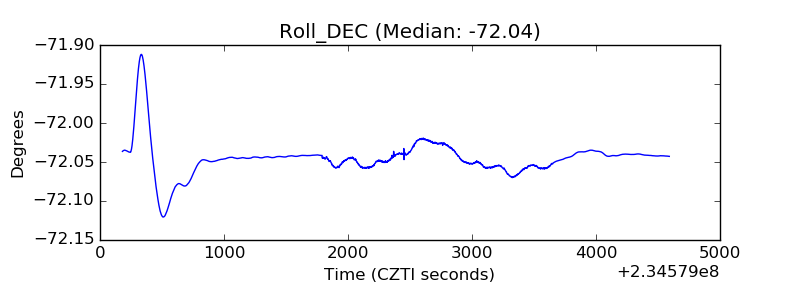 |
| _Roll_RA | 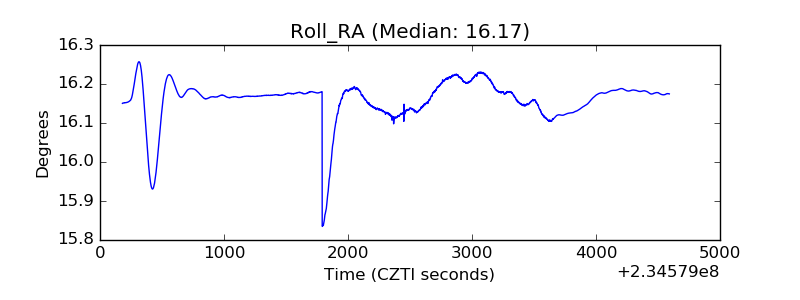 |
| Veto Counter | 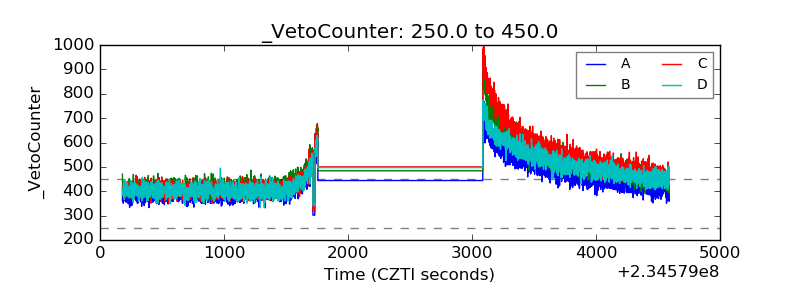 |