| Param | Original file | Final file |
|---|---|---|
| Filename | modeM0/AS1C02_027T01_9000001280_09163cztM0_level2.evt | modeM0/AS1C02_027T01_9000001280_09163cztM0_level2_quad_clean.evt |
| Size (bytes) | 437,921,280 | 126,849,600 |
| Size | 417.6 MB | 121.0 MB |
| Events in quadrant A | 3,577,034 | 842,663 |
| Events in quadrant B | 3,126,016 | 864,665 |
| Events in quadrant C | 2,970,651 | 862,807 |
| Events in quadrant D | 3,157,444 | 829,200 |
| Mode M0 | |||
|---|---|---|---|
| Quadrant | BADHDUFLAG | Total packets | Discarded packets |
| A | 0 | 14574 | 3 |
| B | 0 | 13411 | 2 |
| C | 0 | 13012 | 2 |
| D | 0 | 13662 | 2 |
| Mode M9 | |||
|---|---|---|---|
| Quadrant | BADHDUFLAG | Total packets | Discarded packets |
| A | 0 | 17 | 0 |
| B | 0 | 17 | 0 |
| C | 0 | 17 | 0 |
| D | 0 | 18 | 0 |
| Mode SS | |||
|---|---|---|---|
| Quadrant | BADHDUFLAG | Total packets | Discarded packets |
| A | 0 | 130 | 0 |
| B | 0 | 130 | 0 |
| C | 0 | 130 | 0 |
| D | 0 | 130 | 0 |
| Quadrant | Total seconds | Saturated seconds | Saturation percentage |
|---|---|---|---|
| A | 6342 | 52 | 0.819931% |
| B | 6342 | 38 | 0.599180% |
| C | 6342 | 30 | 0.473037% |
| D | 6342 | 56 | 0.883002% |
Noise dominated data is calculated using 1-second bins in cleaned event files. If a bin has >2000 counts, and if more than 50% of those come from <1% of pixels, then it is considered to be noise-dominated and hence unusable.
| Quadrant | # 1 sec bins | Bins with >0 counts | Bins with >2000 counts | High rate bins dominated by noise | Noise dominated (total time) | Noise dominated (detector-on time) | Marked lightcurve |
|---|---|---|---|---|---|---|---|
| A | 7607 | 6343 | 22 | 22 | 0.29% | 0.35% | 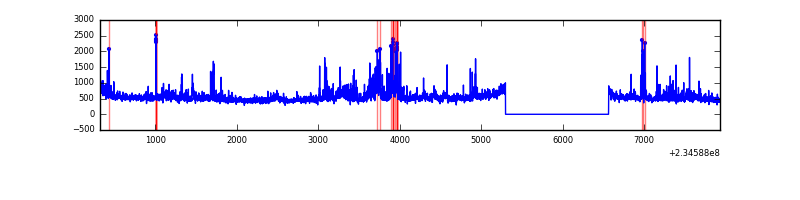 |
| B | 7607 | 6343 | 6 | 6 | 0.08% | 0.09% | 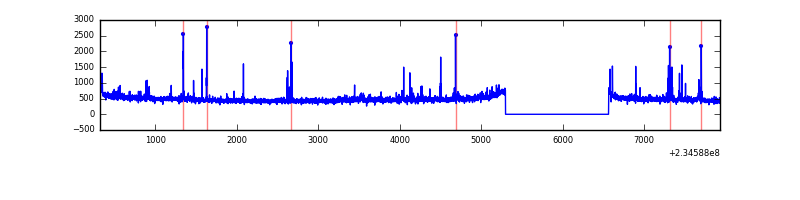 |
| C | 7607 | 6343 | 0 | 0 | 0.00% | 0.00% | 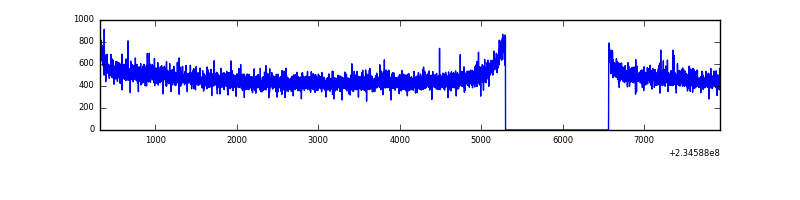 |
| D | 7607 | 6342 | 21 | 21 | 0.28% | 0.33% | 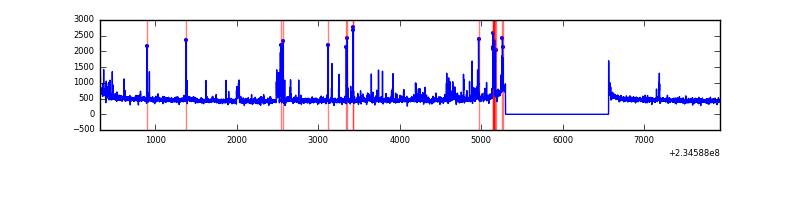 |
Top three noisy pixels from each quadrant. If the there are fewer than three noisy pixels in the level2.evt file, extra rows are filled as -1
| Pixel properties | Quadrant properties | ||||||
|---|---|---|---|---|---|---|---|
| Quadrant | DetID | PixID | Counts | Sigma | Mean | Median | Sigma |
| A | 8 | 5 | 488884 | 3207.49 | 760 | 744 | 152.2 |
| A | 1 | 162 | 67929 | 441.46 | 760 | 744 | 152.2 |
| A | 13 | 251 | 49149 | 318.06 | 760 | 744 | 152.2 |
| B | 8 | 234 | 50530 | 354.17 | 766 | 748 | 140.6 |
| B | 0 | 229 | 31662 | 219.94 | 766 | 748 | 140.6 |
| B | 4 | 80 | 22049 | 151.55 | 766 | 748 | 140.6 |
| C | 13 | 61 | 5684 | 28.52 | 760 | 765 | 172.5 |
| C | 12 | 4 | 3256 | 14.44 | 760 | 765 | 172.5 |
| C | 14 | 67 | 2714 | 11.3 | 760 | 765 | 172.5 |
| D | 1 | 52 | 177094 | 956.26 | 750 | 731 | 184.4 |
| D | 12 | 233 | 43676 | 232.85 | 750 | 731 | 184.4 |
| D | 2 | 14 | 36812 | 195.63 | 750 | 731 | 184.4 |
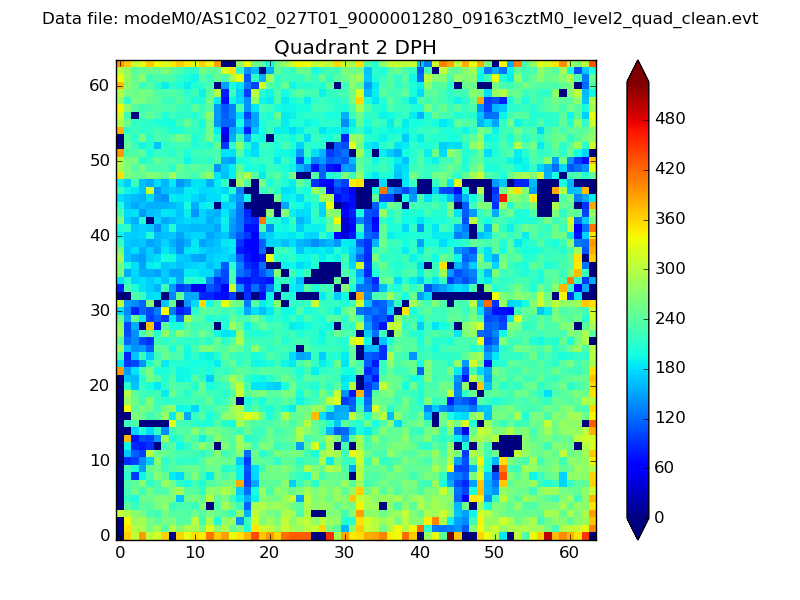
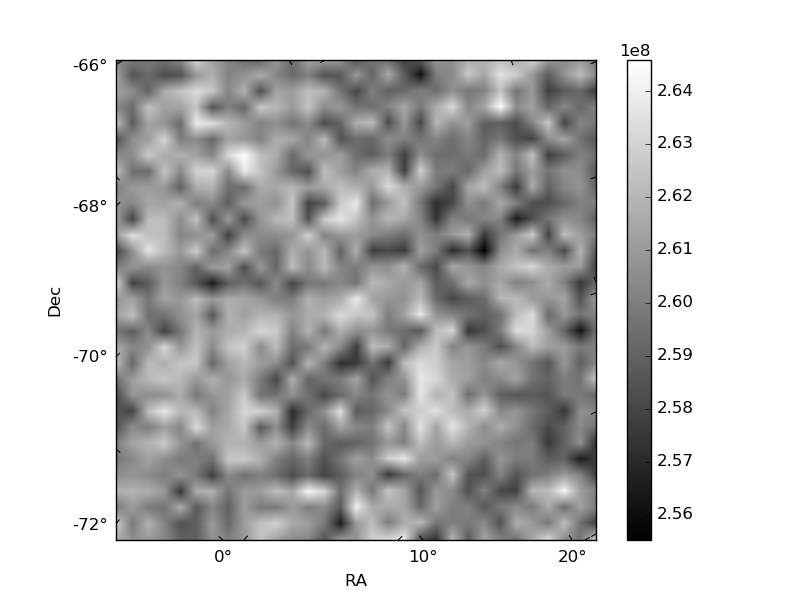
Histogram calculated using DETX and DETY for each event in the final _common_clean file
| Quadrant A | 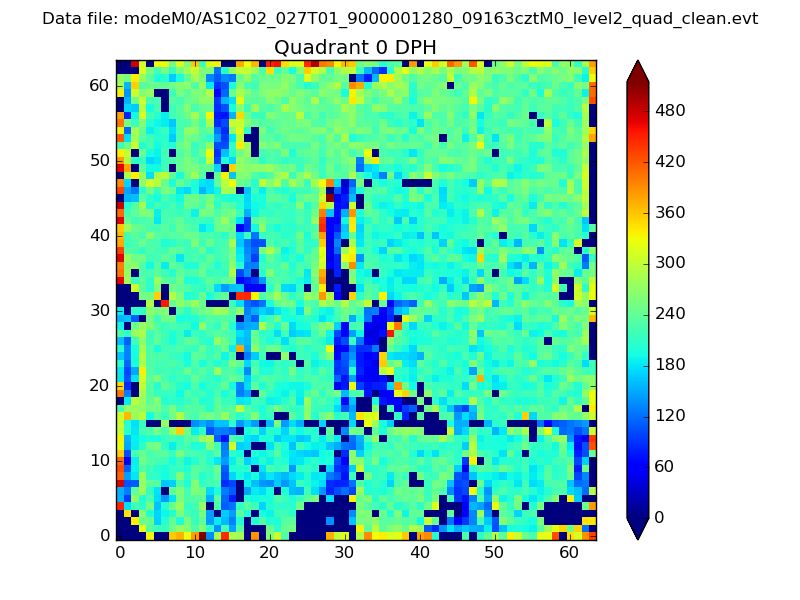 |
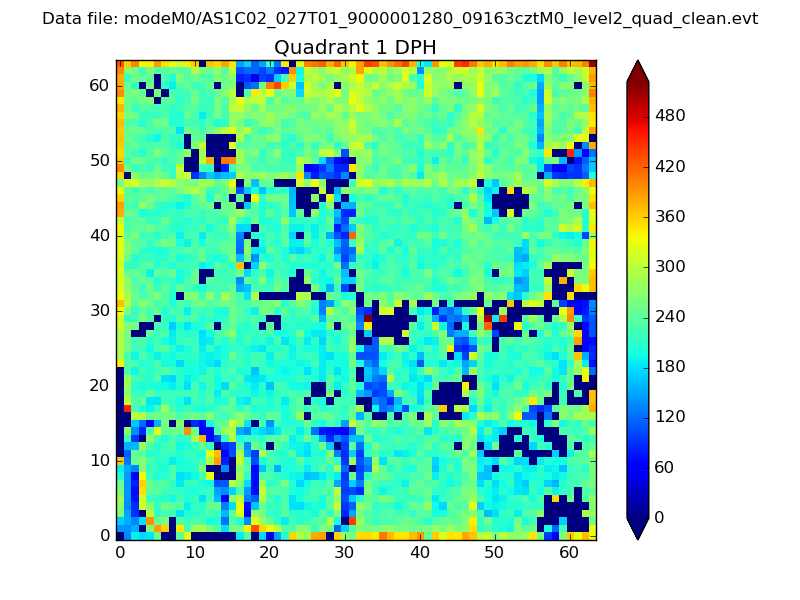 |
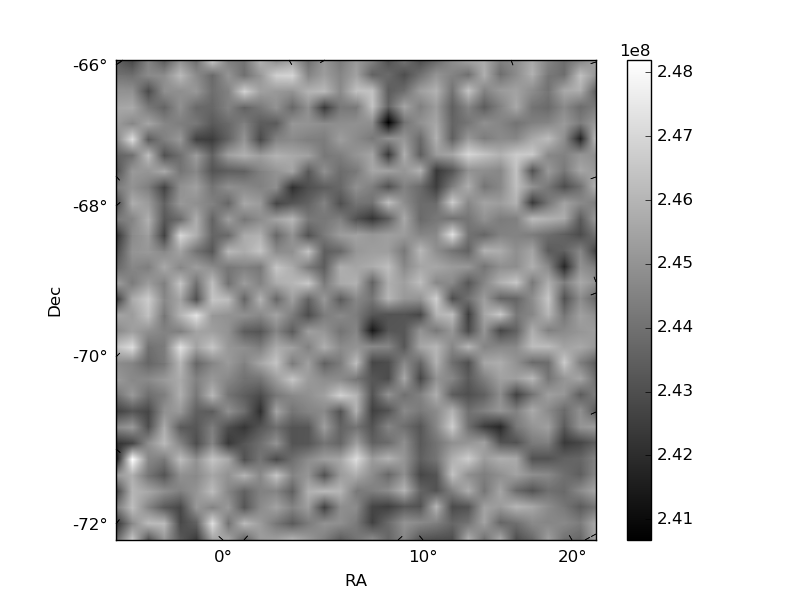
Quadrant B |
|---|---|---|---|
| Quadrant D | 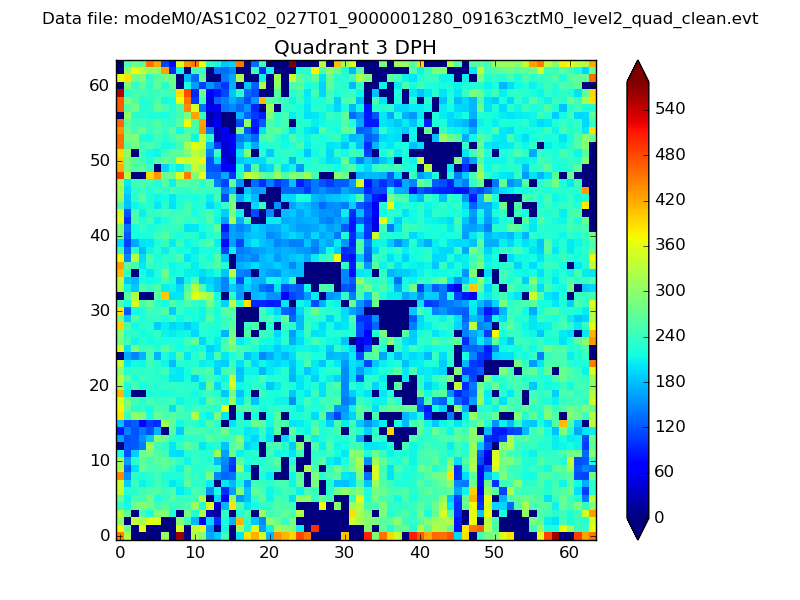 |
 |
Quadrant C |
| Plot type | Count rate plots | Images |
|---|---|---|
| Comparison with Poisson distribution Blue bars denote a histogram of data divided into 1 sec bins. Red curve is a Poisson curve with rate = median count rate of data. |
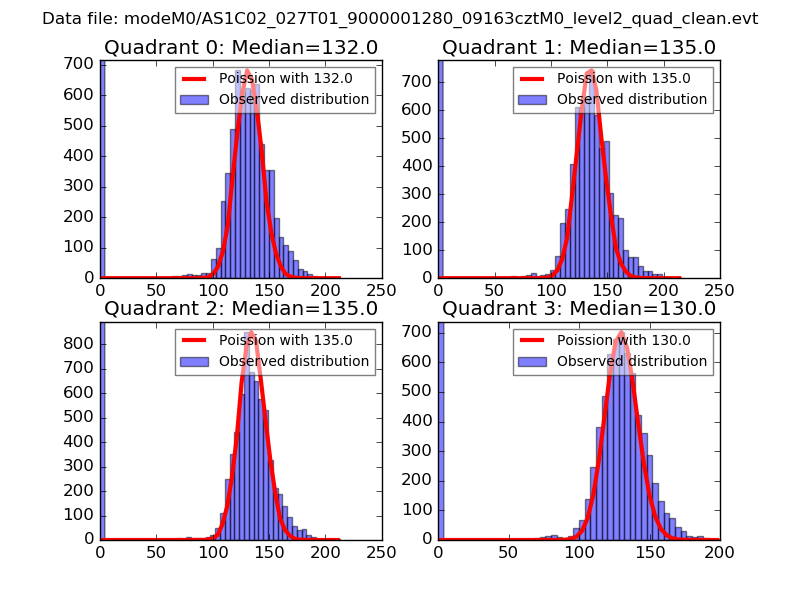 |
 |
| Quadrant-wise count rates Data is divided into 100 sec bins |
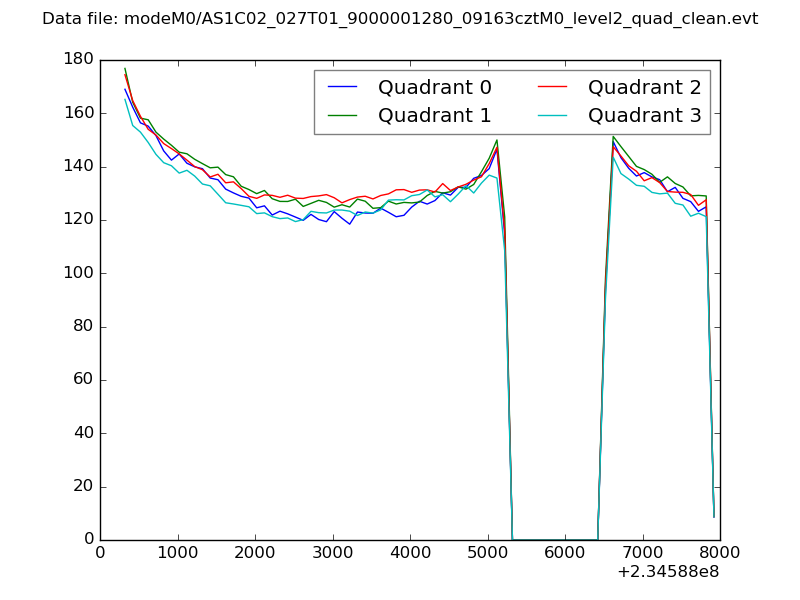 |
|
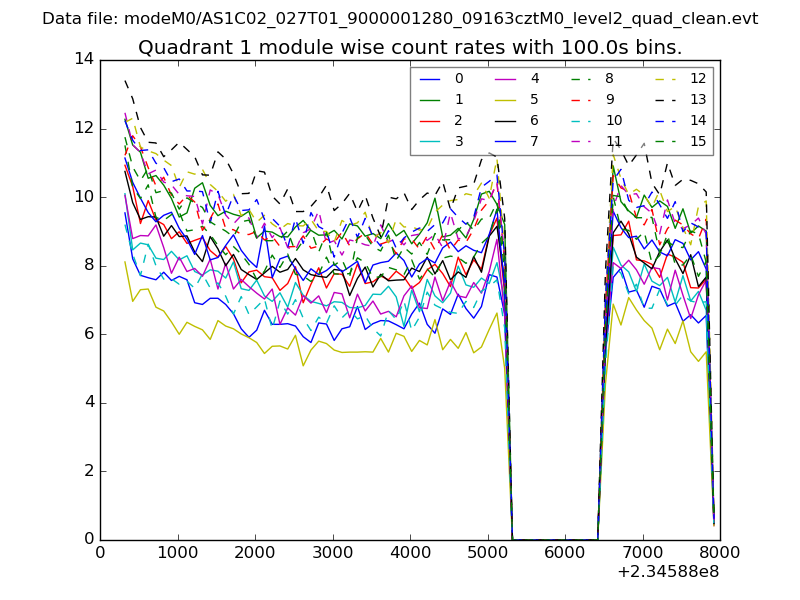
| Module-wise count rates for Quadrant A Data is divided into 100 sec bins |
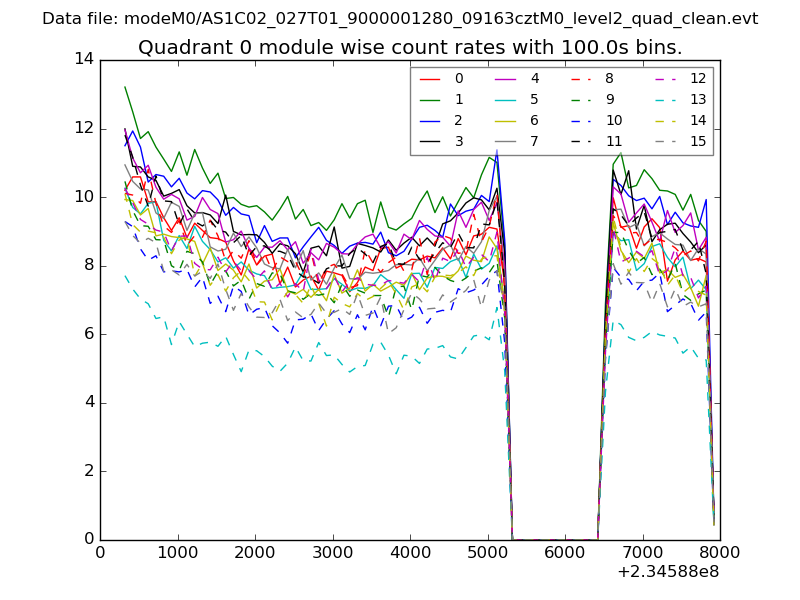 |
 |
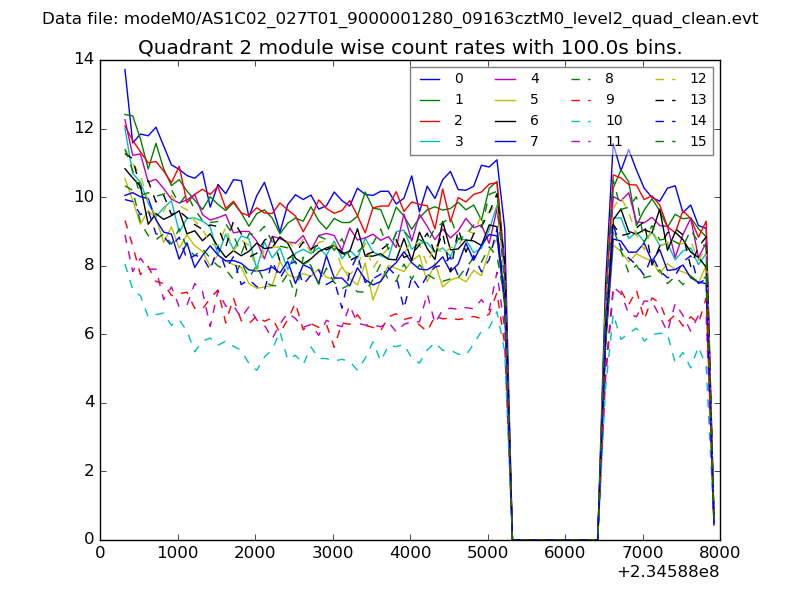
| Module-wise count rates for Quadrant B Data is divided into 100 sec bins |
 |
 |
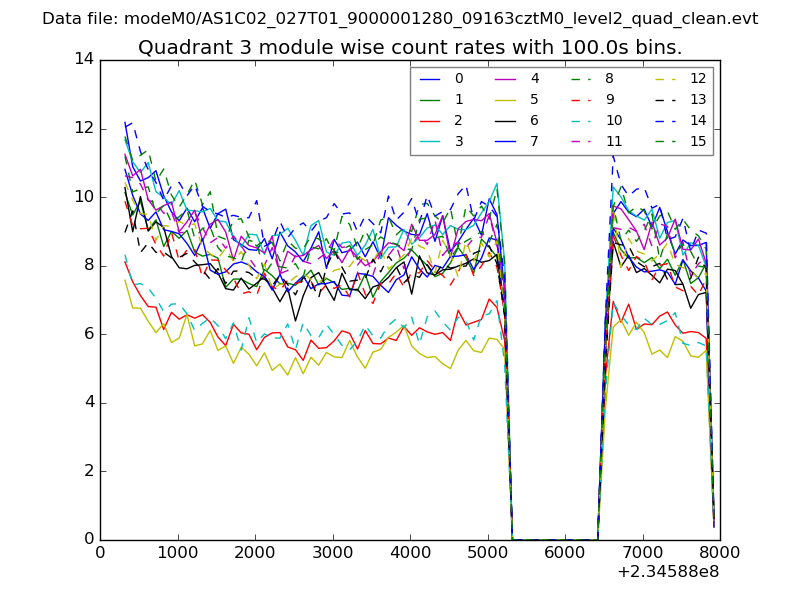
| Module-wise count rates for Quadrant C Data is divided into 100 sec bins |
 |
 |
| Module-wise count rates for Quadrant D Data is divided into 100 sec bins |
 |
 |
| Parameter | Plot |
|---|---|
| CZT HV Monitor | 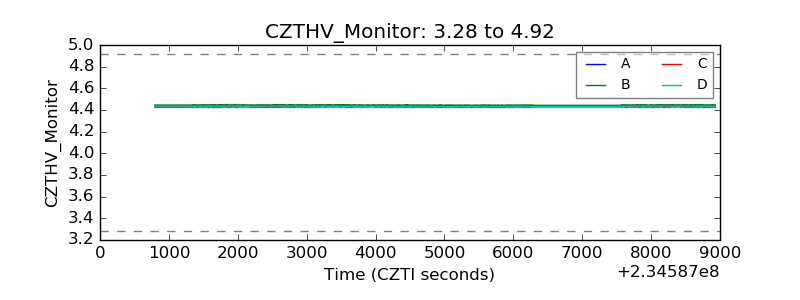 |
| D_VDD |  |
| Temperature 1 | 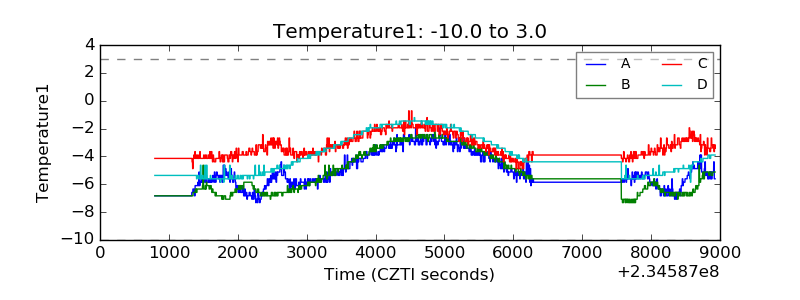 |
| Veto HV Monitor | 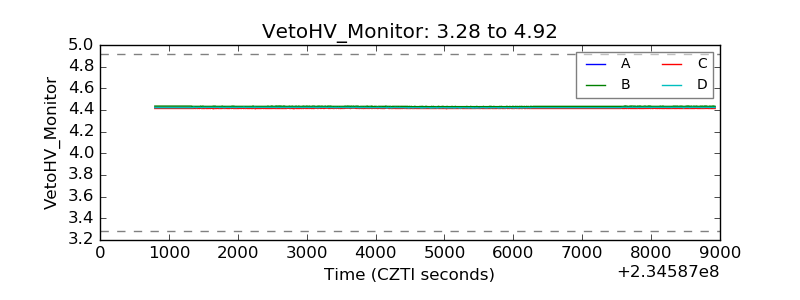 |
| Veto LLD | 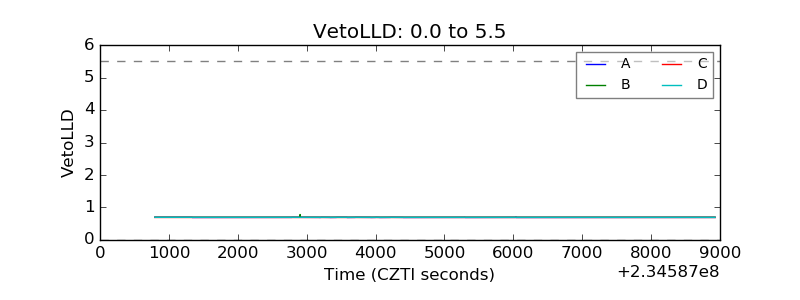 |
| Alpha Counter | 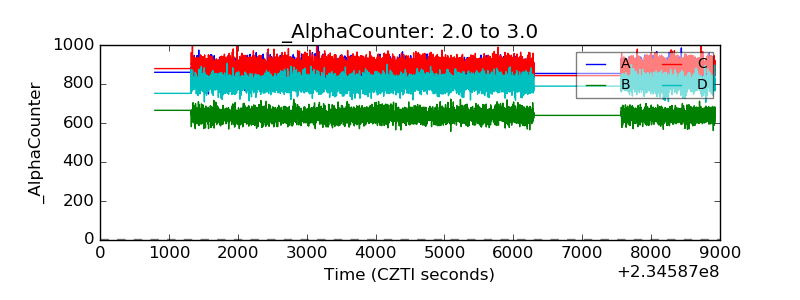 |
| _CPM_Rate | 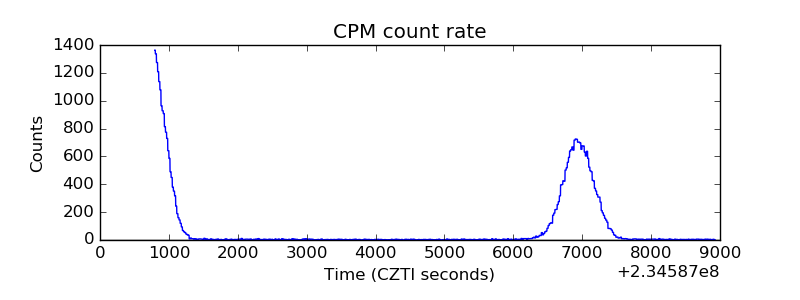 |
| CZT Counter | 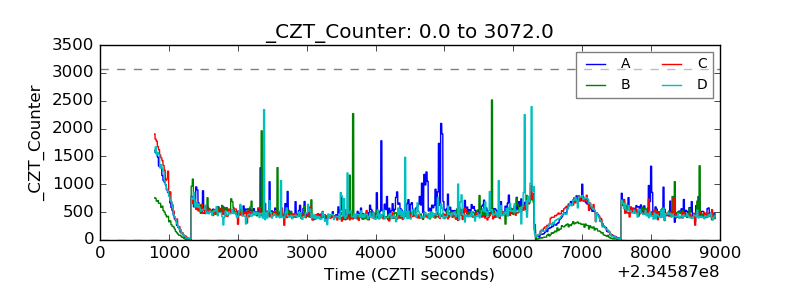 |
| +2.5 Volts monitor |  |
| +5 Volts monitor |  |
| _ROLL_ROT | 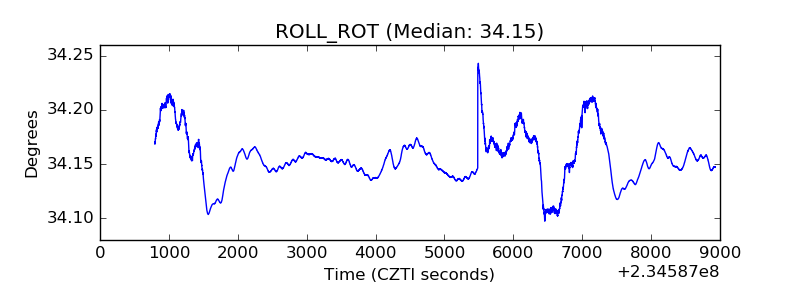 |
| _Roll_DEC | 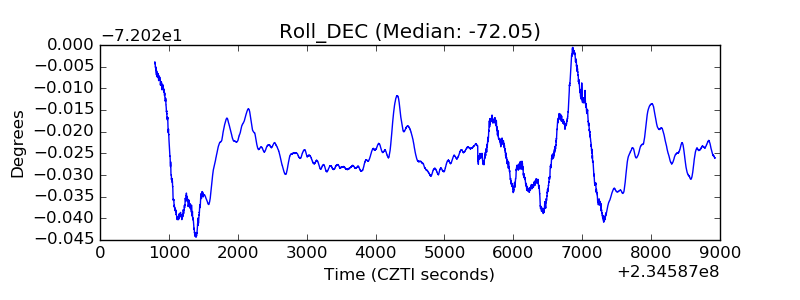 |
| _Roll_RA |  |
| Veto Counter | 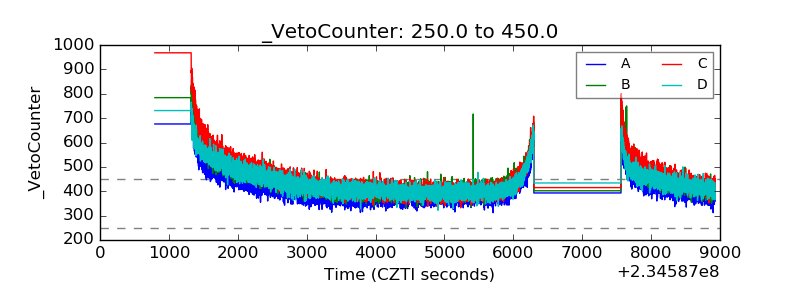 |