| Param | Original file | Final file |
|---|---|---|
| Filename | modeM0/AS1C02_027T01_9000001280_09166cztM0_level2.evt | modeM0/AS1C02_027T01_9000001280_09166cztM0_level2_quad_clean.evt |
| Size (bytes) | 520,427,520 | 130,095,360 |
| Size | 496.3 MB | 124.1 MB |
| Events in quadrant A | 3,766,220 | 858,167 |
| Events in quadrant B | 3,917,423 | 867,459 |
| Events in quadrant C | 3,239,416 | 873,460 |
| Events in quadrant D | 4,343,765 | 834,408 |
| Mode M0 | |||
|---|---|---|---|
| Quadrant | BADHDUFLAG | Total packets | Discarded packets |
| A | 0 | 15764 | 3 |
| B | 0 | 16439 | 2 |
| C | 0 | 14980 | 2 |
| D | 0 | 17965 | 2 |
| Mode M9 | |||
|---|---|---|---|
| Quadrant | BADHDUFLAG | Total packets | Discarded packets |
| A | 0 | 1 | 0 |
| B | 0 | 1 | 0 |
| C | 0 | 1 | 0 |
| D | 0 | 1 | 0 |
| Mode SS | |||
|---|---|---|---|
| Quadrant | BADHDUFLAG | Total packets | Discarded packets |
| A | 0 | 146 | 0 |
| B | 0 | 146 | 0 |
| C | 0 | 146 | 0 |
| D | 0 | 146 | 0 |
| Quadrant | Total seconds | Saturated seconds | Saturation percentage |
|---|---|---|---|
| A | 7280 | 271 | 3.722527% |
| B | 7280 | 326 | 4.478022% |
| C | 7280 | 202 | 2.774725% |
| D | 7280 | 359 | 4.931319% |
Noise dominated data is calculated using 1-second bins in cleaned event files. If a bin has >2000 counts, and if more than 50% of those come from <1% of pixels, then it is considered to be noise-dominated and hence unusable.
| Quadrant | # 1 sec bins | Bins with >0 counts | Bins with >2000 counts | High rate bins dominated by noise | Noise dominated (total time) | Noise dominated (detector-on time) | Marked lightcurve |
|---|---|---|---|---|---|---|---|
| A | 7335 | 7280 | 6 | 6 | 0.08% | 0.08% | 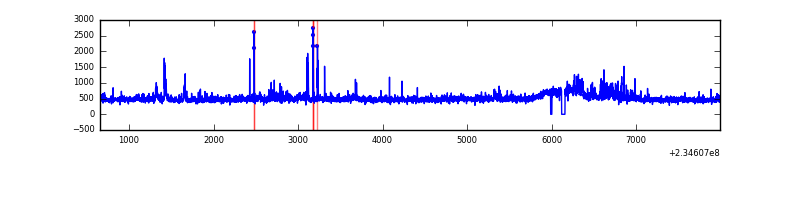 |
| B | 7335 | 7280 | 28 | 28 | 0.38% | 0.38% | 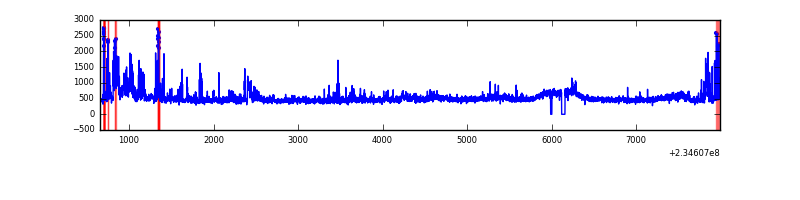 |
| C | 7335 | 7280 | 0 | 0 | 0.00% | 0.00% | 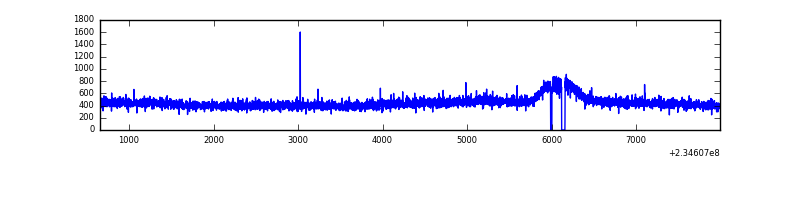 |
| D | 7335 | 7280 | 155 | 155 | 2.11% | 2.13% | 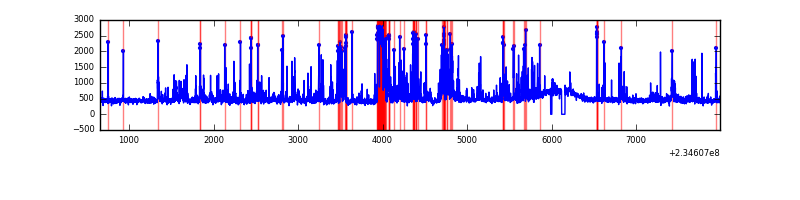 |
Top three noisy pixels from each quadrant. If the there are fewer than three noisy pixels in the level2.evt file, extra rows are filled as -1
| Pixel properties | Quadrant properties | ||||||
|---|---|---|---|---|---|---|---|
| Quadrant | DetID | PixID | Counts | Sigma | Mean | Median | Sigma |
| A | 8 | 5 | 376828 | 2199.35 | 836 | 815 | 171.0 |
| A | 1 | 162 | 59475 | 343.11 | 836 | 815 | 171.0 |
| A | 5 | 16 | 50420 | 290.15 | 836 | 815 | 171.0 |
| B | 8 | 234 | 408079 | 2567.24 | 838 | 816 | 158.6 |
| B | 10 | 16 | 126582 | 792.79 | 838 | 816 | 158.6 |
| B | 0 | 219 | 75397 | 470.13 | 838 | 816 | 158.6 |
| C | 8 | 128 | 12198 | 60.02 | 823 | 823 | 189.5 |
| C | 8 | 112 | 6418 | 29.52 | 823 | 823 | 189.5 |
| C | 13 | 61 | 6204 | 28.39 | 823 | 823 | 189.5 |
| D | 12 | 233 | 647533 | 3087.6 | 814 | 791 | 209.5 |
| D | 13 | 104 | 204329 | 971.71 | 814 | 791 | 209.5 |
| D | 13 | 169 | 152995 | 726.63 | 814 | 791 | 209.5 |
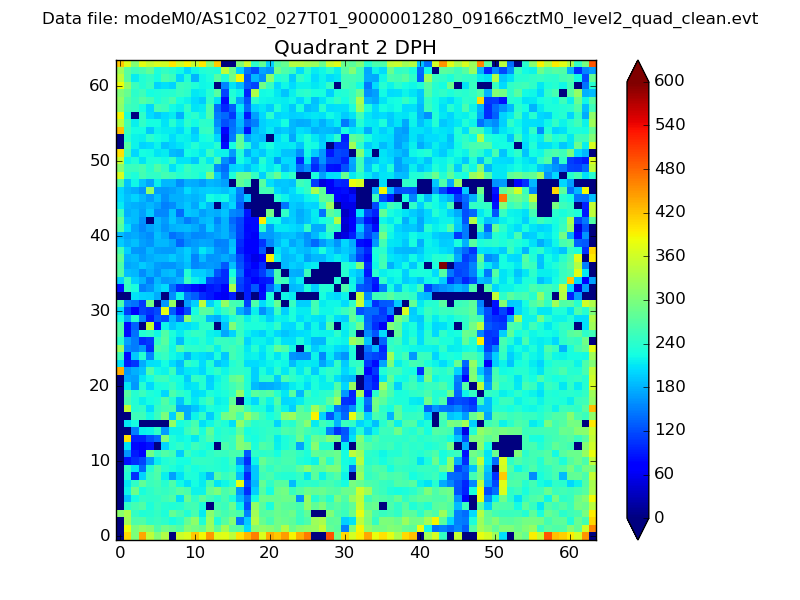
Histogram calculated using DETX and DETY for each event in the final _common_clean file
| Quadrant A | 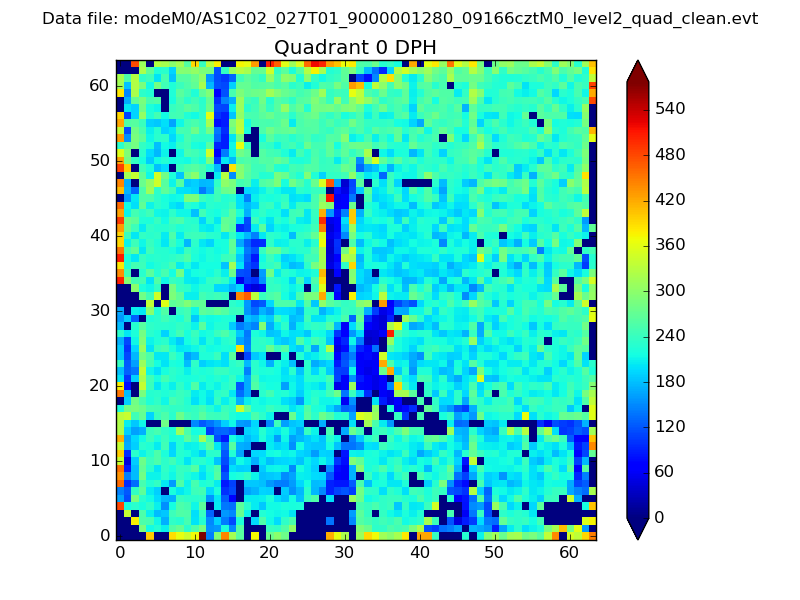 |
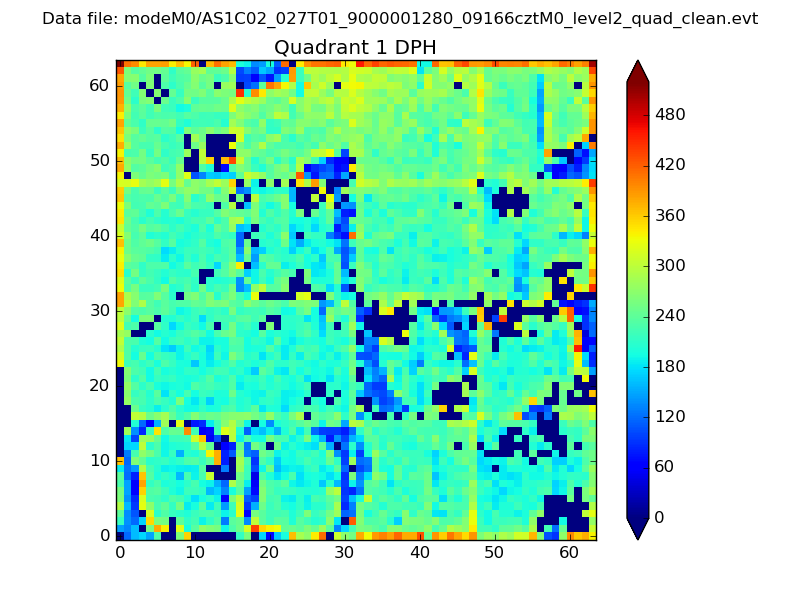 |
Quadrant B |
|---|---|---|---|
| Quadrant D | 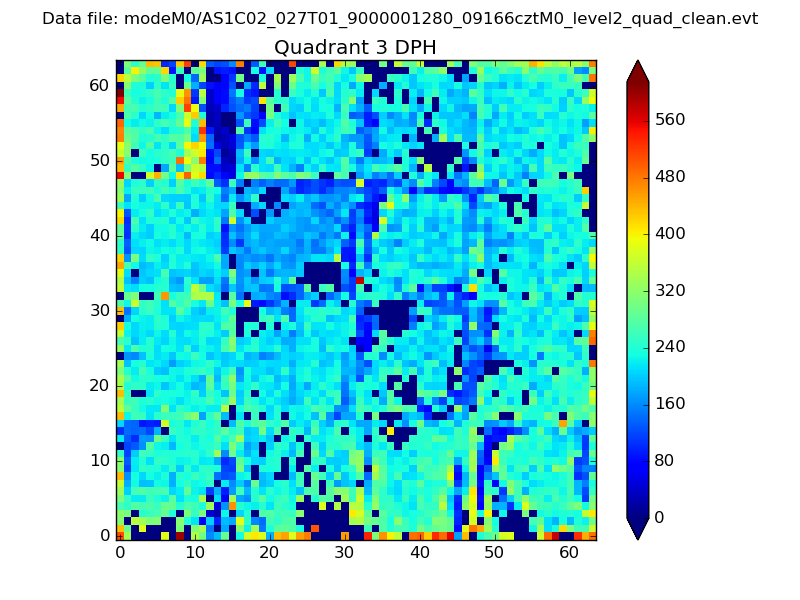 |
 |
Quadrant C |
| Plot type | Count rate plots | Images |
|---|---|---|
| Comparison with Poisson distribution Blue bars denote a histogram of data divided into 1 sec bins. Red curve is a Poisson curve with rate = median count rate of data. |
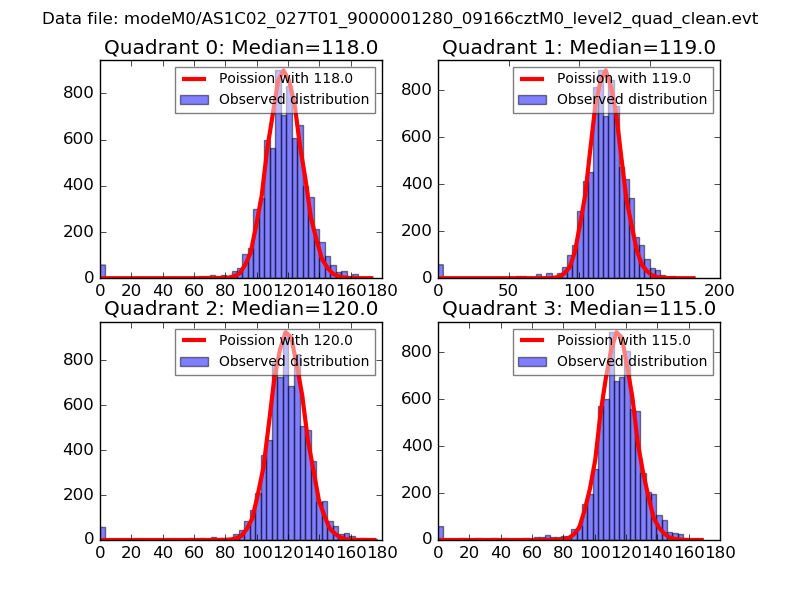 |
 |
| Quadrant-wise count rates Data is divided into 100 sec bins |
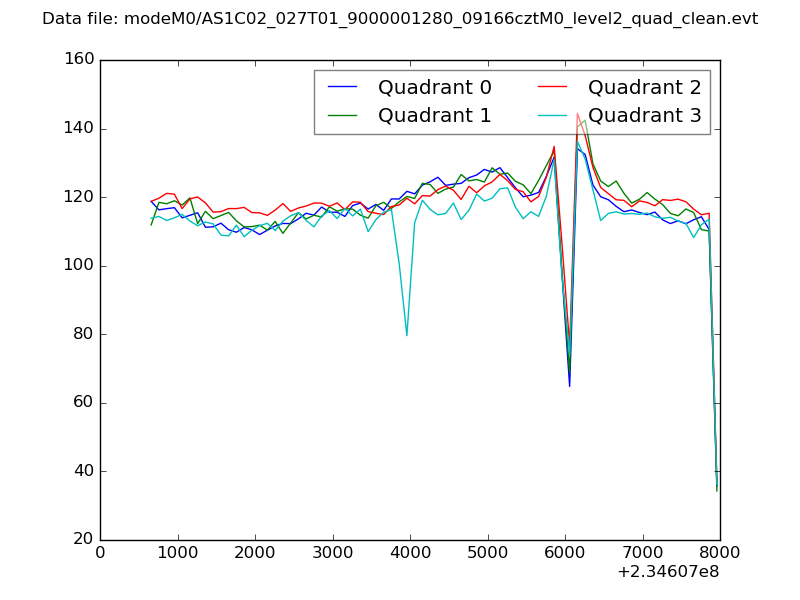 |
|
| Module-wise count rates for Quadrant A Data is divided into 100 sec bins |
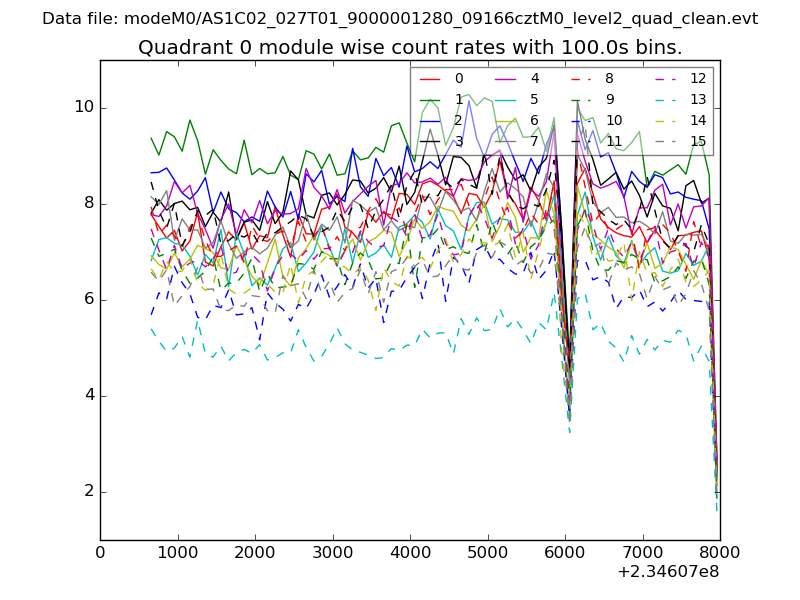 |
 |
| Module-wise count rates for Quadrant B Data is divided into 100 sec bins |
 |
 |
| Module-wise count rates for Quadrant C Data is divided into 100 sec bins |
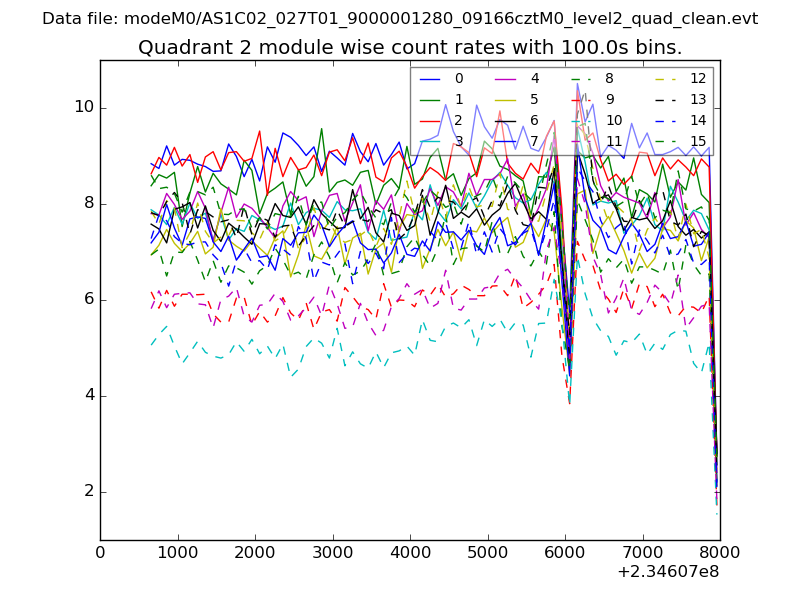 |
 |
| Module-wise count rates for Quadrant D Data is divided into 100 sec bins |
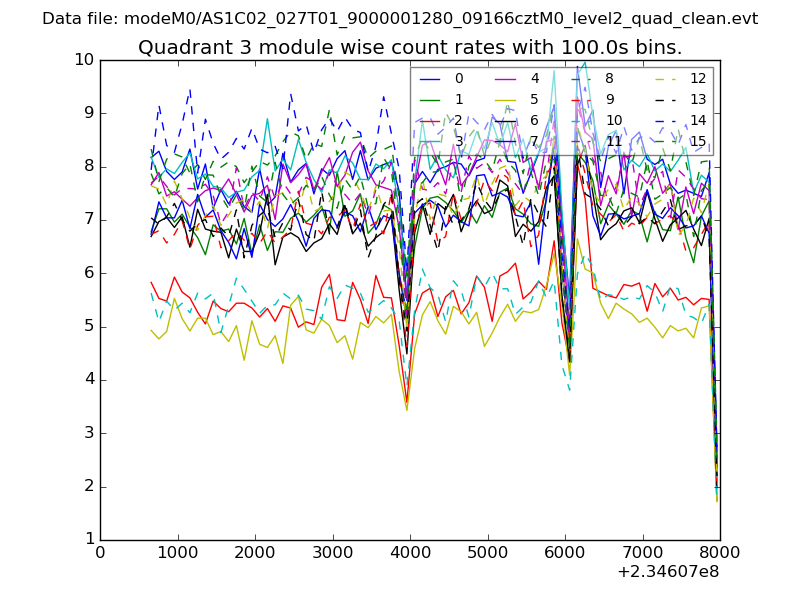 |
 |
| Parameter | Plot |
|---|---|
| CZT HV Monitor | 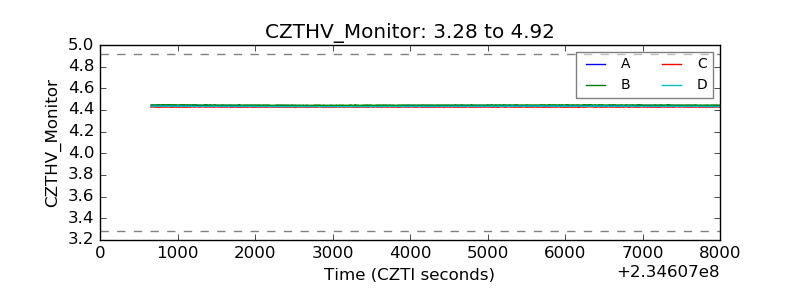 |
| D_VDD | 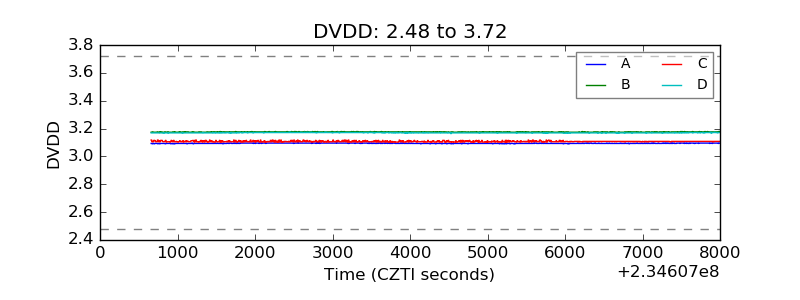 |
| Temperature 1 | 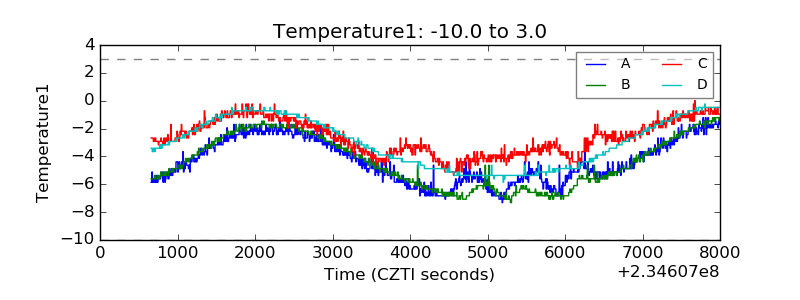 |
| Veto HV Monitor | 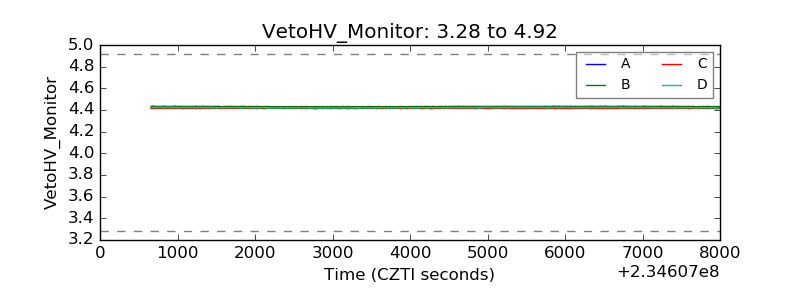 |
| Veto LLD | 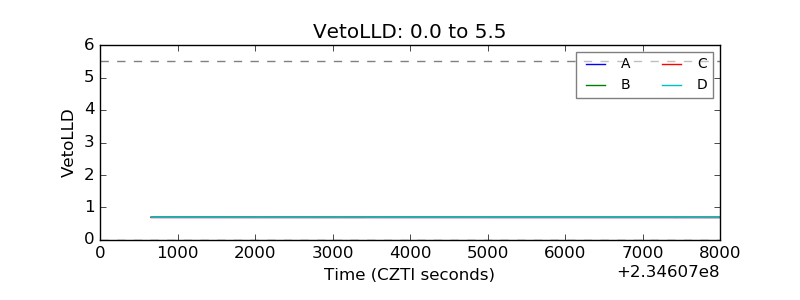 |
| Alpha Counter | 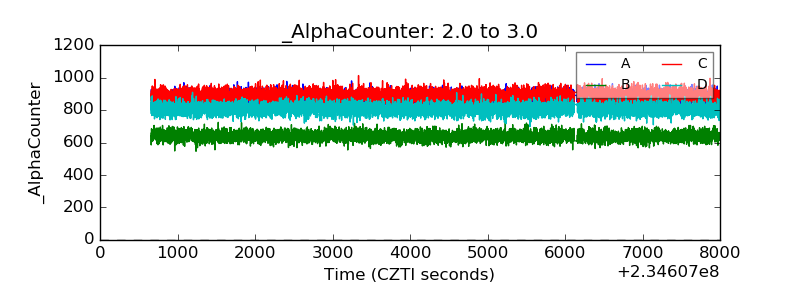 |
| _CPM_Rate | 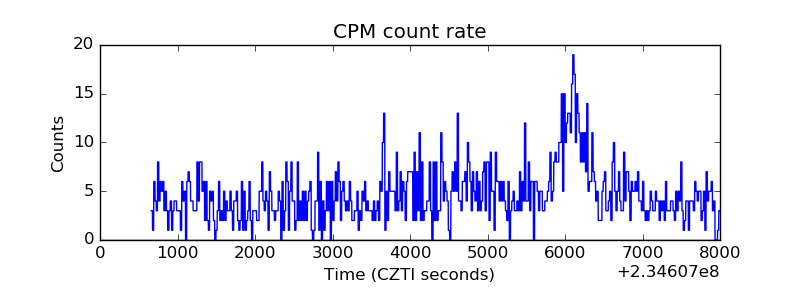 |
| CZT Counter | 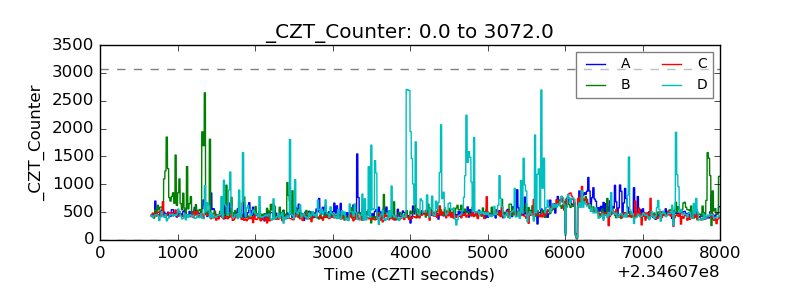 |
| +2.5 Volts monitor |  |
| +5 Volts monitor | 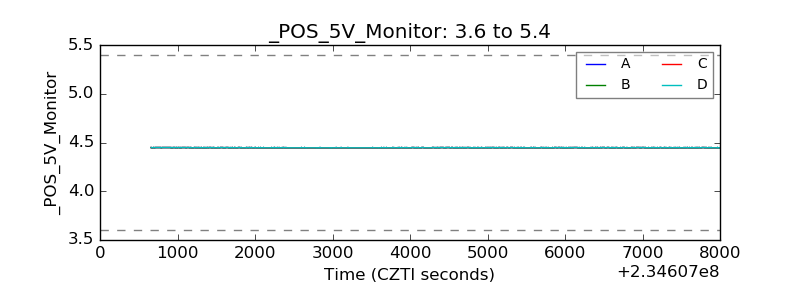 |
| _ROLL_ROT | 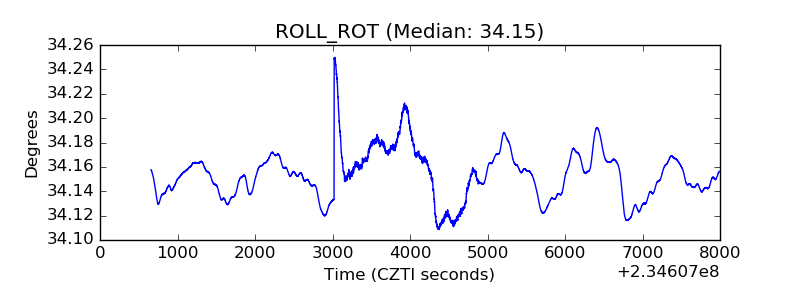 |
| _Roll_DEC | 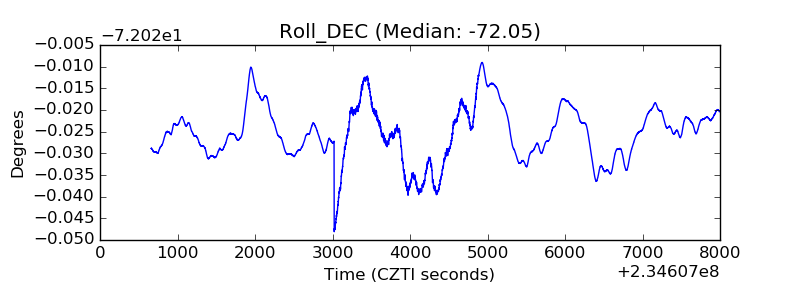 |
| _Roll_RA | 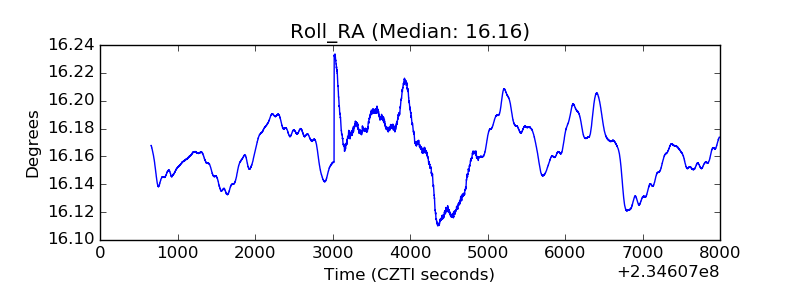 |
| Veto Counter | 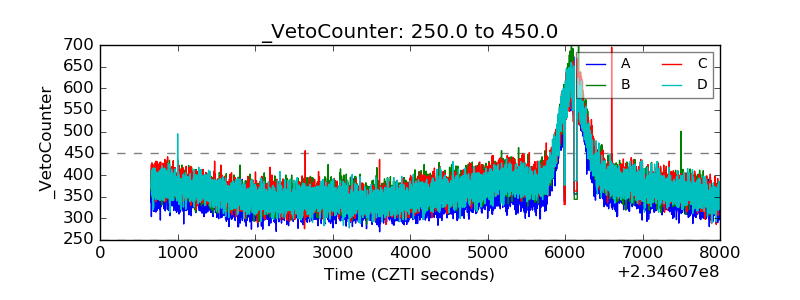 |