| Param | Original file | Final file |
|---|---|---|
| Filename | modeM0/AS1C02_027T01_9000001280_09170cztM0_level2.evt | modeM0/AS1C02_027T01_9000001280_09170cztM0_level2_quad_clean.evt |
| Size (bytes) | 1,350,653,760 | 323,464,320 |
| Size | 1.3 GB | 308.5 MB |
| Events in quadrant A | 10,910,426 | 2,140,378 |
| Events in quadrant B | 9,910,583 | 2,160,315 |
| Events in quadrant C | 7,969,534 | 2,164,356 |
| Events in quadrant D | 10,879,085 | 2,072,891 |
| Mode M0 | |||
|---|---|---|---|
| Quadrant | BADHDUFLAG | Total packets | Discarded packets |
| A | 0 | 44634 | 4 |
| B | 0 | 41458 | 3 |
| C | 0 | 37058 | 3 |
| D | 0 | 45241 | 3 |
| Mode M9 | |||
|---|---|---|---|
| Quadrant | BADHDUFLAG | Total packets | Discarded packets |
| A | 0 | 18 | 0 |
| B | 0 | 18 | 0 |
| C | 0 | 18 | 0 |
| D | 0 | 18 | 0 |
| Mode SS | |||
|---|---|---|---|
| Quadrant | BADHDUFLAG | Total packets | Discarded packets |
| A | 0 | 370 | 0 |
| B | 0 | 370 | 0 |
| C | 0 | 370 | 0 |
| D | 0 | 370 | 0 |
| Quadrant | Total seconds | Saturated seconds | Saturation percentage |
|---|---|---|---|
| A | 18285 | 378 | 2.067268% |
| B | 18285 | 433 | 2.368061% |
| C | 18285 | 161 | 0.880503% |
| D | 18285 | 775 | 4.238447% |
Noise dominated data is calculated using 1-second bins in cleaned event files. If a bin has >2000 counts, and if more than 50% of those come from <1% of pixels, then it is considered to be noise-dominated and hence unusable.
| Quadrant | # 1 sec bins | Bins with >0 counts | Bins with >2000 counts | High rate bins dominated by noise | Noise dominated (total time) | Noise dominated (detector-on time) | Marked lightcurve |
|---|---|---|---|---|---|---|---|
| A | 20034 | 18285 | 126 | 126 | 0.63% | 0.69% |  |
| B | 20034 | 18286 | 162 | 162 | 0.81% | 0.89% |  |
| C | 20034 | 18286 | 0 | 0 | 0.00% | 0.00% | 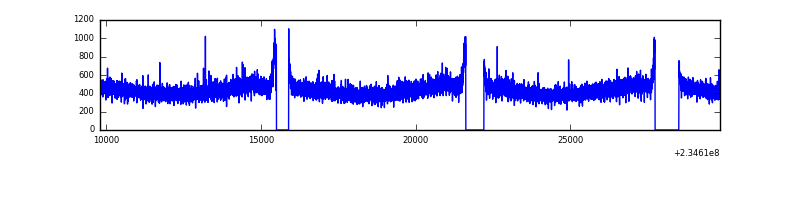 |
| D | 20034 | 18286 | 566 | 566 | 2.83% | 3.10% | 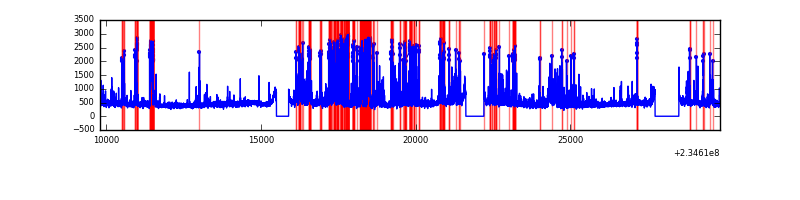 |
Top three noisy pixels from each quadrant. If the there are fewer than three noisy pixels in the level2.evt file, extra rows are filled as -1
| Pixel properties | Quadrant properties | ||||||
|---|---|---|---|---|---|---|---|
| Quadrant | DetID | PixID | Counts | Sigma | Mean | Median | Sigma |
| A | 8 | 5 | 2273853 | 5438.11 | 2076 | 2028 | 417.8 |
| A | 5 | 16 | 308961 | 734.71 | 2076 | 2028 | 417.8 |
| A | 15 | 236 | 169283 | 400.36 | 2076 | 2028 | 417.8 |
| B | 8 | 234 | 1046518 | 2646.14 | 2084 | 2022 | 394.7 |
| B | 0 | 85 | 377241 | 950.58 | 2084 | 2022 | 394.7 |
| B | 10 | 16 | 112339 | 279.48 | 2084 | 2022 | 394.7 |
| C | 13 | 61 | 15459 | 28.81 | 2033 | 2037 | 465.9 |
| C | 8 | 128 | 13815 | 25.28 | 2033 | 2037 | 465.9 |
| C | 8 | 222 | 9799 | 16.66 | 2033 | 2037 | 465.9 |
| D | 1 | 52 | 1170921 | 2205.51 | 1998 | 1951 | 530.0 |
| D | 2 | 14 | 714630 | 1344.62 | 1998 | 1951 | 530.0 |
| D | 13 | 169 | 597778 | 1124.15 | 1998 | 1951 | 530.0 |
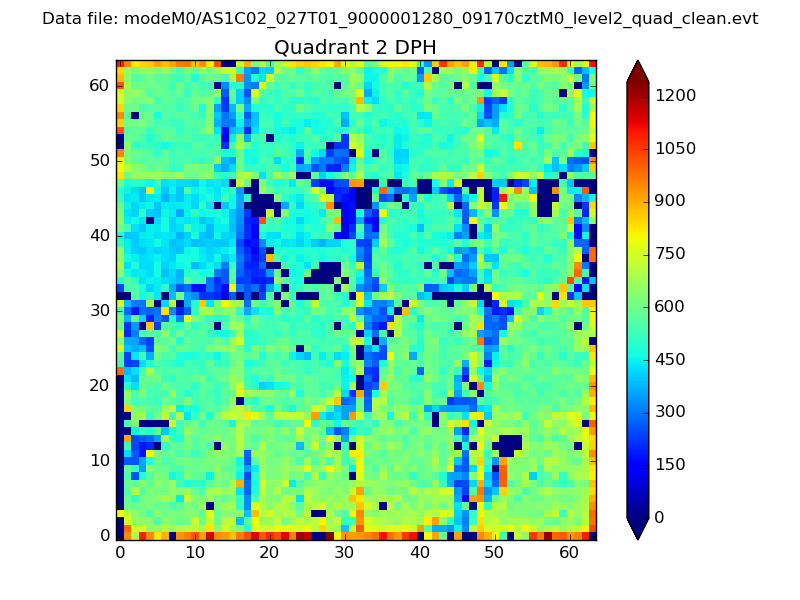
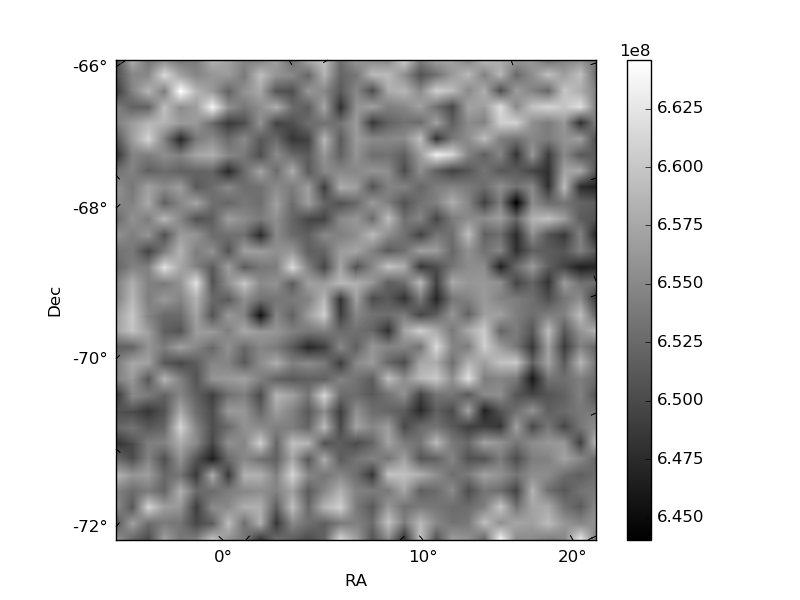
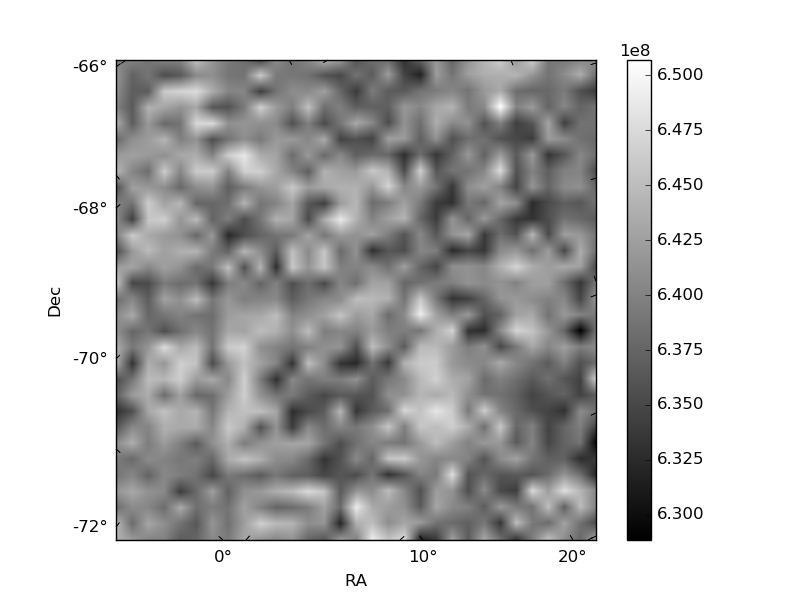
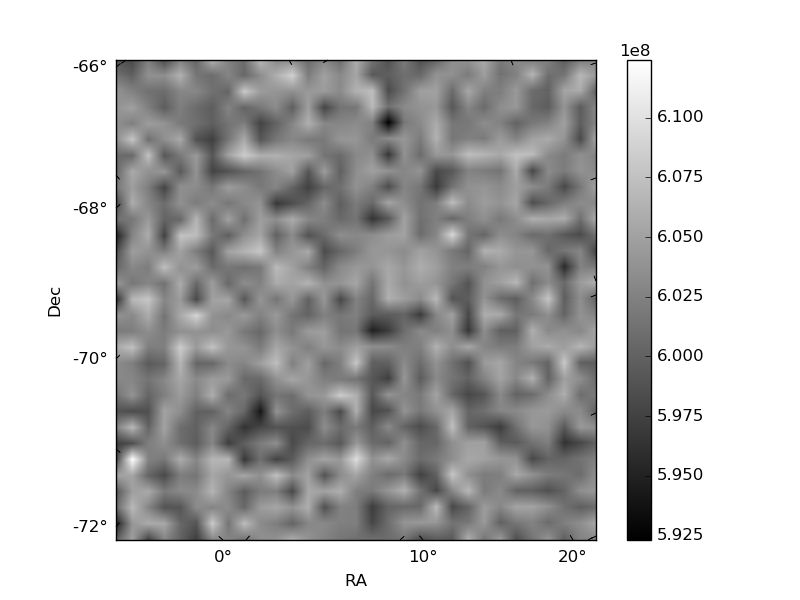
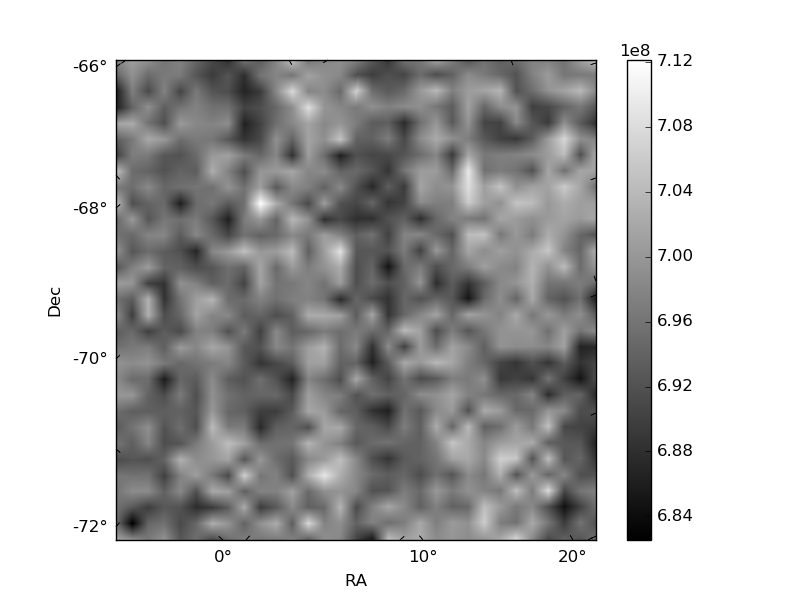
Histogram calculated using DETX and DETY for each event in the final _common_clean file
| Quadrant A | 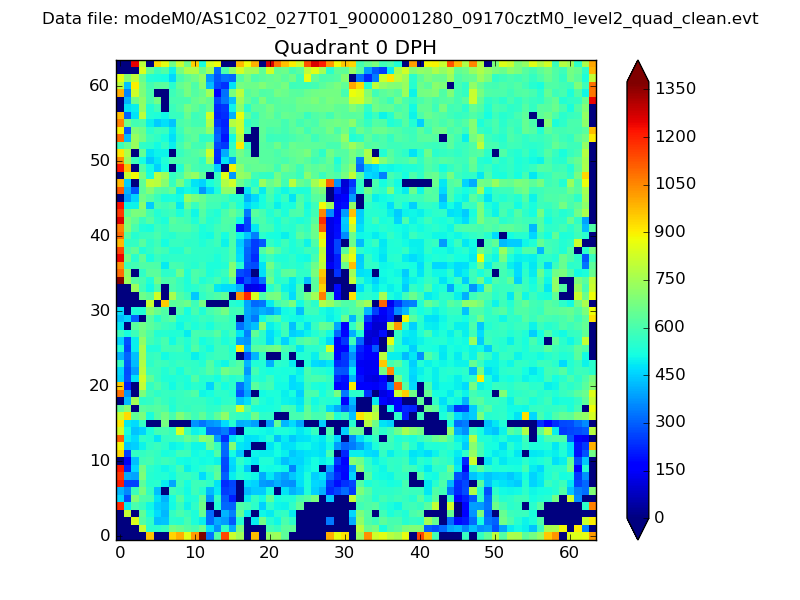 |
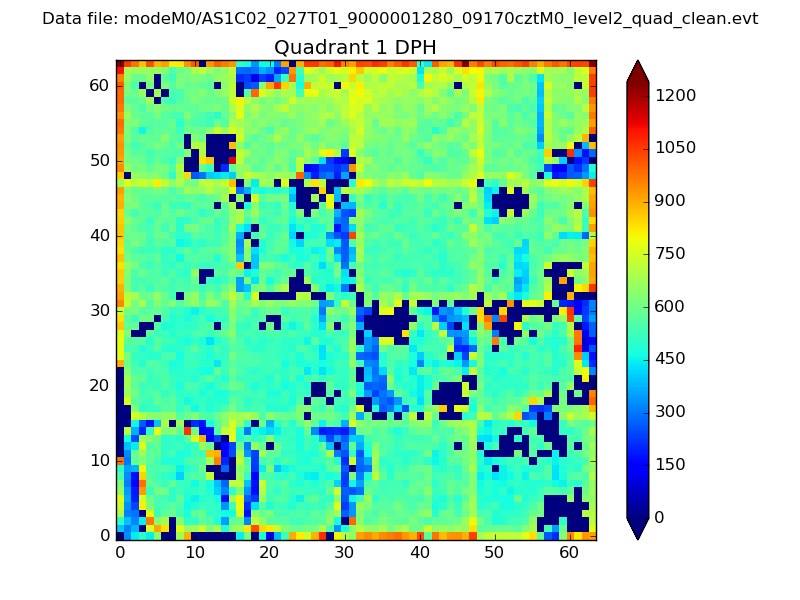 |
Quadrant B |
|---|---|---|---|
| Quadrant D | 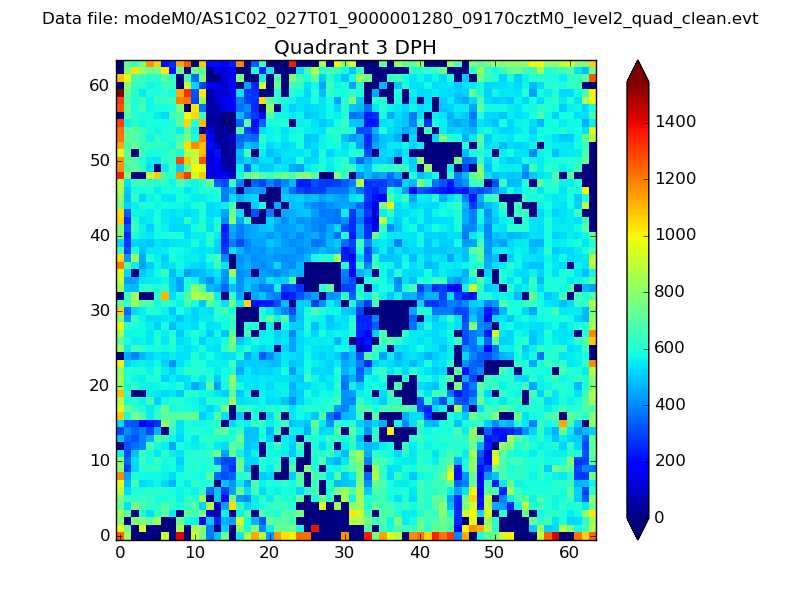 |
 |
Quadrant C |
| Plot type | Count rate plots | Images |
|---|---|---|
| Comparison with Poisson distribution Blue bars denote a histogram of data divided into 1 sec bins. Red curve is a Poisson curve with rate = median count rate of data. |
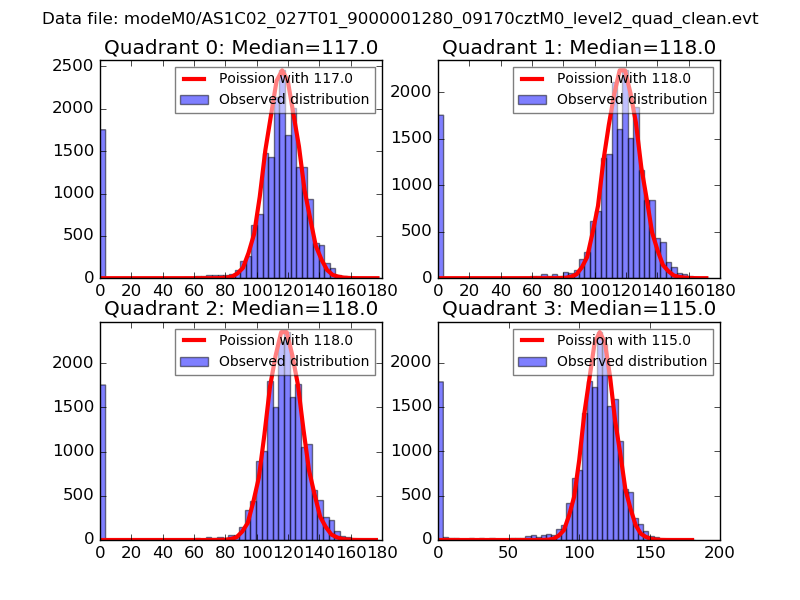 |
 |
| Quadrant-wise count rates Data is divided into 100 sec bins |
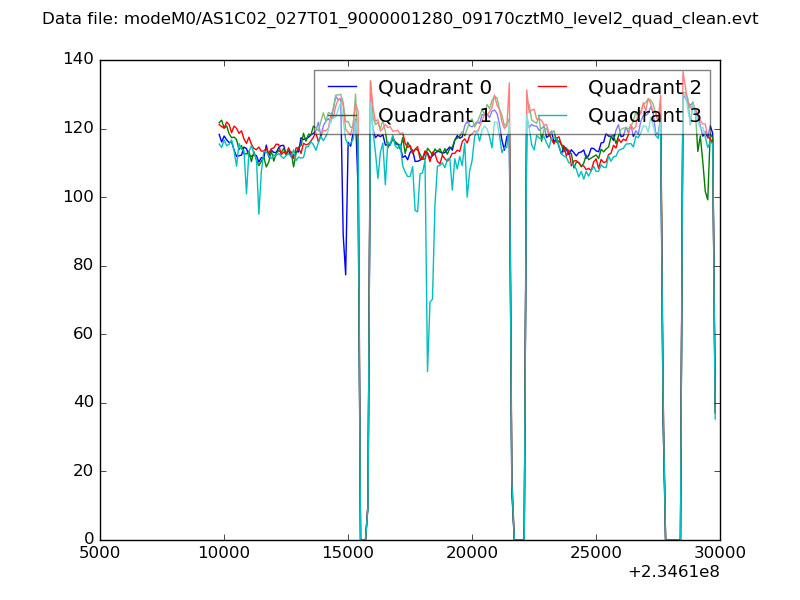 |
|
| Module-wise count rates for Quadrant A Data is divided into 100 sec bins |
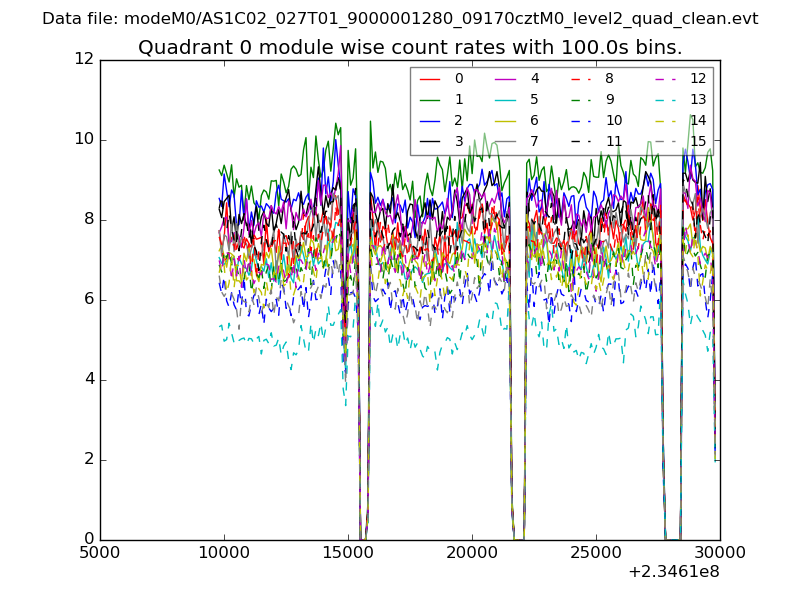 |
 |
| Module-wise count rates for Quadrant B Data is divided into 100 sec bins |
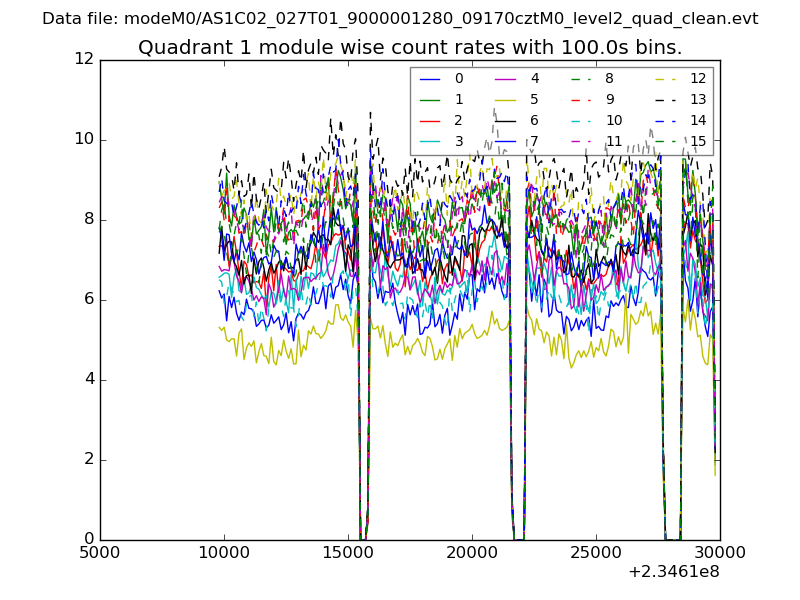 |
 |
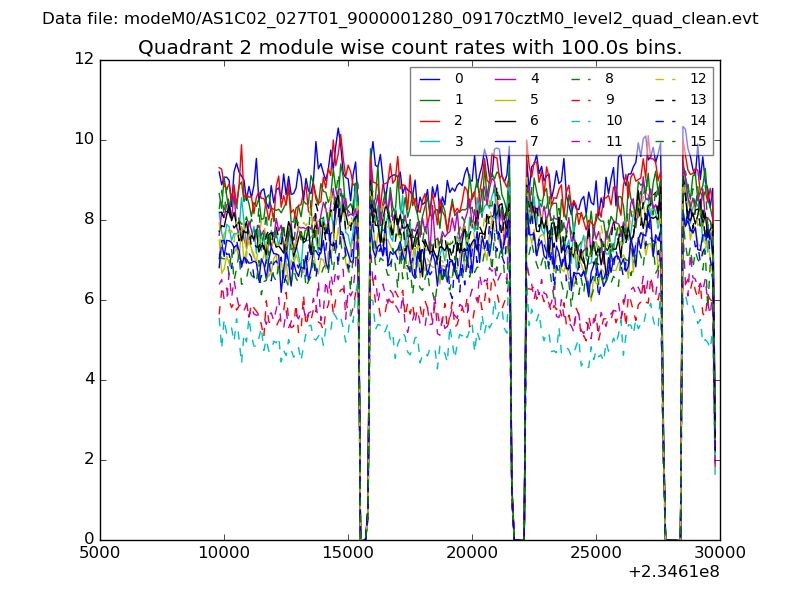
| Module-wise count rates for Quadrant C Data is divided into 100 sec bins |
 |
 |
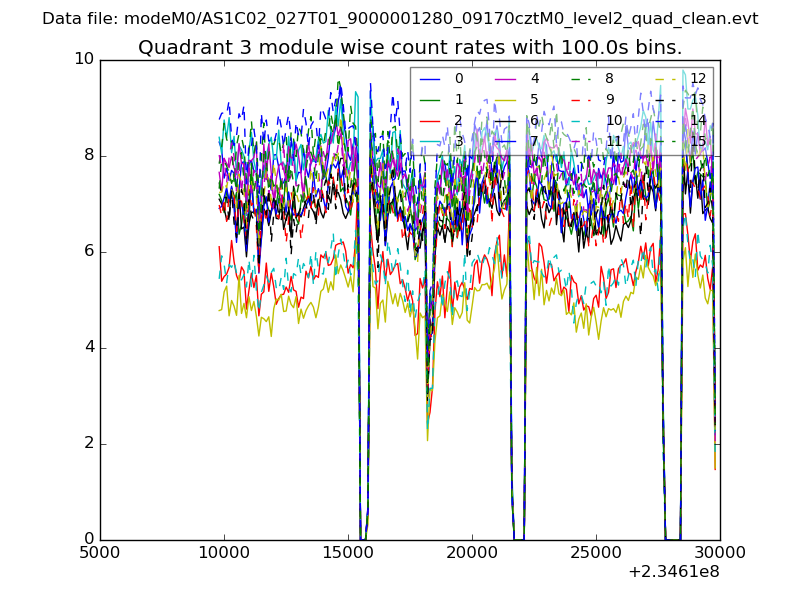
| Module-wise count rates for Quadrant D Data is divided into 100 sec bins |
 |
 |
| Parameter | Plot |
|---|---|
| CZT HV Monitor | 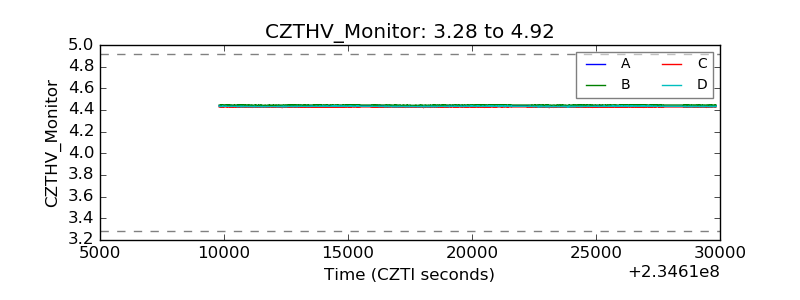 |
| D_VDD | 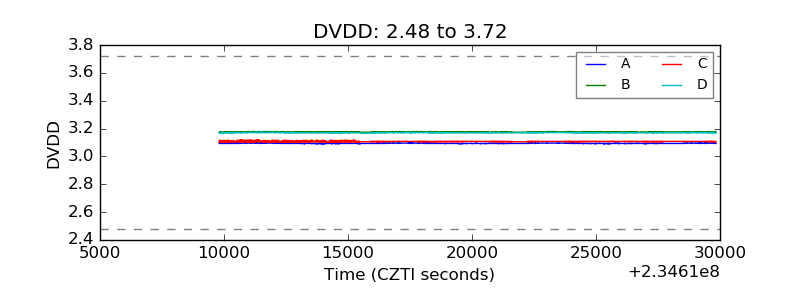 |
| Temperature 1 | 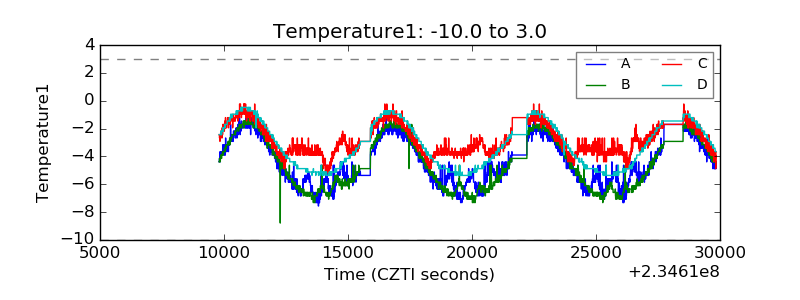 |
| Veto HV Monitor | 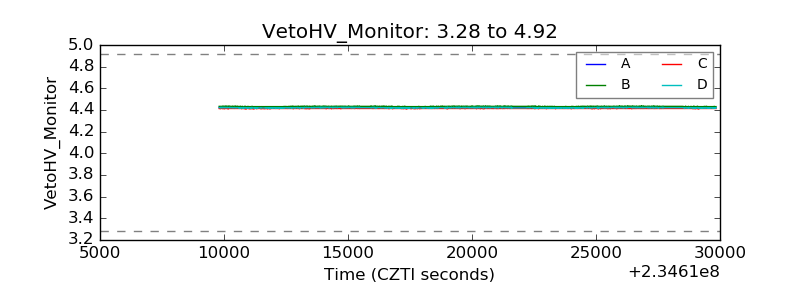 |
| Veto LLD |  |
| Alpha Counter | 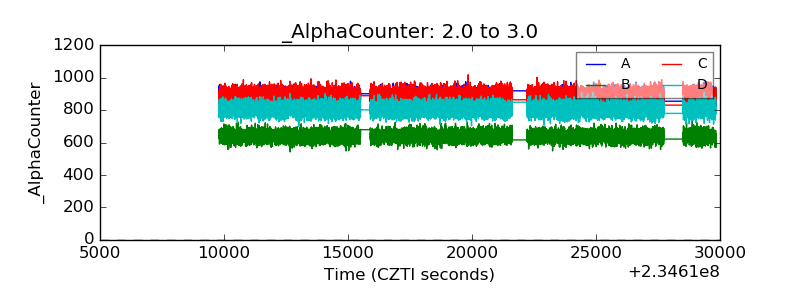 |
| _CPM_Rate | 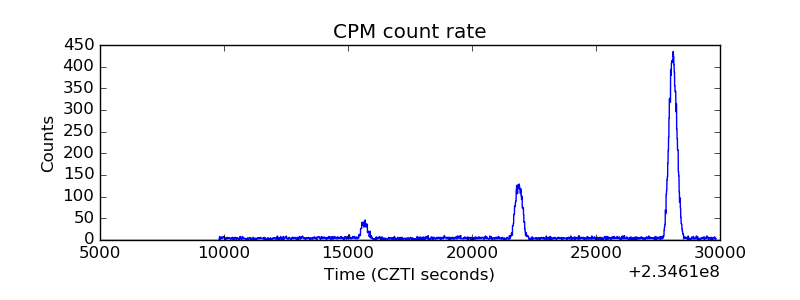 |
| CZT Counter | 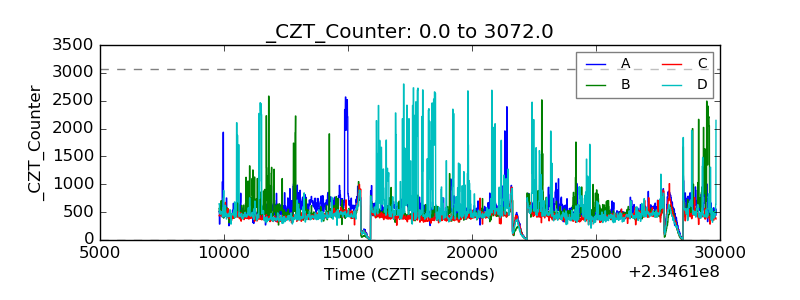 |
| +2.5 Volts monitor | 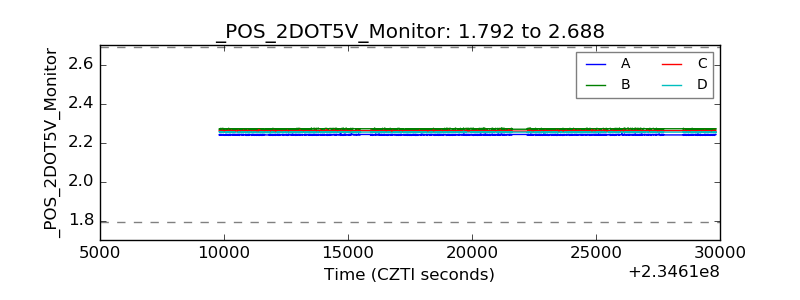 |
| +5 Volts monitor |  |
| _ROLL_ROT | 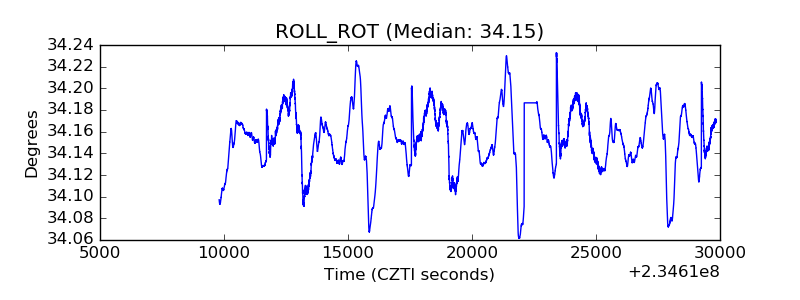 |
| _Roll_DEC | 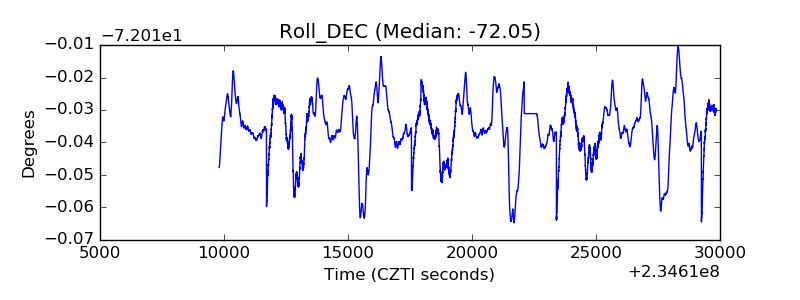 |
| _Roll_RA | 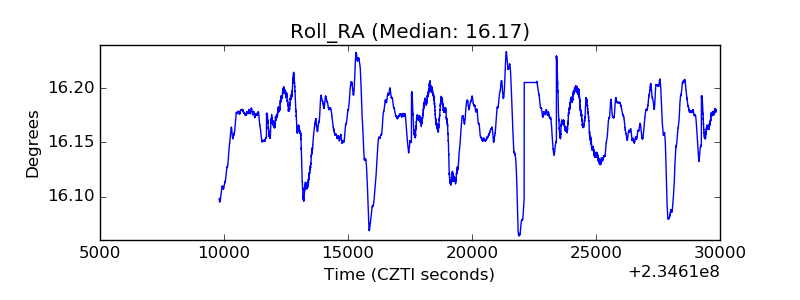 |
| Veto Counter | 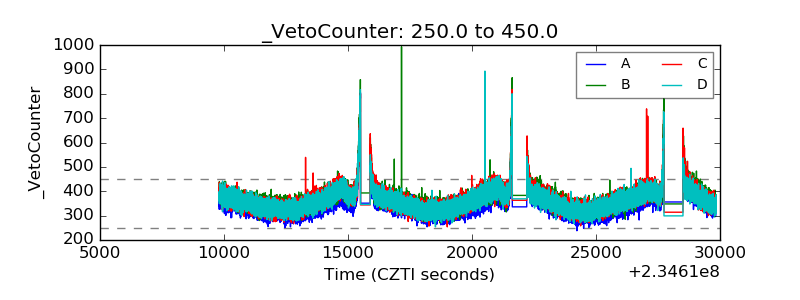 |