| Param | Original file | Final file |
|---|---|---|
| Filename | modeM0/AS1C02_027T01_9000001280_09171cztM0_level2.evt | modeM0/AS1C02_027T01_9000001280_09171cztM0_level2_quad_clean.evt |
| Size (bytes) | 506,378,880 | 121,023,360 |
| Size | 482.9 MB | 115.4 MB |
| Events in quadrant A | 3,951,433 | 809,524 |
| Events in quadrant B | 4,322,547 | 804,114 |
| Events in quadrant C | 2,919,488 | 806,040 |
| Events in quadrant D | 3,687,995 | 779,326 |
| Mode M0 | |||
|---|---|---|---|
| Quadrant | BADHDUFLAG | Total packets | Discarded packets |
| A | 0 | 16104 | 3 |
| B | 0 | 17342 | 2 |
| C | 0 | 13541 | 2 |
| D | 0 | 15756 | 2 |
| Mode M9 | |||
|---|---|---|---|
| Quadrant | BADHDUFLAG | Total packets | Discarded packets |
| A | 0 | 12 | 0 |
| B | 0 | 12 | 0 |
| C | 0 | 12 | 0 |
| D | 0 | 13 | 0 |
| Mode SS | |||
|---|---|---|---|
| Quadrant | BADHDUFLAG | Total packets | Discarded packets |
| A | 0 | 134 | 0 |
| B | 0 | 134 | 0 |
| C | 0 | 134 | 0 |
| D | 0 | 134 | 0 |
| Quadrant | Total seconds | Saturated seconds | Saturation percentage |
|---|---|---|---|
| A | 6697 | 168 | 2.508586% |
| B | 6697 | 255 | 3.807675% |
| C | 6697 | 25 | 0.373301% |
| D | 6697 | 186 | 2.777363% |
Noise dominated data is calculated using 1-second bins in cleaned event files. If a bin has >2000 counts, and if more than 50% of those come from <1% of pixels, then it is considered to be noise-dominated and hence unusable.
| Quadrant | # 1 sec bins | Bins with >0 counts | Bins with >2000 counts | High rate bins dominated by noise | Noise dominated (total time) | Noise dominated (detector-on time) | Marked lightcurve |
|---|---|---|---|---|---|---|---|
| A | 7657 | 6698 | 97 | 97 | 1.27% | 1.45% | 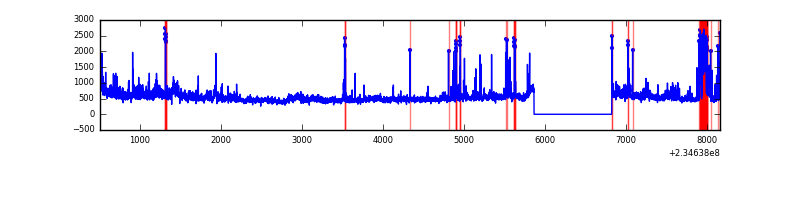 |
| B | 7657 | 6698 | 151 | 151 | 1.97% | 2.25% | 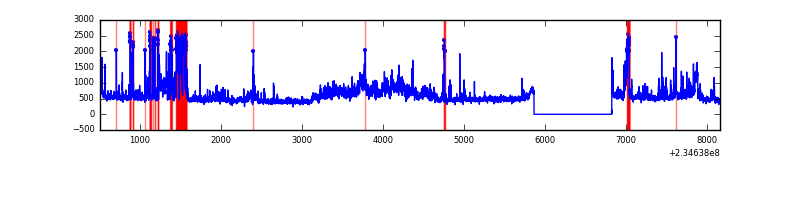 |
| C | 7657 | 6698 | 0 | 0 | 0.00% | 0.00% | 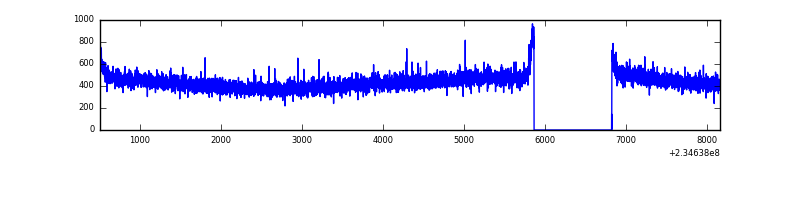 |
| D | 7657 | 6698 | 151 | 151 | 1.97% | 2.25% | 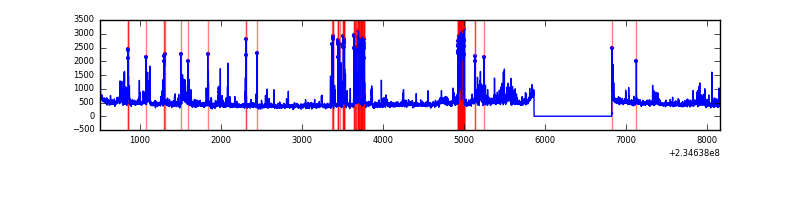 |
Top three noisy pixels from each quadrant. If the there are fewer than three noisy pixels in the level2.evt file, extra rows are filled as -1
| Pixel properties | Quadrant properties | ||||||
|---|---|---|---|---|---|---|---|
| Quadrant | DetID | PixID | Counts | Sigma | Mean | Median | Sigma |
| A | 8 | 5 | 522628 | 3309.43 | 770 | 752 | 157.7 |
| A | 15 | 223 | 246518 | 1558.5 | 770 | 752 | 157.7 |
| A | 15 | 239 | 108102 | 680.75 | 770 | 752 | 157.7 |
| B | 8 | 234 | 1172028 | 7977.31 | 769 | 752 | 146.8 |
| B | 0 | 85 | 52519 | 352.57 | 769 | 752 | 146.8 |
| B | 0 | 229 | 22663 | 149.23 | 769 | 752 | 146.8 |
| C | 13 | 61 | 5863 | 29.97 | 745 | 746 | 170.7 |
| C | 8 | 128 | 4757 | 23.5 | 745 | 746 | 170.7 |
| C | 8 | 222 | 4112 | 19.72 | 745 | 746 | 170.7 |
| D | 1 | 52 | 597813 | 3037.93 | 732 | 714 | 196.5 |
| D | 2 | 14 | 97074 | 490.26 | 732 | 714 | 196.5 |
| D | 13 | 169 | 60079 | 302.04 | 732 | 714 | 196.5 |
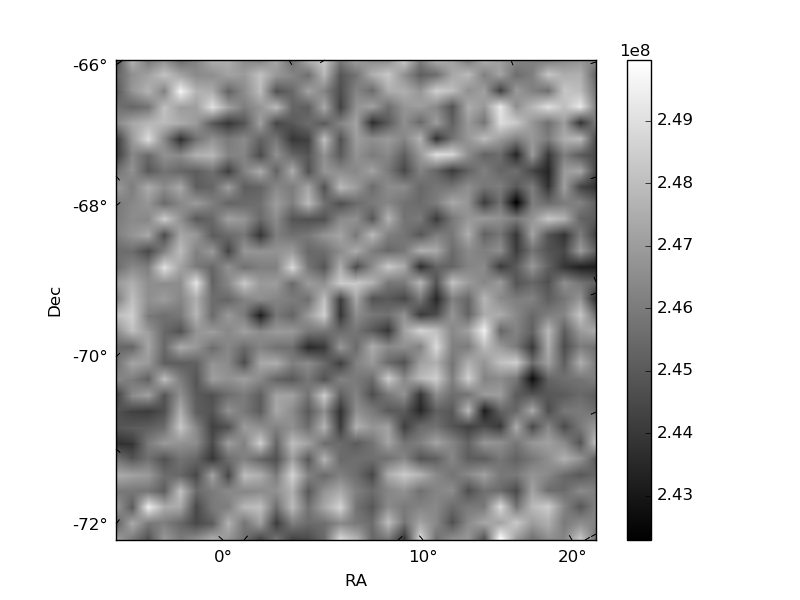
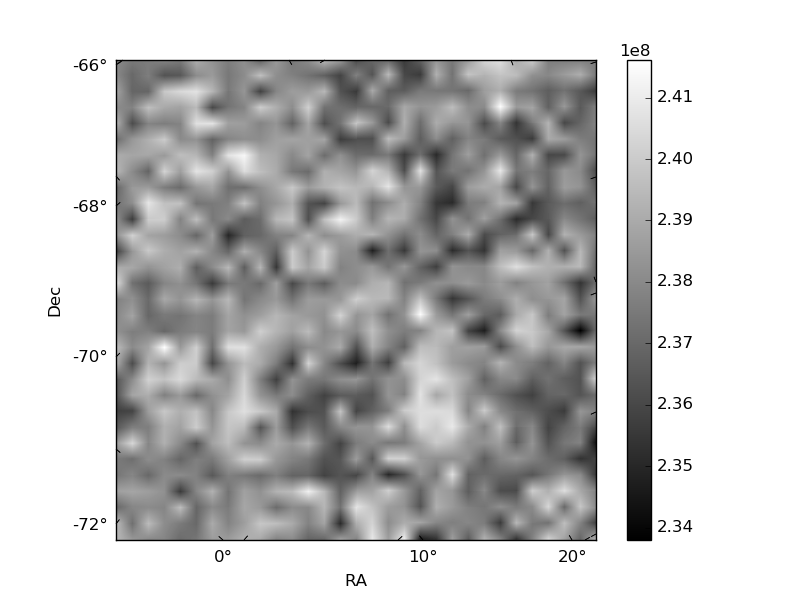
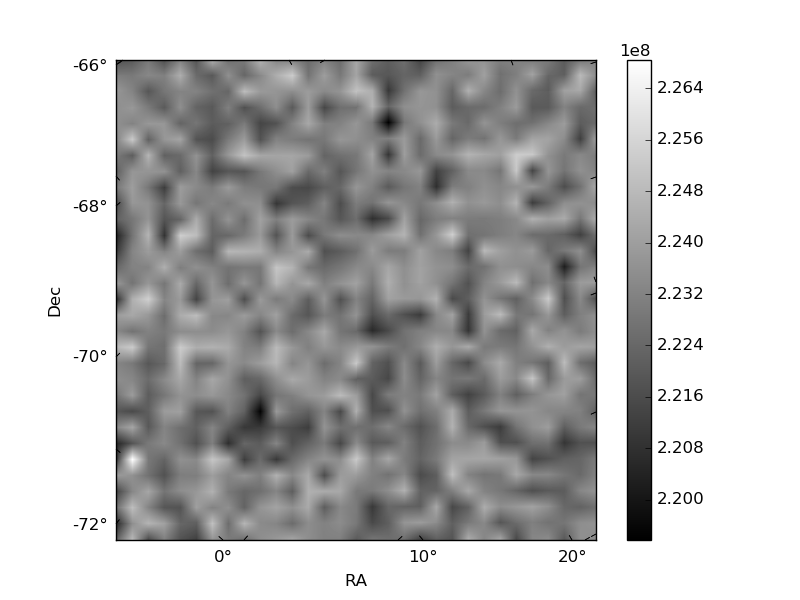
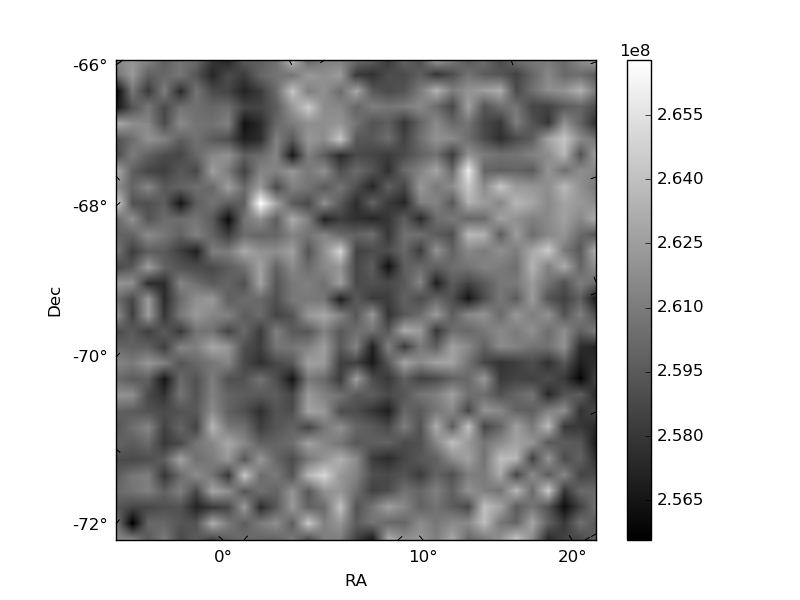
Histogram calculated using DETX and DETY for each event in the final _common_clean file
| Quadrant A |  |
 |
Quadrant B |
|---|---|---|---|
| Quadrant D |  |
 |
Quadrant C |
| Plot type | Count rate plots | Images |
|---|---|---|
| Comparison with Poisson distribution Blue bars denote a histogram of data divided into 1 sec bins. Red curve is a Poisson curve with rate = median count rate of data. |
 |
 |
| Quadrant-wise count rates Data is divided into 100 sec bins |
 |
|
| Module-wise count rates for Quadrant A Data is divided into 100 sec bins |
 |
 |
| Module-wise count rates for Quadrant B Data is divided into 100 sec bins |
 |
 |
| Module-wise count rates for Quadrant C Data is divided into 100 sec bins |
 |
 |
| Module-wise count rates for Quadrant D Data is divided into 100 sec bins |
 |
 |
| Parameter | Plot |
|---|---|
| CZT HV Monitor |  |
| D_VDD |  |
| Temperature 1 |  |
| Veto HV Monitor |  |
| Veto LLD |  |
| Alpha Counter |  |
| _CPM_Rate |  |
| CZT Counter |  |
| +2.5 Volts monitor |  |
| +5 Volts monitor |  |
| _ROLL_ROT |  |
| _Roll_DEC |  |
| _Roll_RA |  |
| Veto Counter |  |