| Param | Original file | Final file |
|---|---|---|
| Filename | modeM0/AS1C02_027T01_9000001280_09173cztM0_level2.evt | modeM0/AS1C02_027T01_9000001280_09173cztM0_level2_quad_clean.evt |
| Size (bytes) | 128,180,160 | 31,311,360 |
| Size | 122.2 MB | 29.9 MB |
| Events in quadrant A | 1,223,349 | 205,631 |
| Events in quadrant B | 1,026,823 | 208,999 |
| Events in quadrant C | 733,641 | 208,392 |
| Events in quadrant D | 784,301 | 204,318 |
| Mode M0 | |||
|---|---|---|---|
| Quadrant | BADHDUFLAG | Total packets | Discarded packets |
| A | 0 | 4743 | 15 |
| B | 0 | 4127 | 1 |
| C | 0 | 3321 | 3 |
| D | 0 | 3473 | 8 |
| Mode M9 | |||
|---|---|---|---|
| Quadrant | BADHDUFLAG | Total packets | Discarded packets |
| A | 0 | 3 | 0 |
| B | 0 | 3 | 0 |
| C | 0 | 3 | 0 |
| D | 0 | 4 | 0 |
| Mode SS | |||
|---|---|---|---|
| Quadrant | BADHDUFLAG | Total packets | Discarded packets |
| A | 0 | 32 | 0 |
| B | 0 | 32 | 0 |
| C | 0 | 32 | 0 |
| D | 0 | 32 | 0 |
| Quadrant | Total seconds | Saturated seconds | Saturation percentage |
|---|---|---|---|
| A | 1636 | 129 | 7.885086% |
| B | 1640 | 41 | 2.500000% |
| C | 1639 | 2 | 0.122026% |
| D | 1637 | 8 | 0.488699% |
Noise dominated data is calculated using 1-second bins in cleaned event files. If a bin has >2000 counts, and if more than 50% of those come from <1% of pixels, then it is considered to be noise-dominated and hence unusable.
| Quadrant | # 1 sec bins | Bins with >0 counts | Bins with >2000 counts | High rate bins dominated by noise | Noise dominated (total time) | Noise dominated (detector-on time) | Marked lightcurve |
|---|---|---|---|---|---|---|---|
| A | 1640 | 1640 | 114 | 114 | 6.95% | 6.95% | 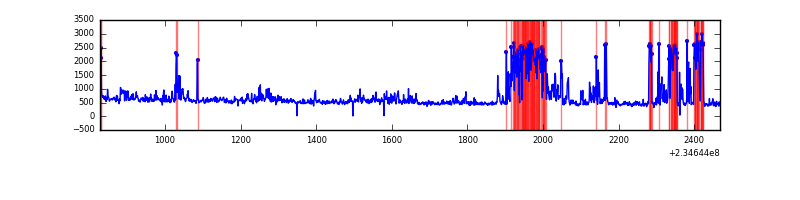 |
| B | 1640 | 1640 | 24 | 24 | 1.46% | 1.46% | 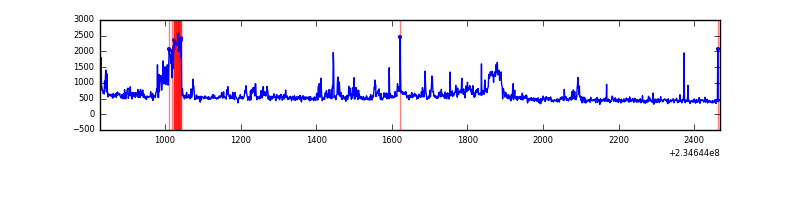 |
| C | 1640 | 1640 | 0 | 0 | 0.00% | 0.00% | 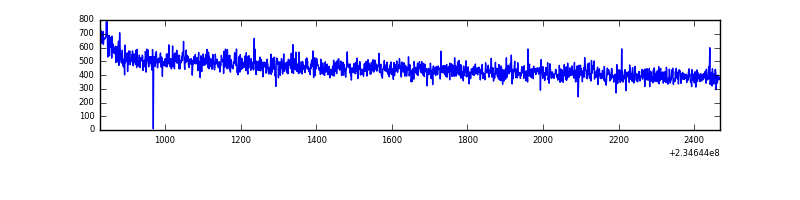 |
| D | 1640 | 1640 | 2 | 2 | 0.12% | 0.12% | 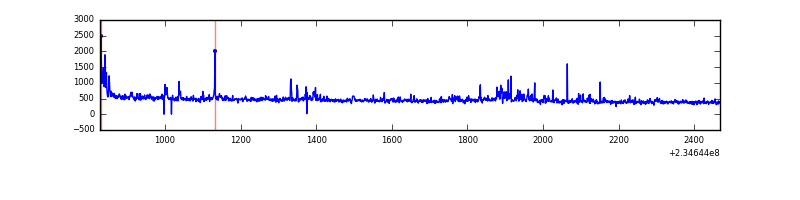 |
Top three noisy pixels from each quadrant. If the there are fewer than three noisy pixels in the level2.evt file, extra rows are filled as -1
| Pixel properties | Quadrant properties | ||||||
|---|---|---|---|---|---|---|---|
| Quadrant | DetID | PixID | Counts | Sigma | Mean | Median | Sigma |
| A | 15 | 223 | 275146 | 6690.73 | 192 | 188 | 41.1 |
| A | 15 | 239 | 112111 | 2723.5 | 192 | 188 | 41.1 |
| A | 8 | 5 | 68984 | 1674.06 | 192 | 188 | 41.1 |
| B | 8 | 234 | 166964 | 4220.02 | 197 | 193 | 39.5 |
| B | 0 | 85 | 29365 | 738.18 | 197 | 193 | 39.5 |
| B | 0 | 229 | 20252 | 507.58 | 197 | 193 | 39.5 |
| C | 8 | 128 | 4842 | 105.92 | 185 | 185 | 44.0 |
| C | 8 | 112 | 2260 | 47.19 | 185 | 185 | 44.0 |
| C | 14 | 67 | 2064 | 42.73 | 185 | 185 | 44.0 |
| D | 9 | 64 | 21871 | 454.91 | 186 | 179 | 47.7 |
| D | 12 | 233 | 17185 | 356.64 | 186 | 179 | 47.7 |
| D | 13 | 104 | 15243 | 315.91 | 186 | 179 | 47.7 |
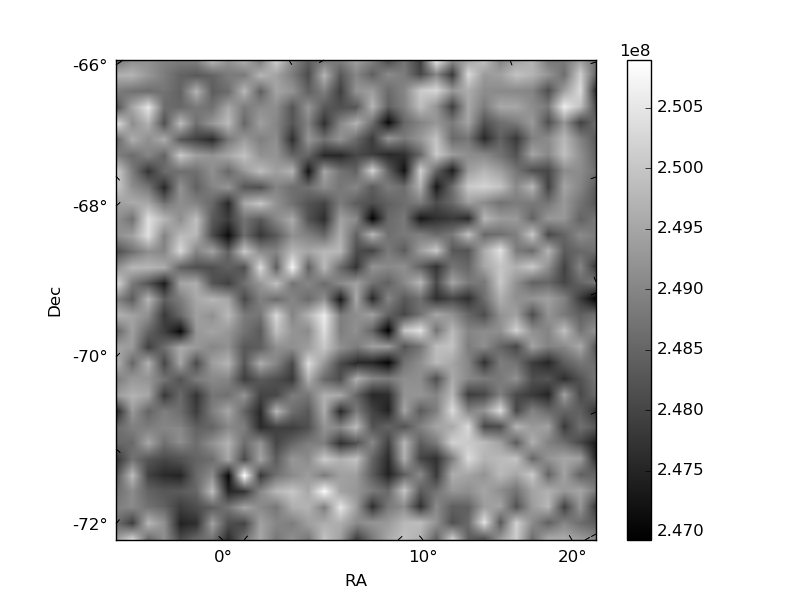
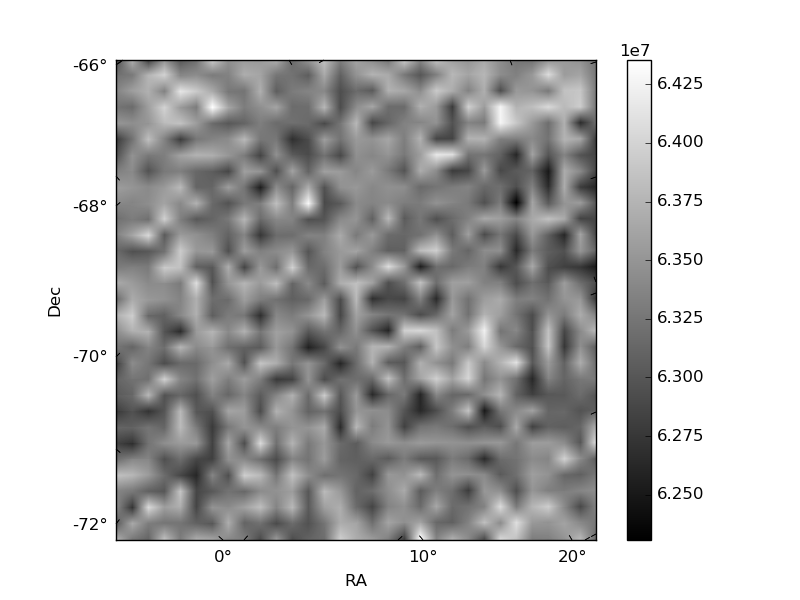
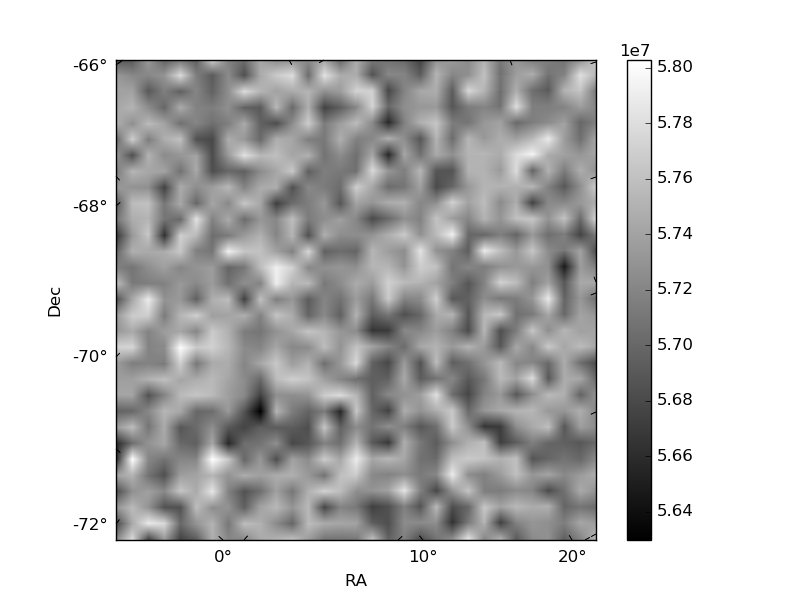
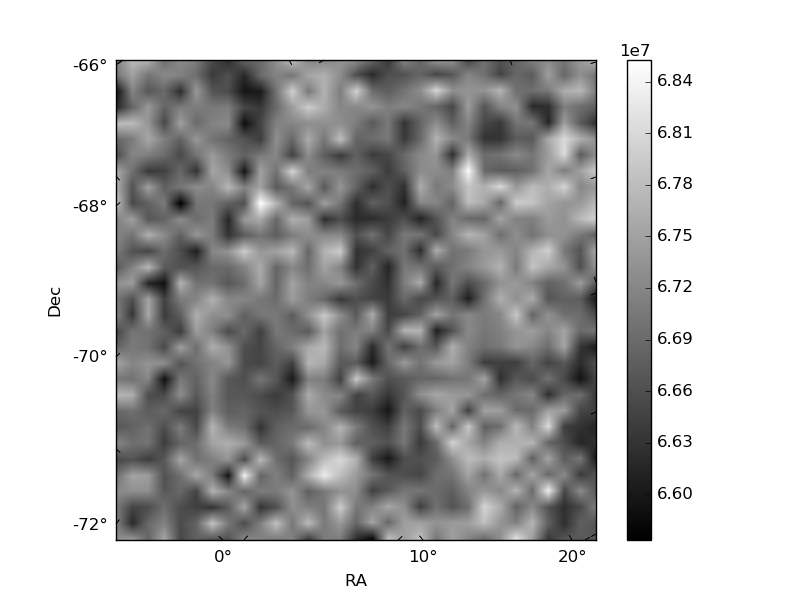
Histogram calculated using DETX and DETY for each event in the final _common_clean file
| Quadrant A | 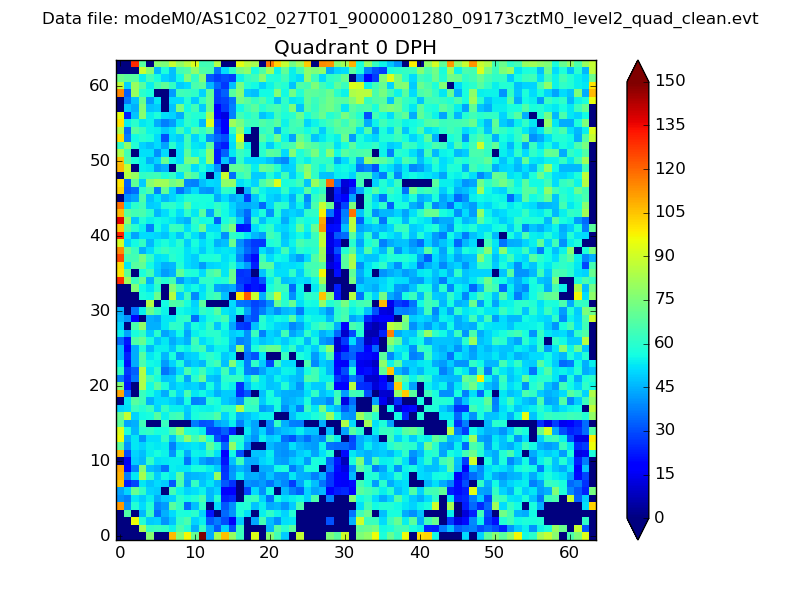 |
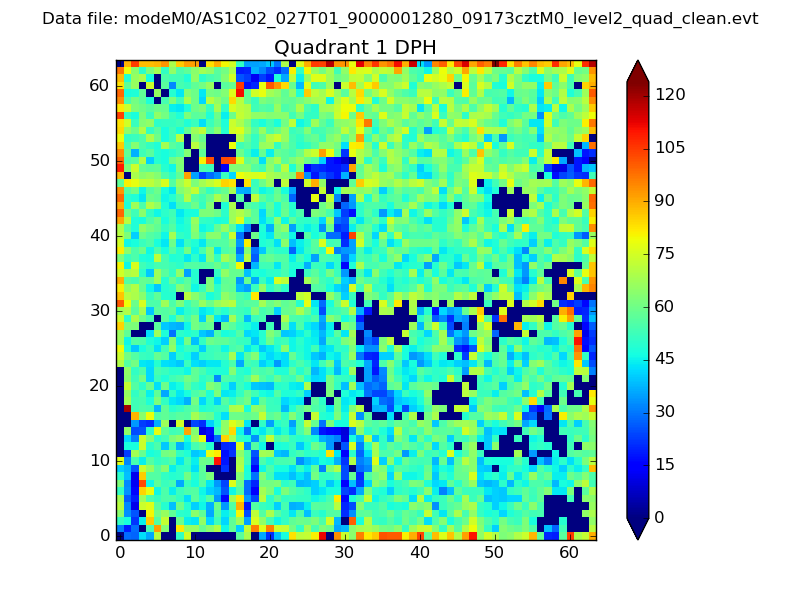 |
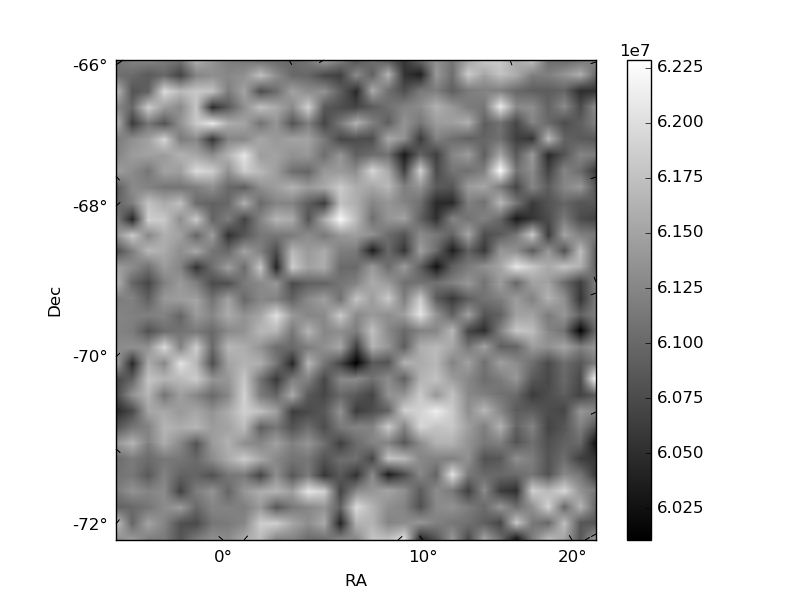
Quadrant B |
|---|---|---|---|
| Quadrant D | 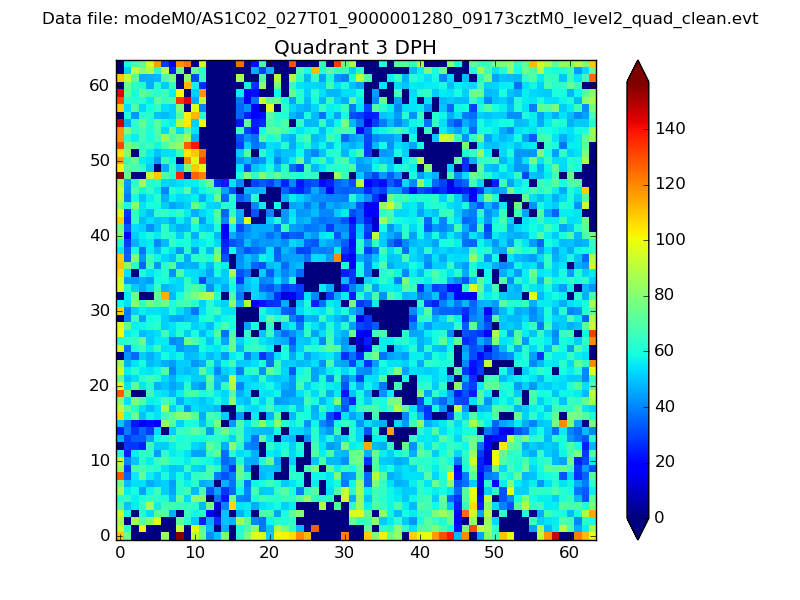 |
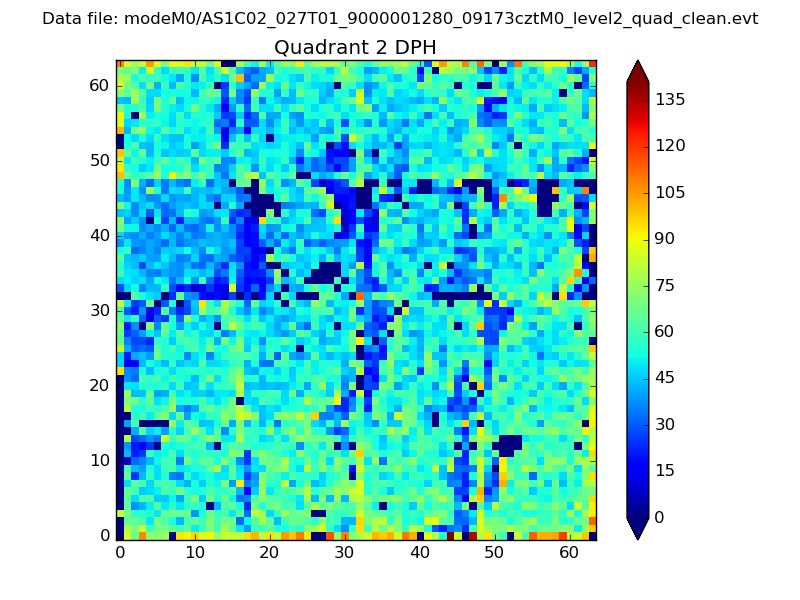 |
Quadrant C |
| Plot type | Count rate plots | Images |
|---|---|---|
| Comparison with Poisson distribution Blue bars denote a histogram of data divided into 1 sec bins. Red curve is a Poisson curve with rate = median count rate of data. |
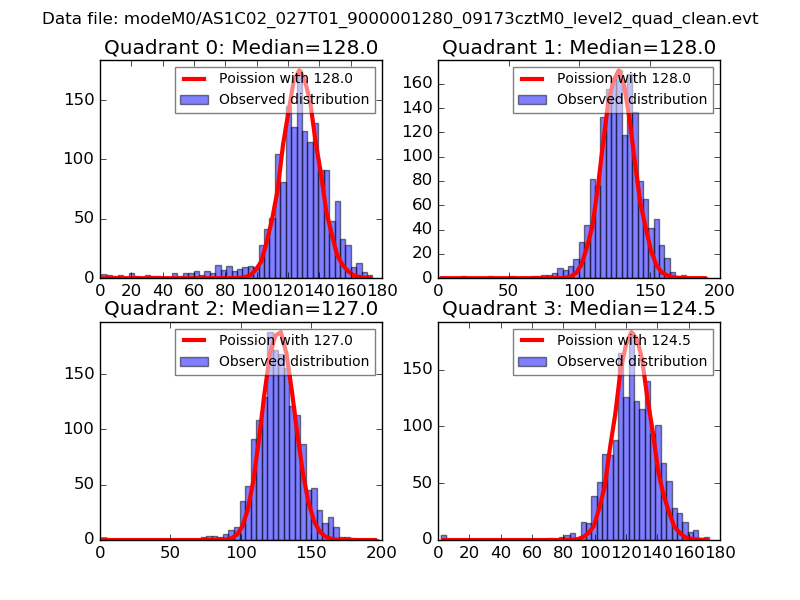 |
 |
| Quadrant-wise count rates Data is divided into 100 sec bins |
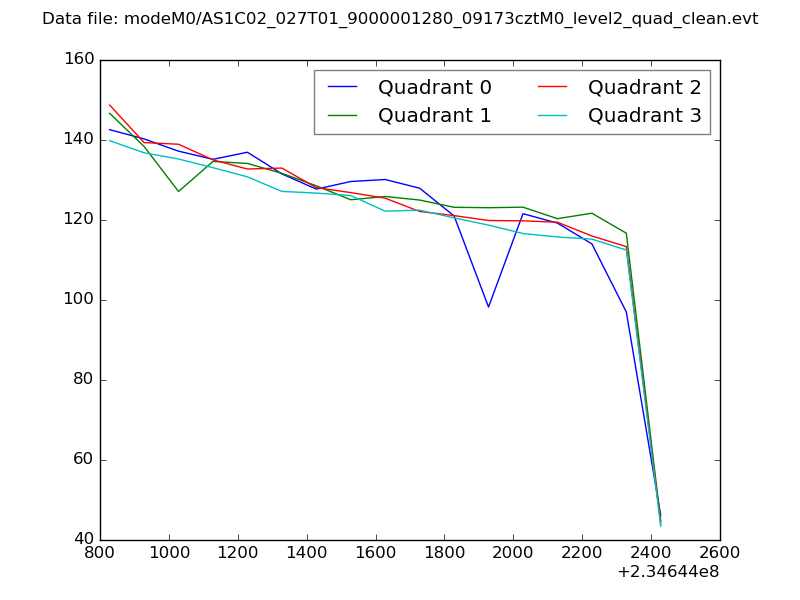 |
|
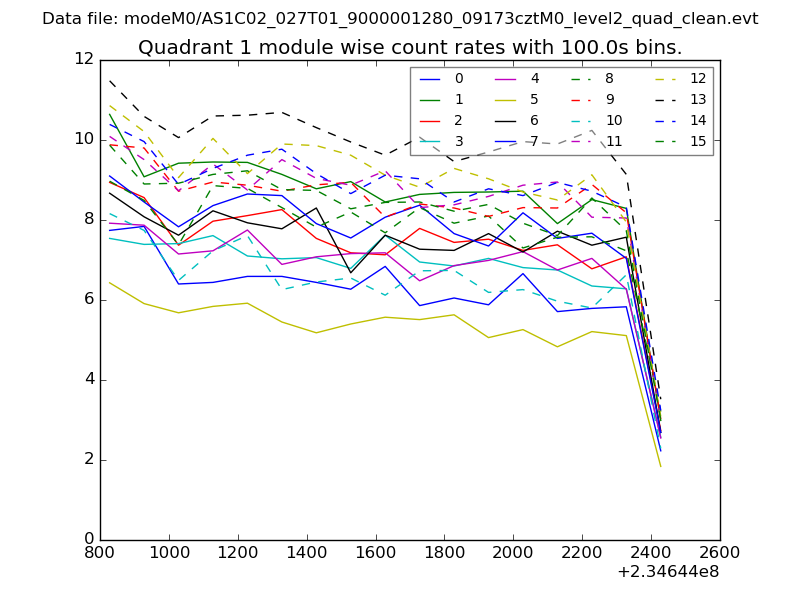
| Module-wise count rates for Quadrant A Data is divided into 100 sec bins |
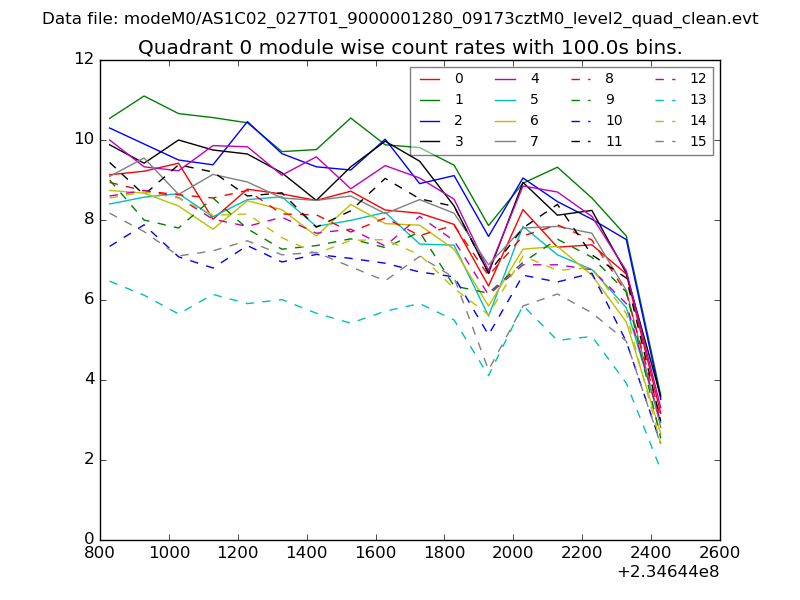 |
 |
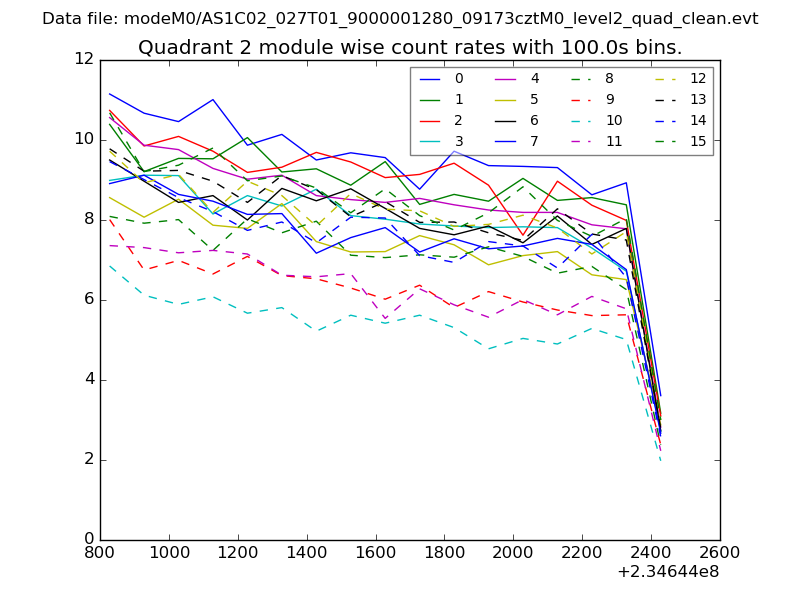
| Module-wise count rates for Quadrant B Data is divided into 100 sec bins |
 |
 |
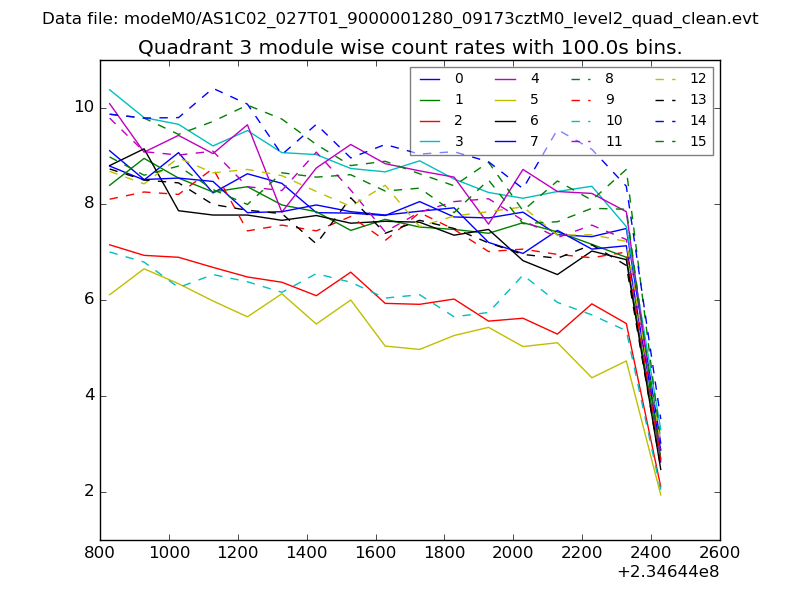
| Module-wise count rates for Quadrant C Data is divided into 100 sec bins |
 |
 |
| Module-wise count rates for Quadrant D Data is divided into 100 sec bins |
 |
 |
| Parameter | Plot |
|---|---|
| CZT HV Monitor | 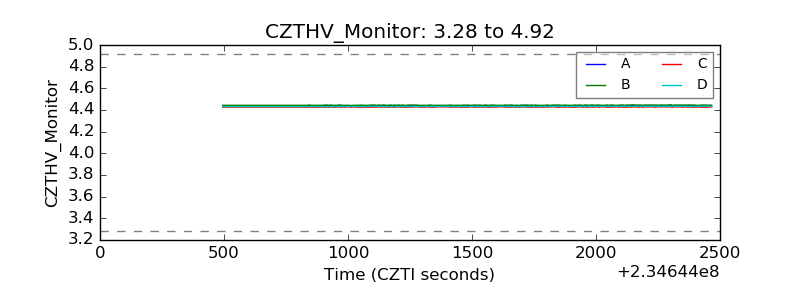 |
| D_VDD |  |
| Temperature 1 | 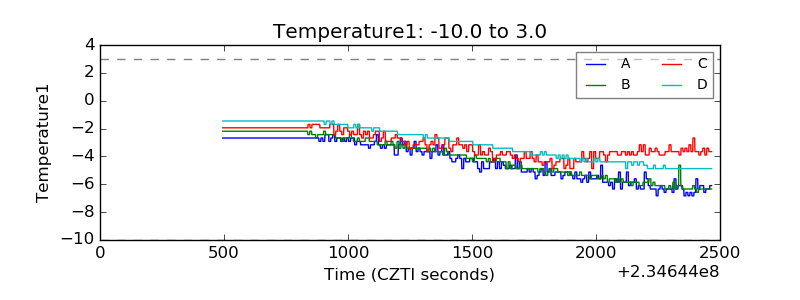 |
| Veto HV Monitor | 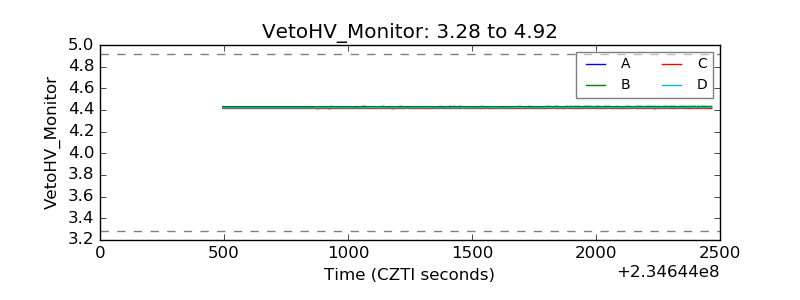 |
| Veto LLD | 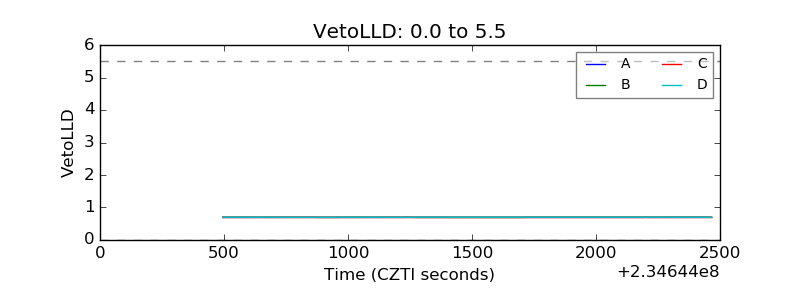 |
| Alpha Counter | 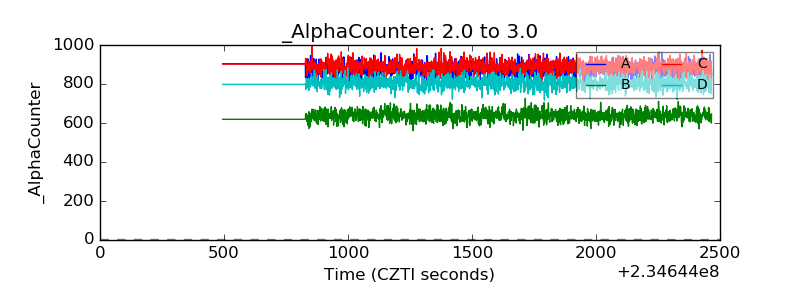 |
| _CPM_Rate | 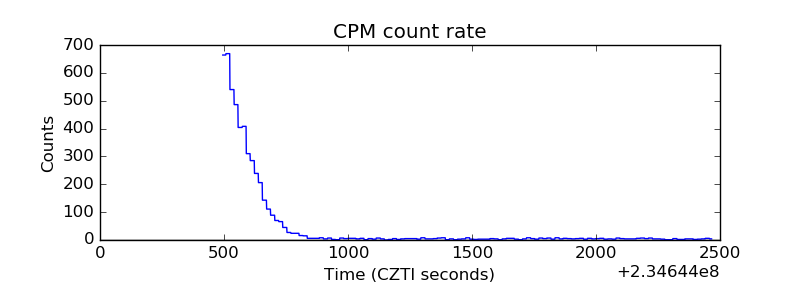 |
| CZT Counter | 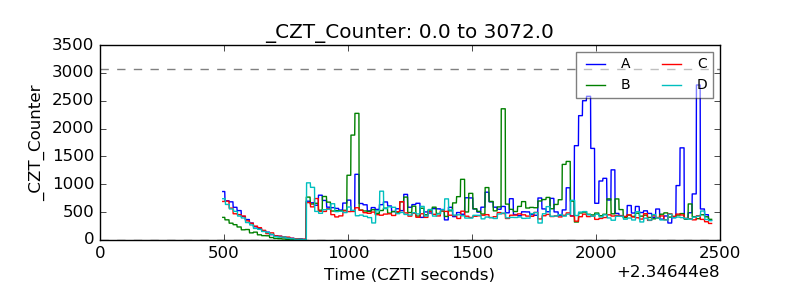 |
| +2.5 Volts monitor | 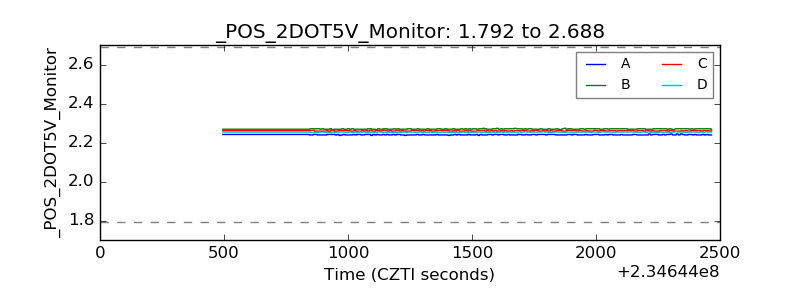 |
| +5 Volts monitor |  |
| _ROLL_ROT | 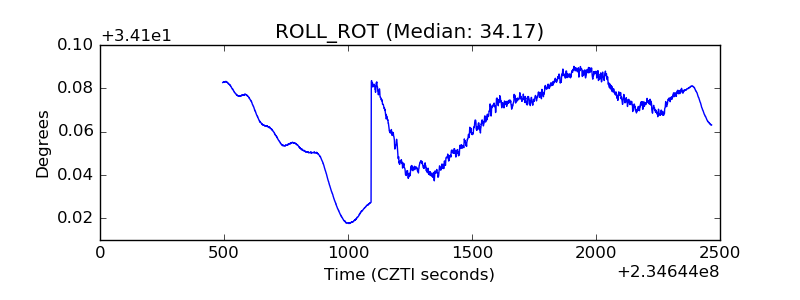 |
| _Roll_DEC | 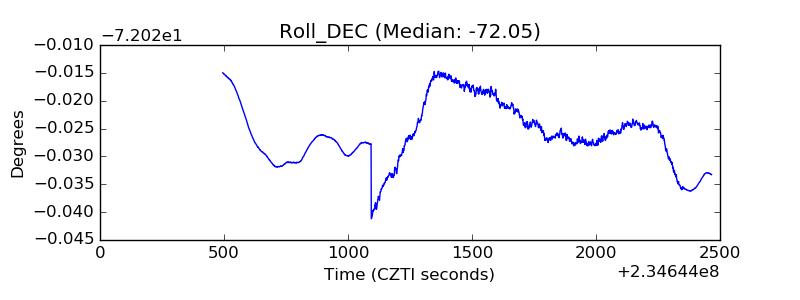 |
| _Roll_RA | 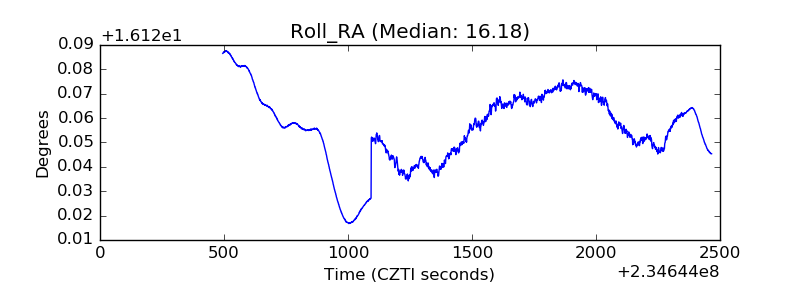 |
| Veto Counter | 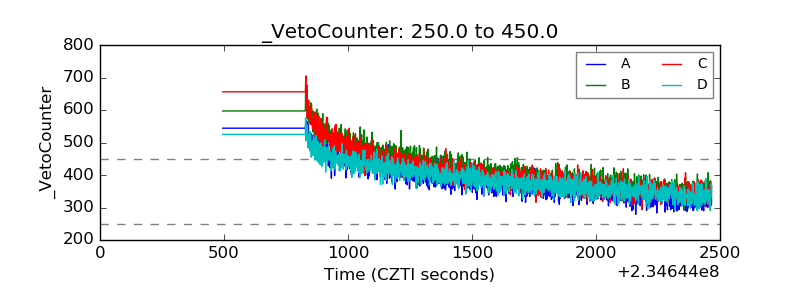 |