| Param | Original file | Final file |
|---|---|---|
| Filename | modeM0/AS1C02_041T02_9000001282cztM0_level2.fits | modeM0/AS1C02_041T02_9000001282cztM0_level2_quad_clean.evt |
| Size (bytes) | 920,848,320 | 797,728,320 |
| Size | 878.2 MB | 760.8 MB |
| Events in quadrant A | 5,530,058 | 4,561,100 |
| Events in quadrant B | 5,416,722 | 4,567,025 |
| Events in quadrant C | 5,533,502 | 4,347,803 |
| Events in quadrant D | 4,725,674 | 4,000,860 |
| Mode SS | |||
|---|---|---|---|
| Quadrant | BADHDUFLAG | Total packets | Discarded packets |
| A | 0 | 1980 | 0 |
| B | 0 | 1980 | 0 |
| C | 0 | 1980 | 0 |
| D | 0 | 1980 | 0 |
| Mode M0 | |||
|---|---|---|---|
| Quadrant | BADHDUFLAG | Total packets | Discarded packets |
| A | 0 | 237294 | 0 |
| B | 0 | 207408 | 0 |
| C | 0 | 199933 | 0 |
| D | 0 | 227847 | 0 |
| Mode M9 | |||
|---|---|---|---|
| Quadrant | BADHDUFLAG | Total packets | Discarded packets |
| A | 0 | 172 | 0 |
| B | 0 | 172 | 0 |
| C | 0 | 172 | 0 |
| D | 0 | 172 | 0 |
| Quadrant | Total seconds | Saturated seconds | Saturation percentage |
|---|---|---|---|
| A | 97484 | 1521 | 1.560256% |
| B | 97481 | 1295 | 1.328464% |
| C | 97488 | 722 | 0.740604% |
| D | 97485 | 2494 | 2.558342% |
Noise dominated data is calculated using 1-second bins in cleaned event files. If a bin has >2000 counts, and if more than 50% of those come from <1% of pixels, then it is considered to be noise-dominated and hence unusable.
| Quadrant | # 1 sec bins | Bins with >0 counts | Bins with >2000 counts | High rate bins dominated by noise | Noise dominated (total time) | Noise dominated (detector-on time) | Marked lightcurve |
|---|---|---|---|---|---|---|---|
| A | 114644 | 97477 | 0 | 0 | 0.00% | 0.00% |  |
| B | 114645 | 97474 | 0 | 0 | 0.00% | 0.00% |  |
| C | 114645 | 97477 | 0 | 0 | 0.00% | 0.00% |  |
| D | 114645 | 97444 | 0 | 0 | 0.00% | 0.00% |  |
Top three noisy pixels from each quadrant. If the there are fewer than three noisy pixels in the level2.evt file, extra rows are filled as -1
| Pixel properties | Quadrant properties | ||||||
|---|---|---|---|---|---|---|---|
| Quadrant | DetID | PixID | Counts | Sigma | Mean | Median | Sigma |
| A | 0 | 29 | 5447 | 11.34 | 1441 | 1345 | 361.8 |
| A | 7 | 110 | 4547 | 8.85 | 1441 | 1345 | 361.8 |
| A | 0 | 30 | 4283 | 8.12 | 1441 | 1345 | 361.8 |
| B | 2 | 9 | 4753 | 12.16 | 1431 | 1362 | 279.0 |
| B | 2 | 8 | 3633 | 8.14 | 1431 | 1362 | 279.0 |
| B | 12 | 226 | 3624 | 8.11 | 1431 | 1362 | 279.0 |
| C | 1 | 80 | 4120 | 7.28 | 1460 | 1354 | 379.9 |
| C | 1 | 81 | 4029 | 7.04 | 1460 | 1354 | 379.9 |
| C | 12 | 241 | 3946 | 6.82 | 1460 | 1354 | 379.9 |
| D | 3 | 14 | 3577 | 6.51 | 1349 | 1226 | 361.0 |
| D | 6 | 231 | 3485 | 6.26 | 1349 | 1226 | 361.0 |
| D | 7 | 5 | 3472 | 6.22 | 1349 | 1226 | 361.0 |
Histogram calculated using DETX and DETY for each event in the final _common_clean file
| Quadrant A | 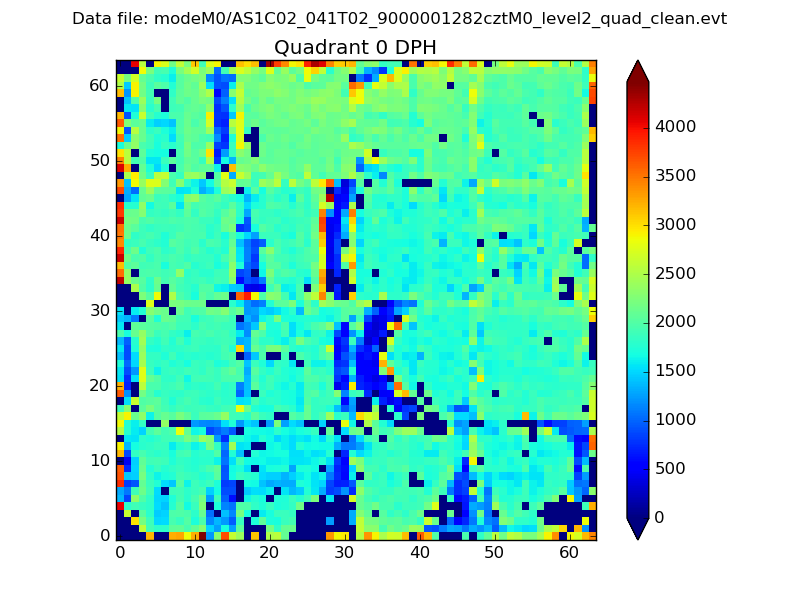 |
 |
Quadrant B |
|---|---|---|---|
| Quadrant D |  |
 |
Quadrant C |
| Plot type | Count rate plots | Images |
|---|---|---|
| Comparison with Poisson distribution Blue bars denote a histogram of data divided into 1 sec bins. Red curve is a Poisson curve with rate = median count rate of data. |
 |
 |
| Quadrant-wise count rates Data is divided into 100 sec bins |
 |
|
| Module-wise count rates for Quadrant A Data is divided into 100 sec bins |
 |
 |
| Module-wise count rates for Quadrant B Data is divided into 100 sec bins |
 |
 |
| Module-wise count rates for Quadrant C Data is divided into 100 sec bins |
 |
 |
| Module-wise count rates for Quadrant D Data is divided into 100 sec bins |
 |
 |
| Parameter | Plot |
|---|---|
| CZT HV Monitor |  |
| D_VDD |  |
| Temperature 1 |  |
| Veto HV Monitor |  |
| Veto LLD |  |
| Alpha Counter |  |
| _CPM_Rate |  |
| CZT Counter |  |
| +2.5 Volts monitor |  |
| +5 Volts monitor |  |
| _ROLL_ROT |  |
| _Roll_DEC |  |
| _Roll_RA |  |
| Veto Counter |  |