| Param | Original file | Final file |
|---|---|---|
| Filename | modeM0/AS1C02_041T02_9000001282_09173cztM0_level2.evt | modeM0/AS1C02_041T02_9000001282_09173cztM0_level2_quad_clean.evt |
| Size (bytes) | 280,509,120 | 39,640,320 |
| Size | 267.5 MB | 37.8 MB |
| Events in quadrant A | 2,254,428 | 236,605 |
| Events in quadrant B | 1,991,191 | 241,684 |
| Events in quadrant C | 1,786,639 | 235,072 |
| Events in quadrant D | 2,201,270 | 215,671 |
| Mode SS | |||
|---|---|---|---|
| Quadrant | BADHDUFLAG | Total packets | Discarded packets |
| A | 0 | 78 | 0 |
| B | 0 | 78 | 0 |
| C | 0 | 78 | 0 |
| D | 0 | 78 | 0 |
| Mode M0 | |||
|---|---|---|---|
| Quadrant | BADHDUFLAG | Total packets | Discarded packets |
| A | 0 | 9234 | 2 |
| B | 0 | 8388 | 3 |
| C | 0 | 7809 | 1 |
| D | 0 | 9207 | 1 |
| Mode M9 | |||
|---|---|---|---|
| Quadrant | BADHDUFLAG | Total packets | Discarded packets |
| A | 0 | 11 | 0 |
| B | 0 | 11 | 0 |
| C | 0 | 11 | 0 |
| D | 0 | 11 | 0 |
| Quadrant | Total seconds | Saturated seconds | Saturation percentage |
|---|---|---|---|
| A | 3833 | 62 | 1.617532% |
| B | 3832 | 36 | 0.939457% |
| C | 3833 | 18 | 0.469606% |
| D | 3833 | 159 | 4.148187% |
Noise dominated data is calculated using 1-second bins in cleaned event files. If a bin has >2000 counts, and if more than 50% of those come from <1% of pixels, then it is considered to be noise-dominated and hence unusable.
| Quadrant | # 1 sec bins | Bins with >0 counts | Bins with >2000 counts | High rate bins dominated by noise | Noise dominated (total time) | Noise dominated (detector-on time) | Marked lightcurve |
|---|---|---|---|---|---|---|---|
| A | 4928 | 3834 | 28 | 28 | 0.57% | 0.73% | 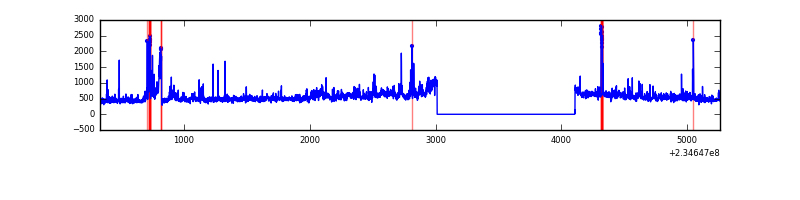 |
| B | 4928 | 3834 | 1 | 1 | 0.02% | 0.03% | 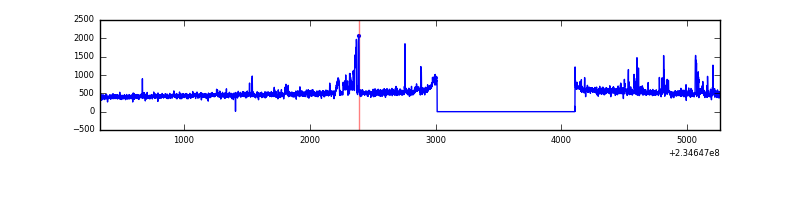 |
| C | 4928 | 3834 | 0 | 0 | 0.00% | 0.00% | 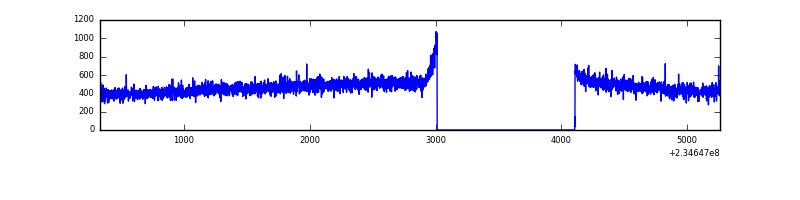 |
| D | 4928 | 3834 | 133 | 133 | 2.70% | 3.47% | 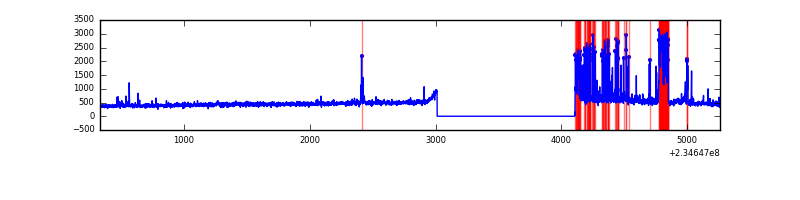 |
Top three noisy pixels from each quadrant. If the there are fewer than three noisy pixels in the level2.evt file, extra rows are filled as -1
| Pixel properties | Quadrant properties | ||||||
|---|---|---|---|---|---|---|---|
| Quadrant | DetID | PixID | Counts | Sigma | Mean | Median | Sigma |
| A | 8 | 5 | 282712 | 2959.13 | 465 | 456 | 95.4 |
| A | 15 | 174 | 79787 | 831.69 | 465 | 456 | 95.4 |
| A | 5 | 16 | 36472 | 377.59 | 465 | 456 | 95.4 |
| B | 8 | 234 | 78110 | 845.21 | 471 | 460 | 91.9 |
| B | 0 | 230 | 21752 | 231.76 | 471 | 460 | 91.9 |
| B | 0 | 229 | 13291 | 139.66 | 471 | 460 | 91.9 |
| C | 8 | 128 | 6496 | 56.7 | 454 | 456 | 106.5 |
| C | 13 | 61 | 3580 | 29.32 | 454 | 456 | 106.5 |
| C | 8 | 112 | 3261 | 26.33 | 454 | 456 | 106.5 |
| D | 13 | 104 | 386607 | 3527.37 | 440 | 428 | 109.5 |
| D | 12 | 233 | 73023 | 663.09 | 440 | 428 | 109.5 |
| D | 2 | 14 | 36009 | 325.0 | 440 | 428 | 109.5 |
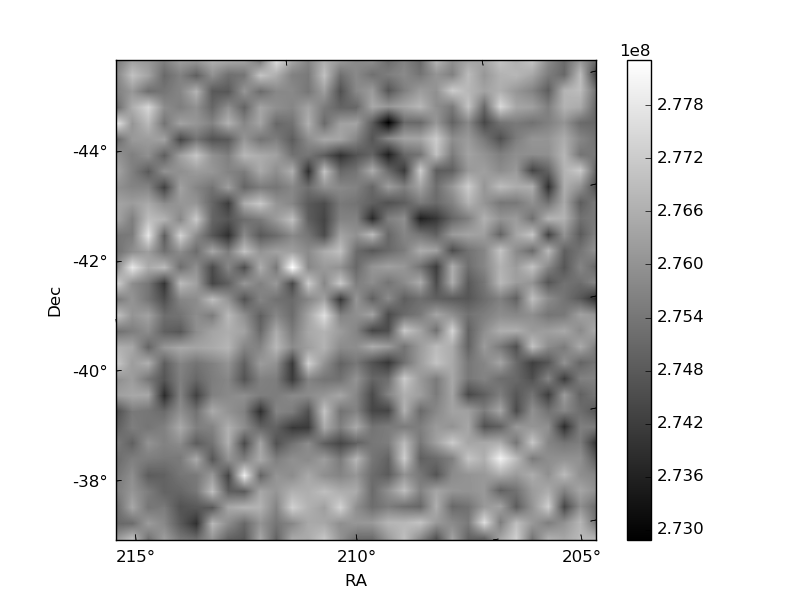
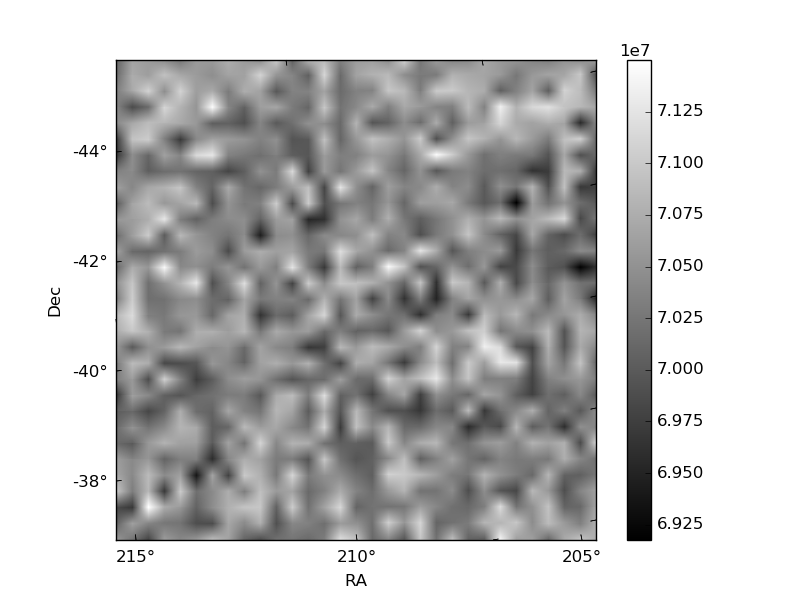
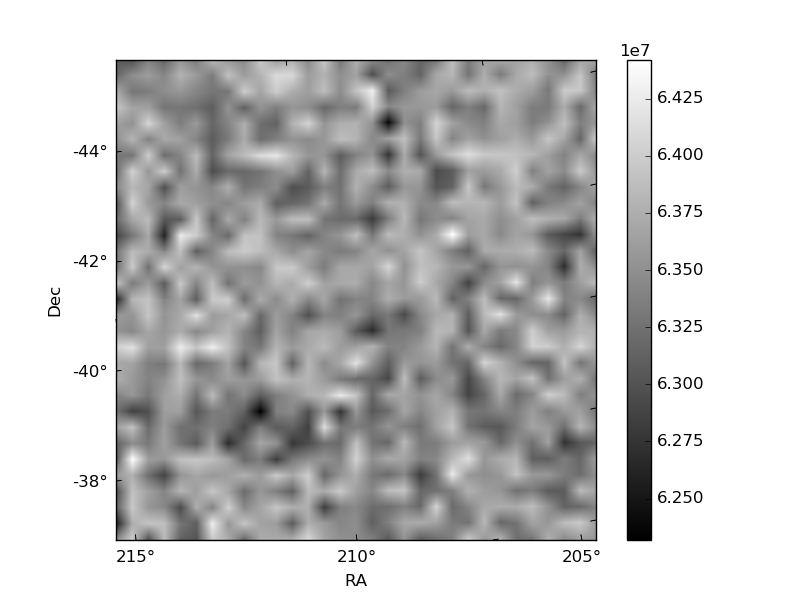
Histogram calculated using DETX and DETY for each event in the final _common_clean file
| Quadrant A | 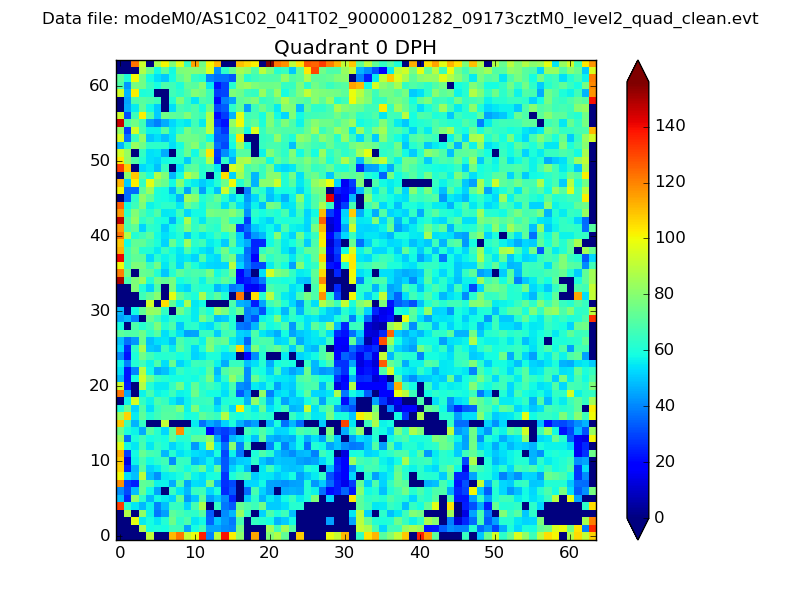 |
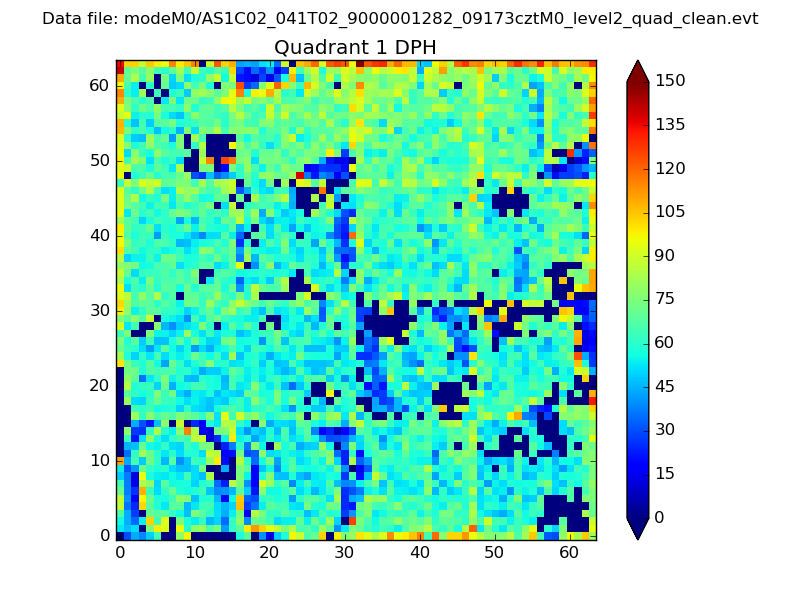 |
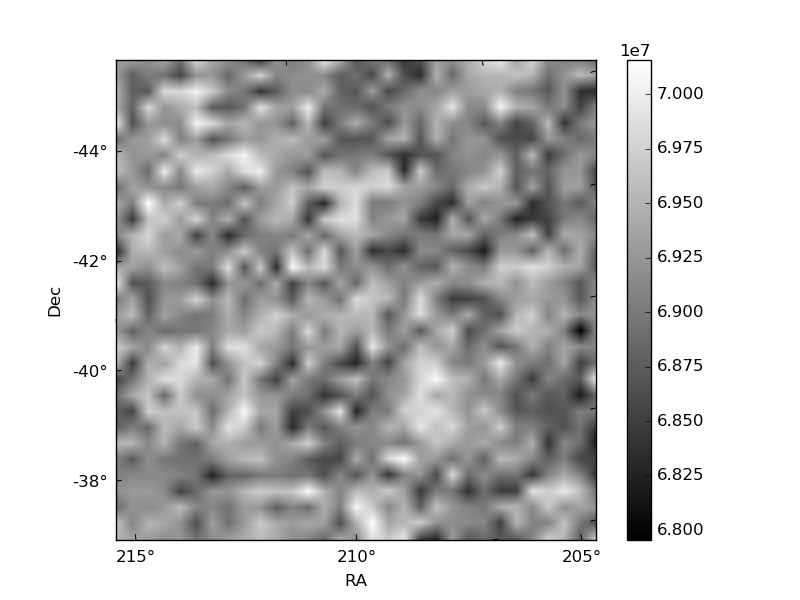
Quadrant B |
|---|---|---|---|
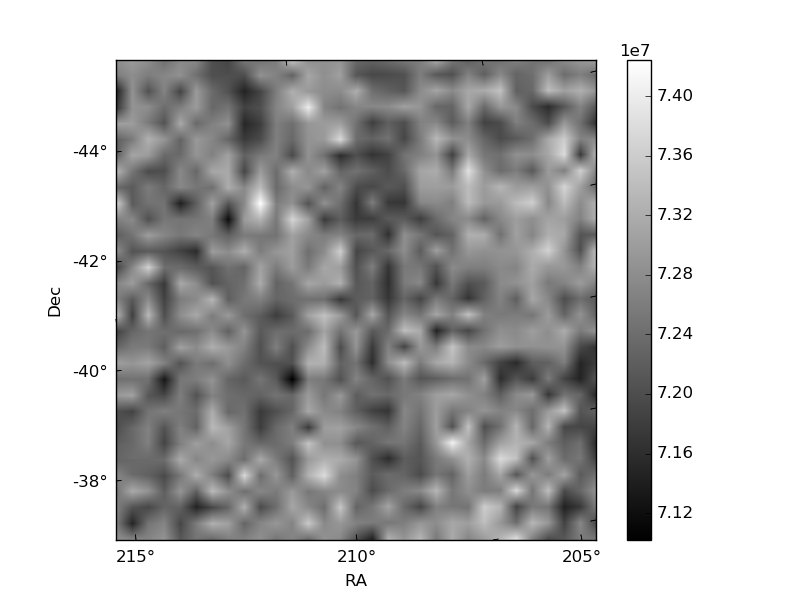
| Quadrant D | 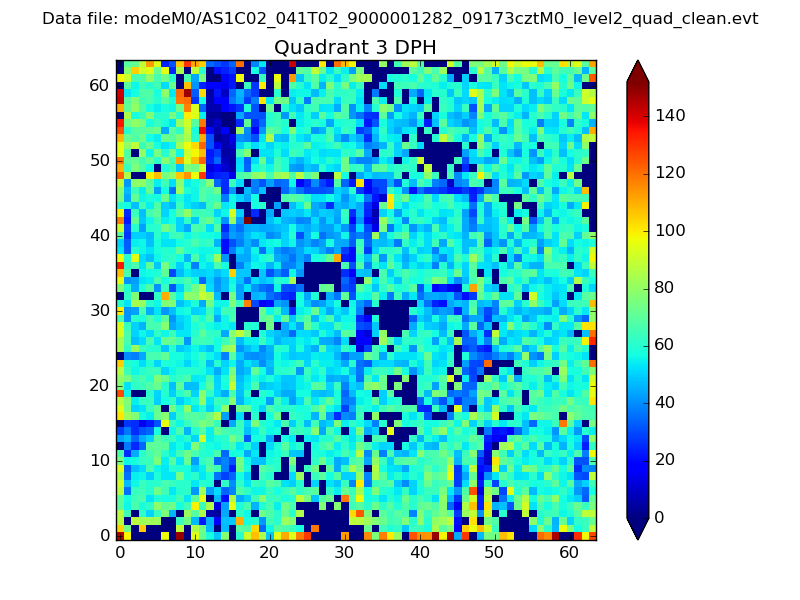 |
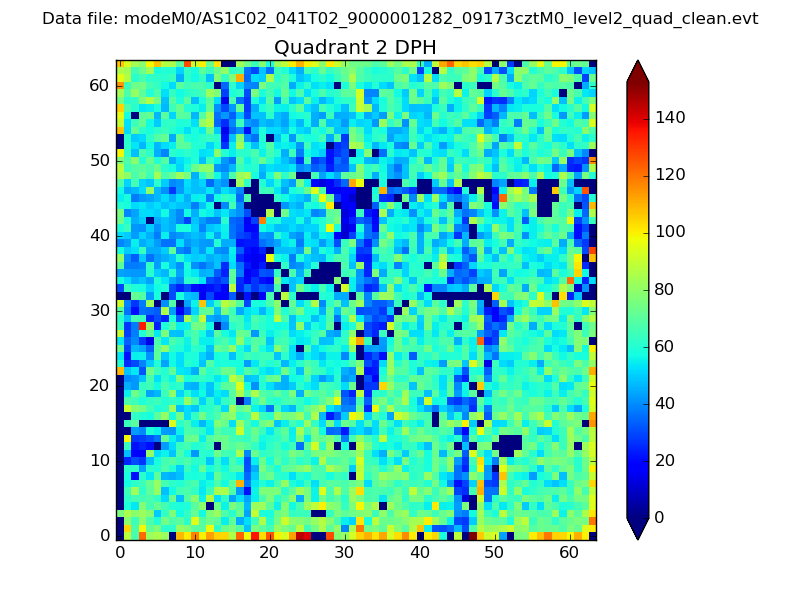 |
Quadrant C |
| Plot type | Count rate plots | Images |
|---|---|---|
| Comparison with Poisson distribution Blue bars denote a histogram of data divided into 1 sec bins. Red curve is a Poisson curve with rate = median count rate of data. |
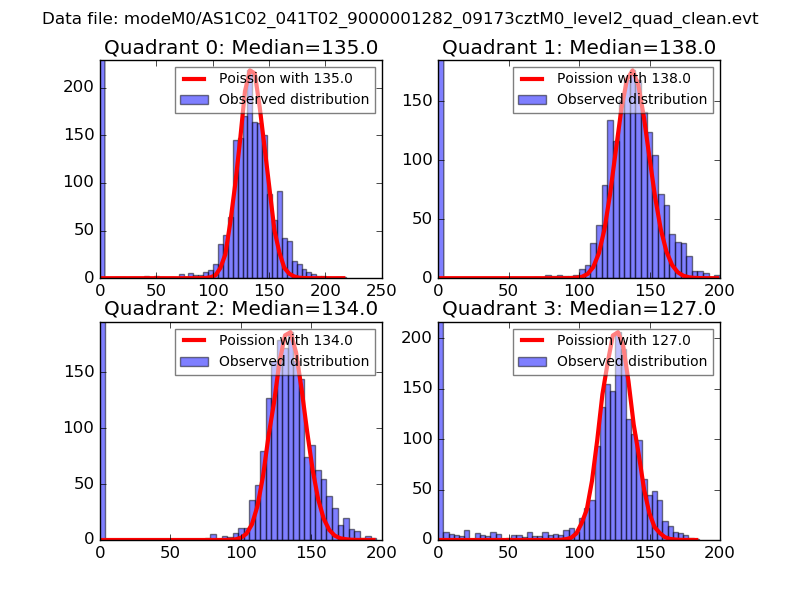 |
 |
| Quadrant-wise count rates Data is divided into 100 sec bins |
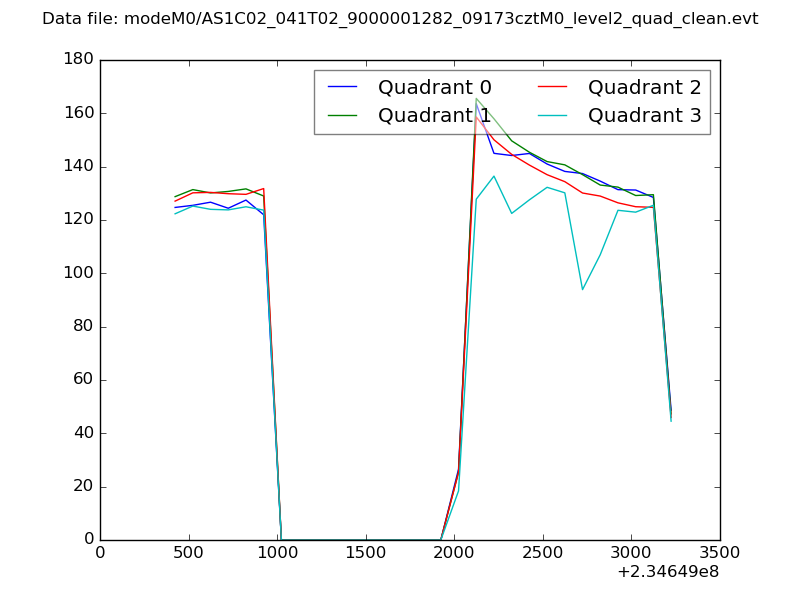 |
|
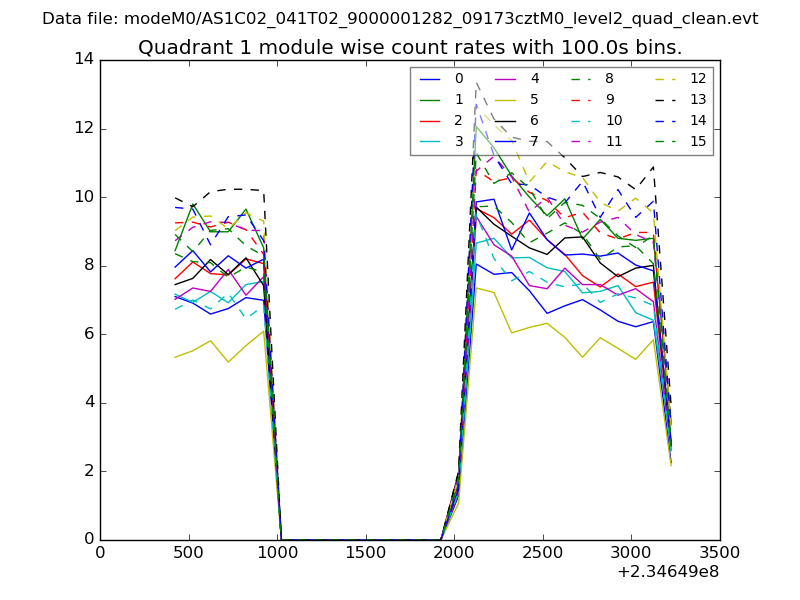
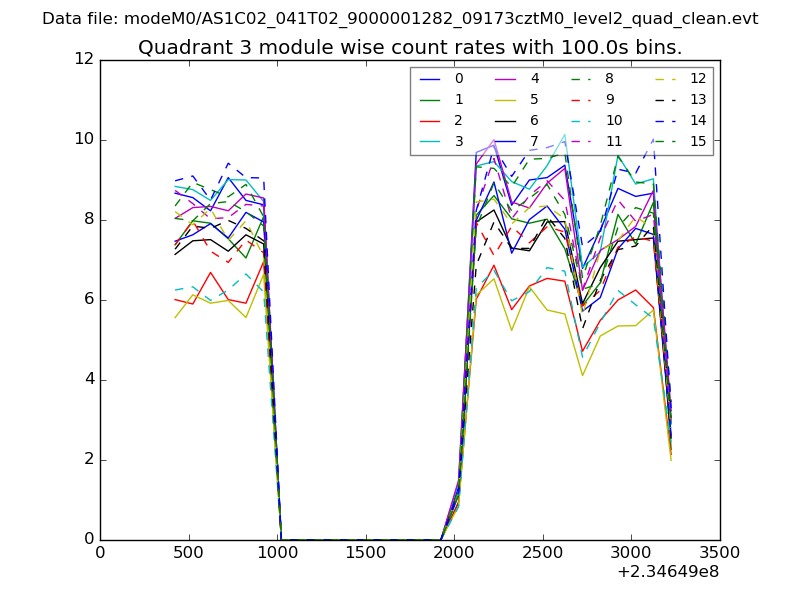
| Module-wise count rates for Quadrant A Data is divided into 100 sec bins |
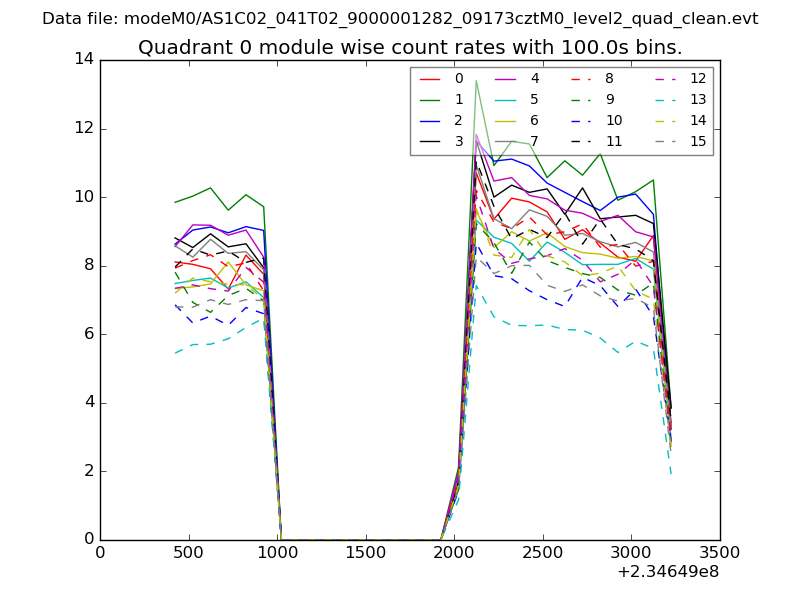 |
 |
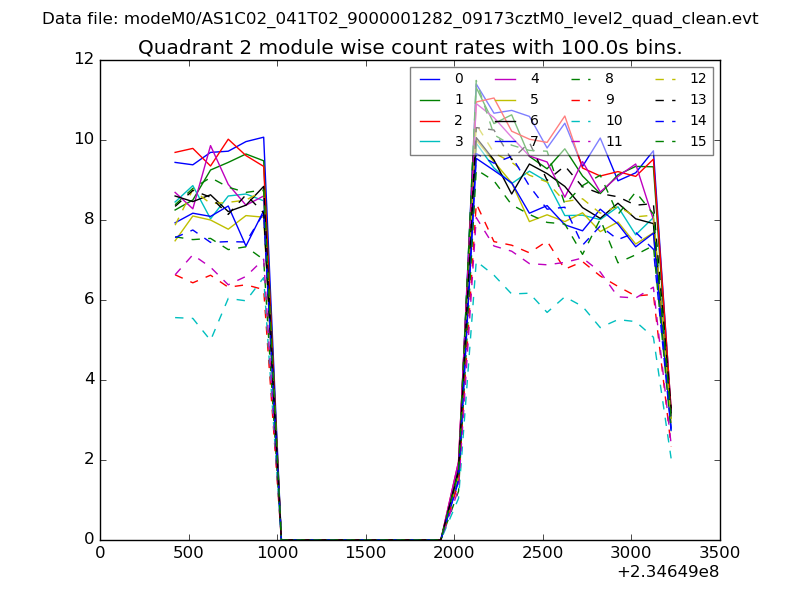
| Module-wise count rates for Quadrant B Data is divided into 100 sec bins |
 |
 |
| Module-wise count rates for Quadrant C Data is divided into 100 sec bins |
 |
 |
| Module-wise count rates for Quadrant D Data is divided into 100 sec bins |
 |
 |
| Parameter | Plot |
|---|---|
| CZT HV Monitor | 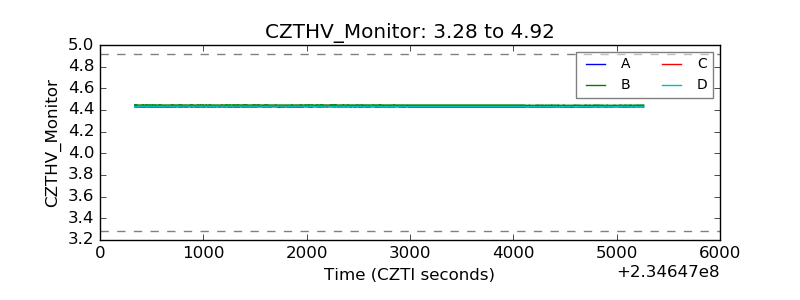 |
| D_VDD | 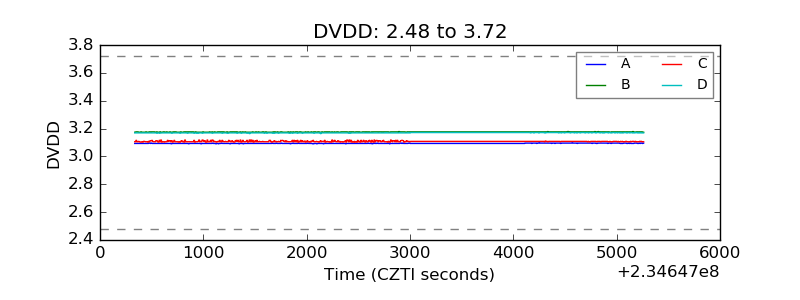 |
| Temperature 1 | 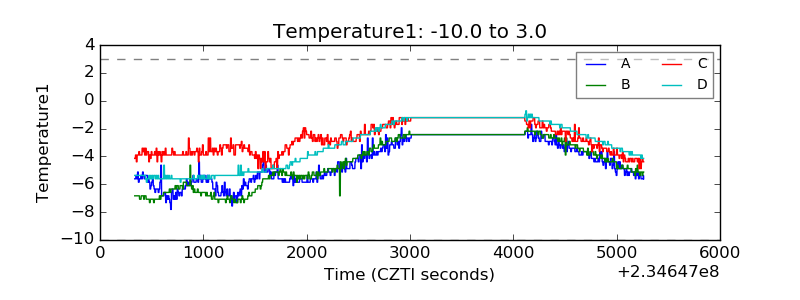 |
| Veto HV Monitor | 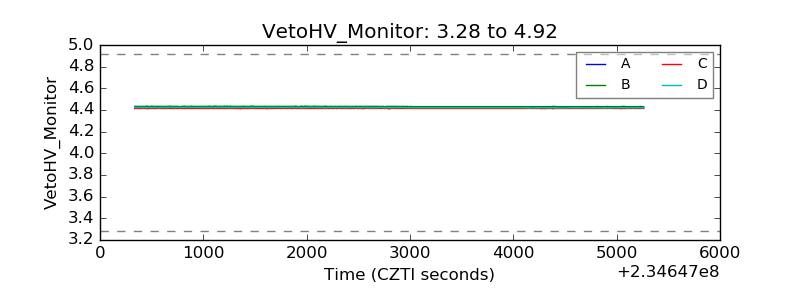 |
| Veto LLD | 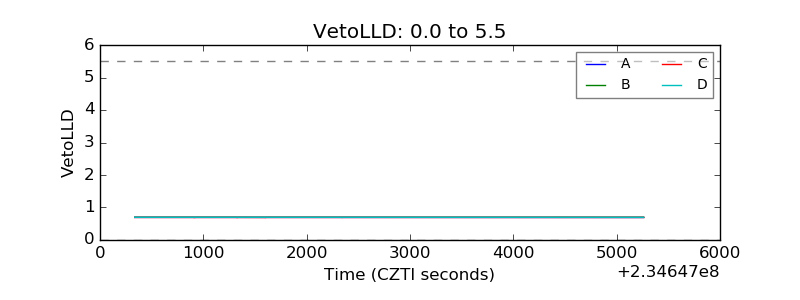 |
| Alpha Counter | 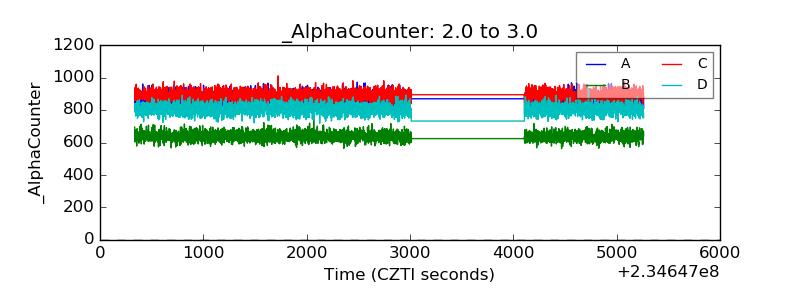 |
| _CPM_Rate | 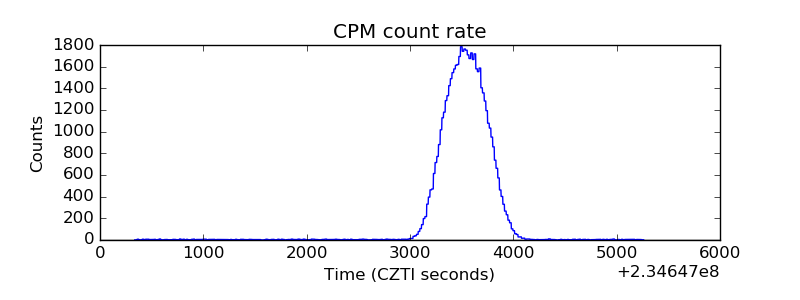 |
| CZT Counter | 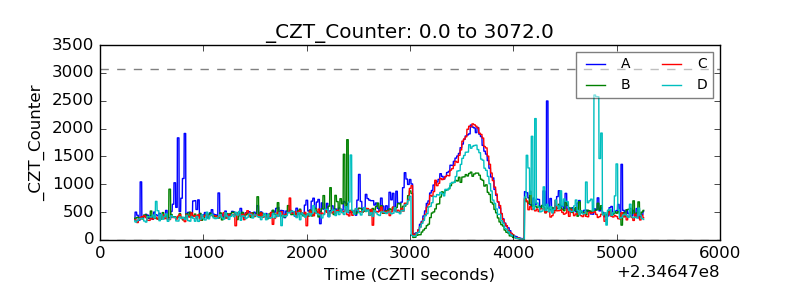 |
| +2.5 Volts monitor |  |
| +5 Volts monitor |  |
| _ROLL_ROT | 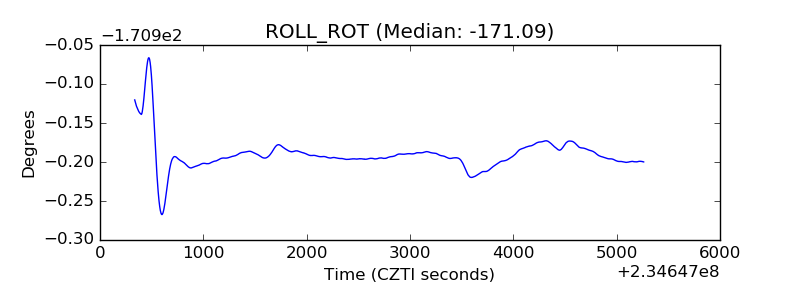 |
| _Roll_DEC | 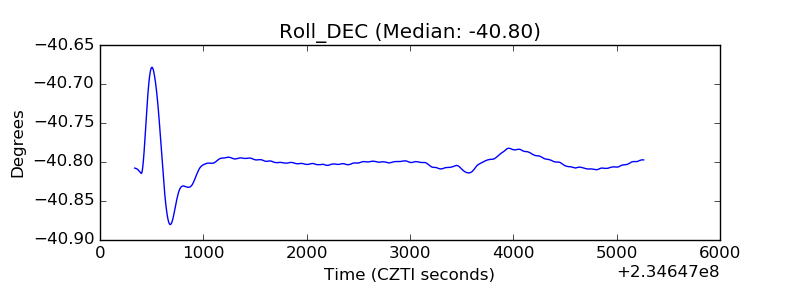 |
| _Roll_RA | 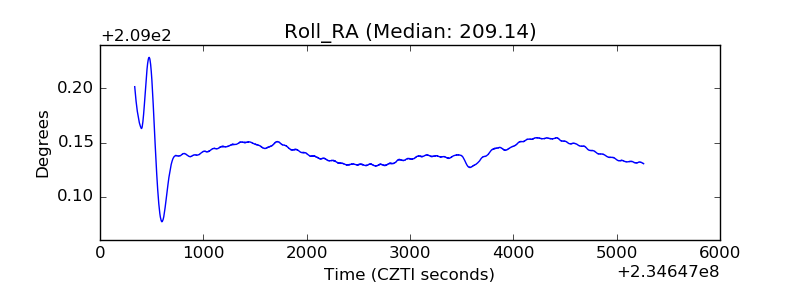 |
| Veto Counter | 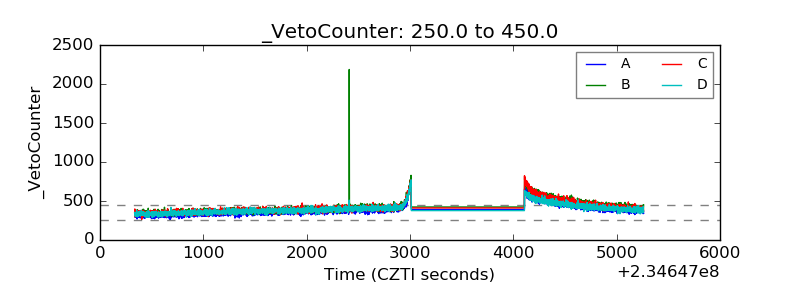 |