| Param | Original file | Final file |
|---|---|---|
| Filename | modeM0/AS1C02_041T02_9000001282_09174cztM0_level2.evt | modeM0/AS1C02_041T02_9000001282_09174cztM0_level2_quad_clean.evt |
| Size (bytes) | 474,050,880 | 88,974,720 |
| Size | 452.1 MB | 84.9 MB |
| Events in quadrant A | 3,599,002 | 573,088 |
| Events in quadrant B | 3,263,742 | 584,612 |
| Events in quadrant C | 2,909,918 | 565,793 |
| Events in quadrant D | 4,151,992 | 526,948 |
| Mode SS | |||
|---|---|---|---|
| Quadrant | BADHDUFLAG | Total packets | Discarded packets |
| A | 0 | 132 | 0 |
| B | 0 | 132 | 0 |
| C | 0 | 132 | 0 |
| D | 0 | 132 | 0 |
| Mode M0 | |||
|---|---|---|---|
| Quadrant | BADHDUFLAG | Total packets | Discarded packets |
| A | 0 | 14962 | 3 |
| B | 0 | 13908 | 6 |
| C | 0 | 12999 | 2 |
| D | 0 | 16702 | 2 |
| Mode M9 | |||
|---|---|---|---|
| Quadrant | BADHDUFLAG | Total packets | Discarded packets |
| A | 0 | 23 | 0 |
| B | 0 | 23 | 0 |
| C | 0 | 23 | 0 |
| D | 0 | 23 | 0 |
| Quadrant | Total seconds | Saturated seconds | Saturation percentage |
|---|---|---|---|
| A | 6360 | 74 | 1.163522% |
| B | 6358 | 49 | 0.770683% |
| C | 6360 | 21 | 0.330189% |
| D | 6360 | 275 | 4.323899% |
Noise dominated data is calculated using 1-second bins in cleaned event files. If a bin has >2000 counts, and if more than 50% of those come from <1% of pixels, then it is considered to be noise-dominated and hence unusable.
| Quadrant | # 1 sec bins | Bins with >0 counts | Bins with >2000 counts | High rate bins dominated by noise | Noise dominated (total time) | Noise dominated (detector-on time) | Marked lightcurve |
|---|---|---|---|---|---|---|---|
| A | 8680 | 6362 | 27 | 27 | 0.31% | 0.42% | 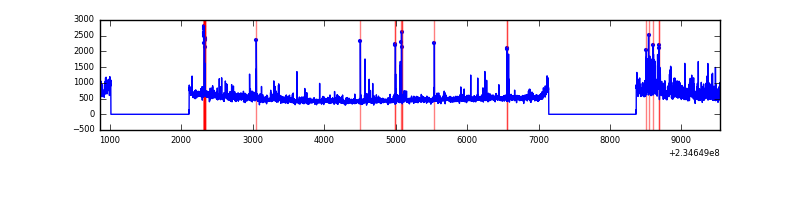 |
| B | 8680 | 6362 | 0 | 0 | 0.00% | 0.00% | 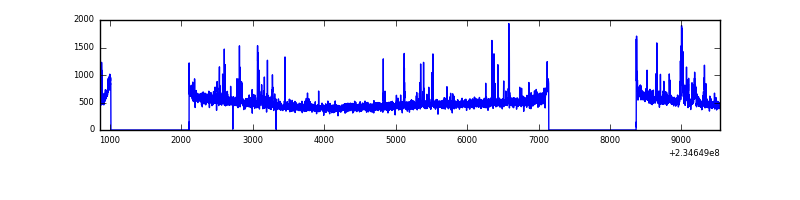 |
| C | 8680 | 6362 | 0 | 0 | 0.00% | 0.00% | 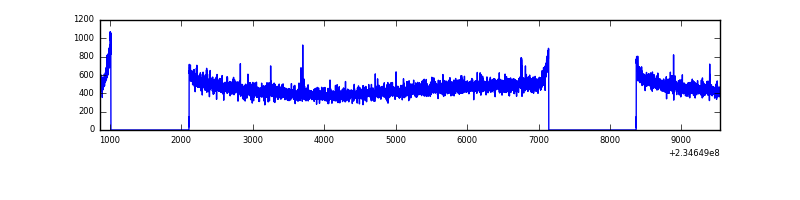 |
| D | 8680 | 6362 | 251 | 251 | 2.89% | 3.95% | 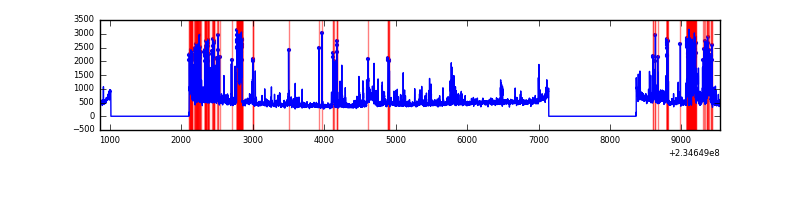 |
Top three noisy pixels from each quadrant. If the there are fewer than three noisy pixels in the level2.evt file, extra rows are filled as -1
| Pixel properties | Quadrant properties | ||||||
|---|---|---|---|---|---|---|---|
| Quadrant | DetID | PixID | Counts | Sigma | Mean | Median | Sigma |
| A | 8 | 5 | 512462 | 3260.07 | 771 | 755 | 157.0 |
| A | 5 | 16 | 48007 | 301.04 | 771 | 755 | 157.0 |
| A | 1 | 162 | 32903 | 204.81 | 771 | 755 | 157.0 |
| B | 0 | 230 | 59375 | 394.31 | 780 | 761 | 148.6 |
| B | 8 | 234 | 42208 | 278.83 | 780 | 761 | 148.6 |
| B | 0 | 229 | 28004 | 183.27 | 780 | 761 | 148.6 |
| C | 1 | 3 | 5957 | 30.18 | 743 | 748 | 172.6 |
| C | 13 | 61 | 5856 | 29.6 | 743 | 748 | 172.6 |
| C | 8 | 222 | 2861 | 12.24 | 743 | 748 | 172.6 |
| D | 1 | 52 | 497832 | 2651.54 | 721 | 704 | 187.5 |
| D | 13 | 104 | 439051 | 2338.02 | 721 | 704 | 187.5 |
| D | 12 | 233 | 280194 | 1490.72 | 721 | 704 | 187.5 |
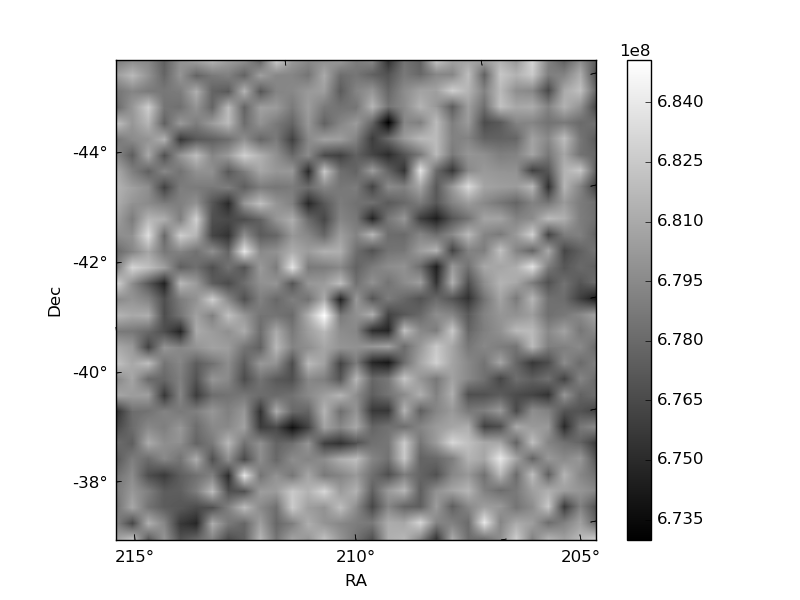
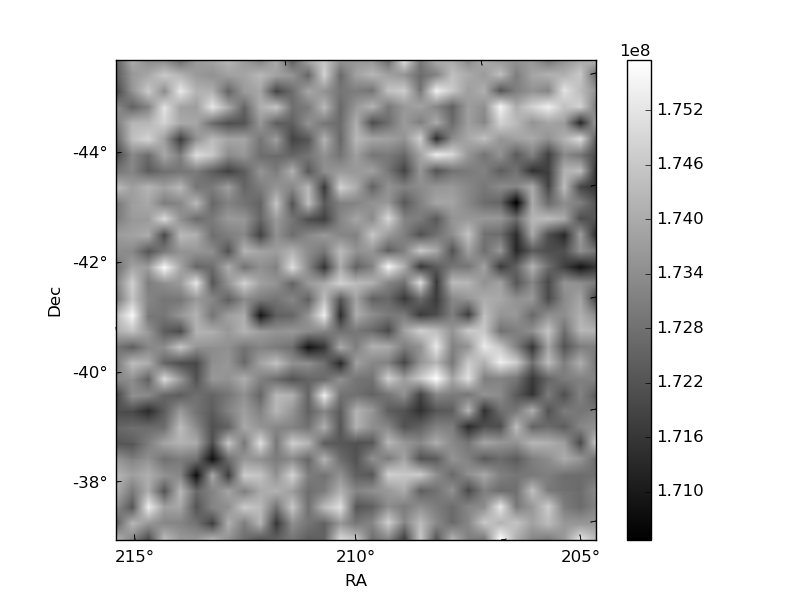
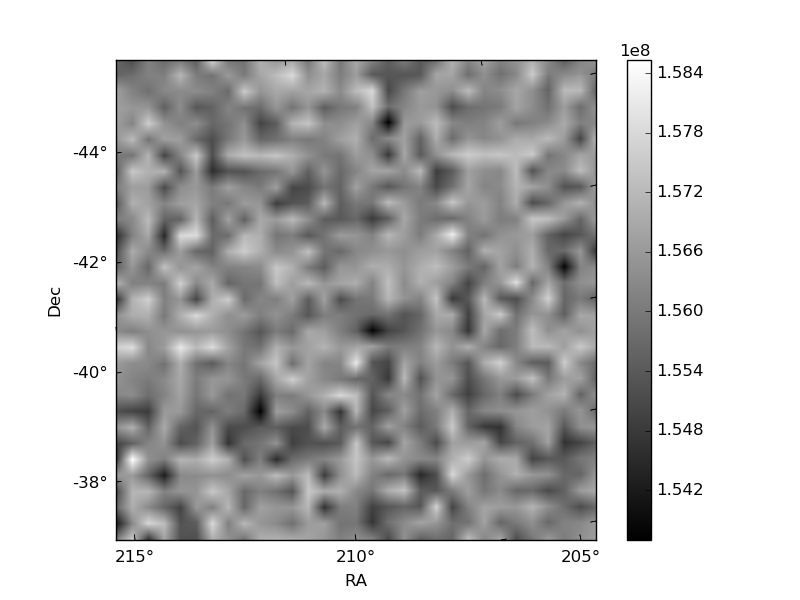
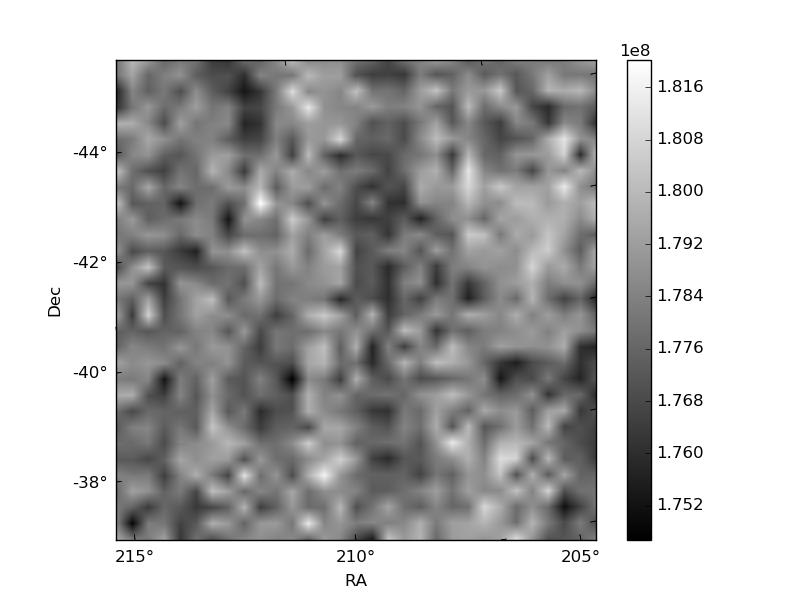
Histogram calculated using DETX and DETY for each event in the final _common_clean file
| Quadrant A | 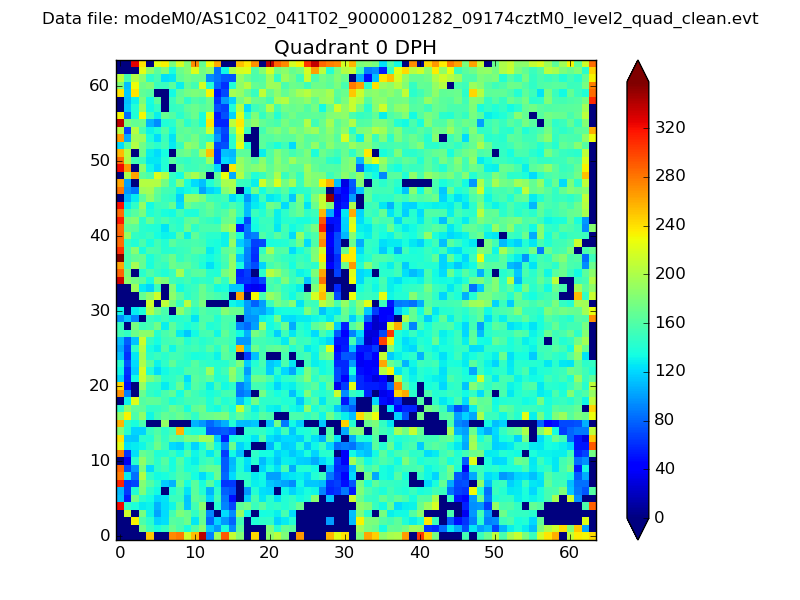 |
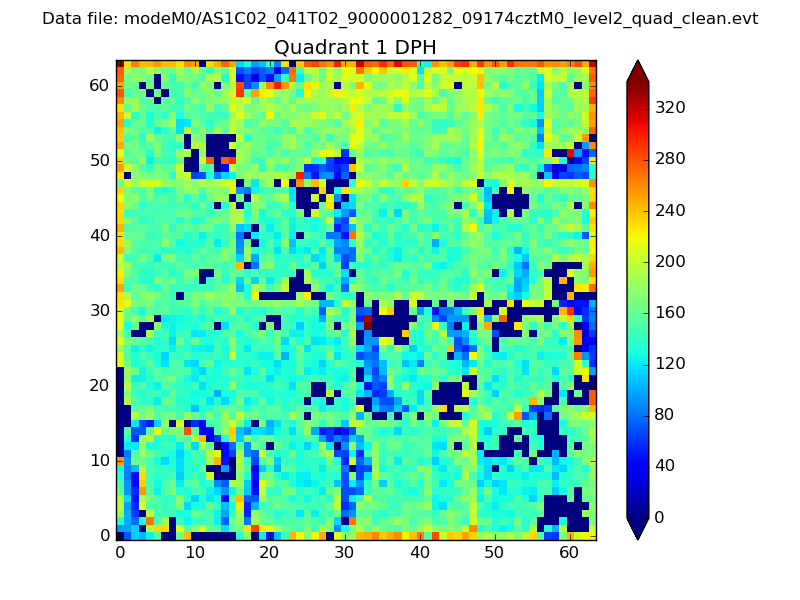 |
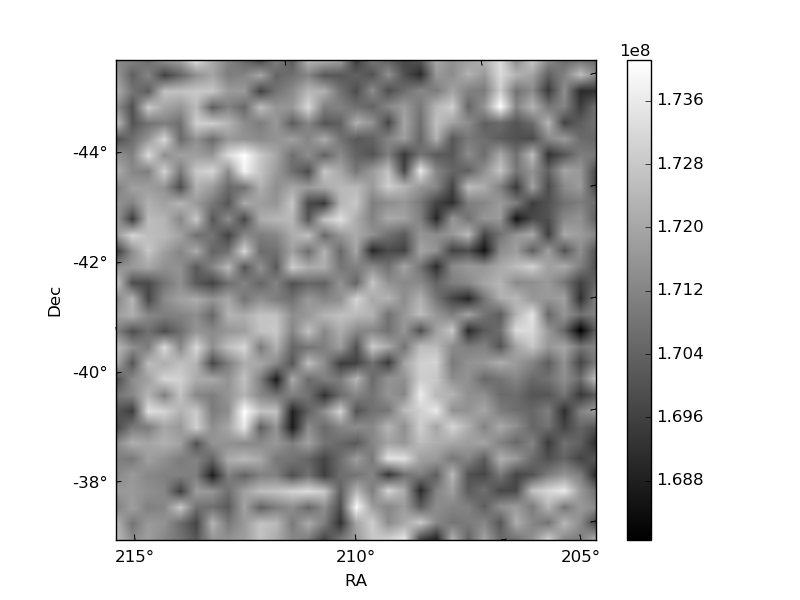
Quadrant B |
|---|---|---|---|
| Quadrant D | 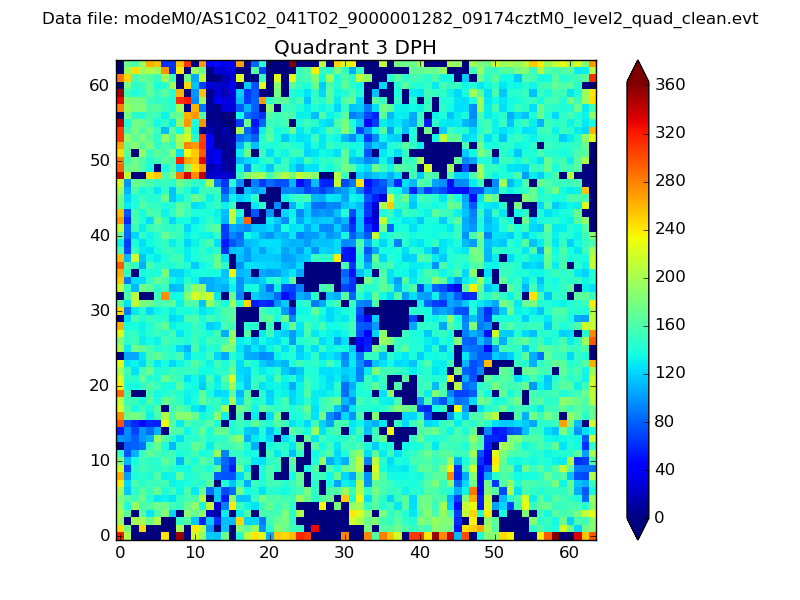 |
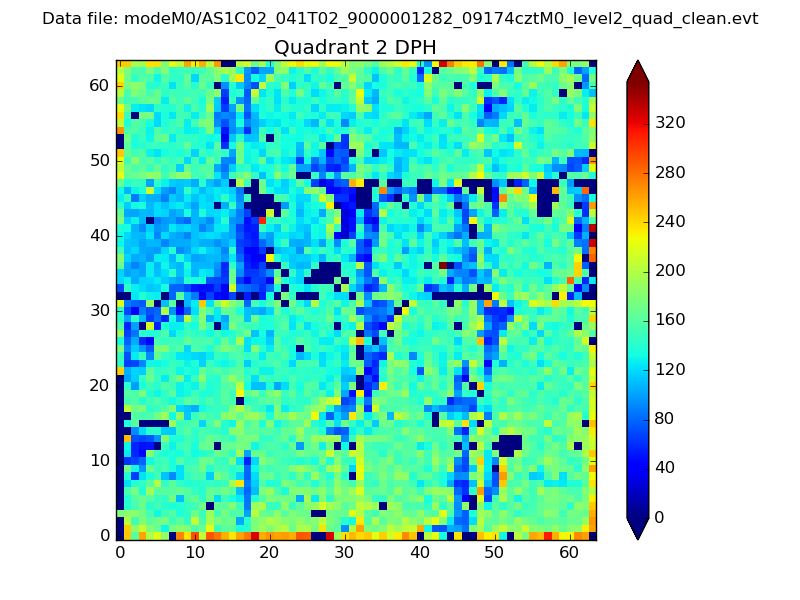 |
Quadrant C |
| Plot type | Count rate plots | Images |
|---|---|---|
| Comparison with Poisson distribution Blue bars denote a histogram of data divided into 1 sec bins. Red curve is a Poisson curve with rate = median count rate of data. |
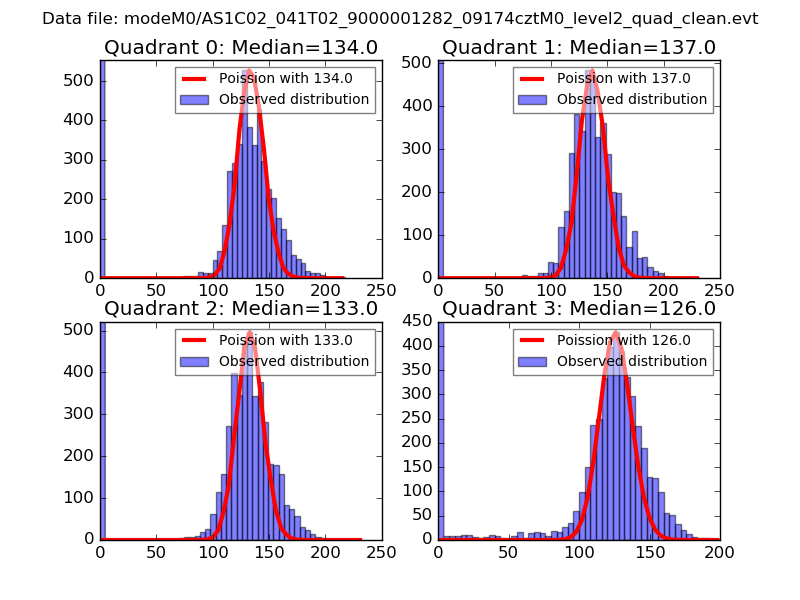 |
 |
| Quadrant-wise count rates Data is divided into 100 sec bins |
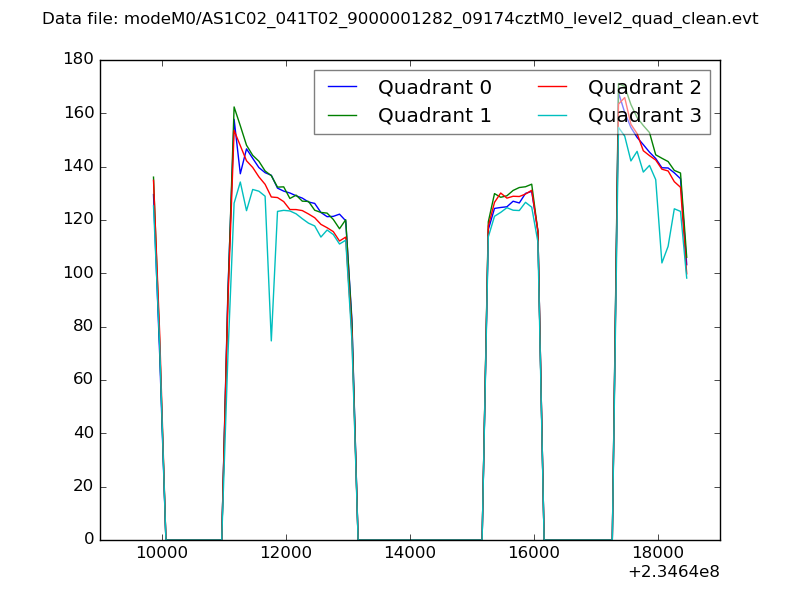 |
|
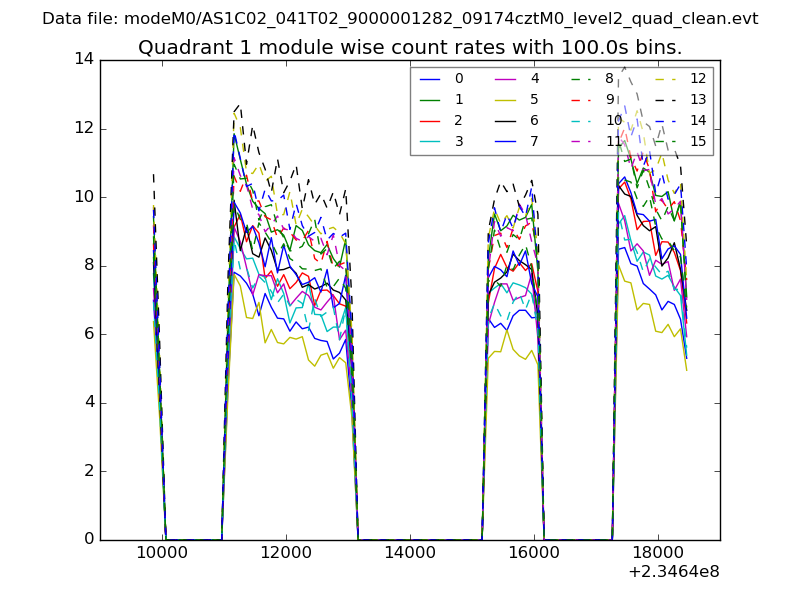
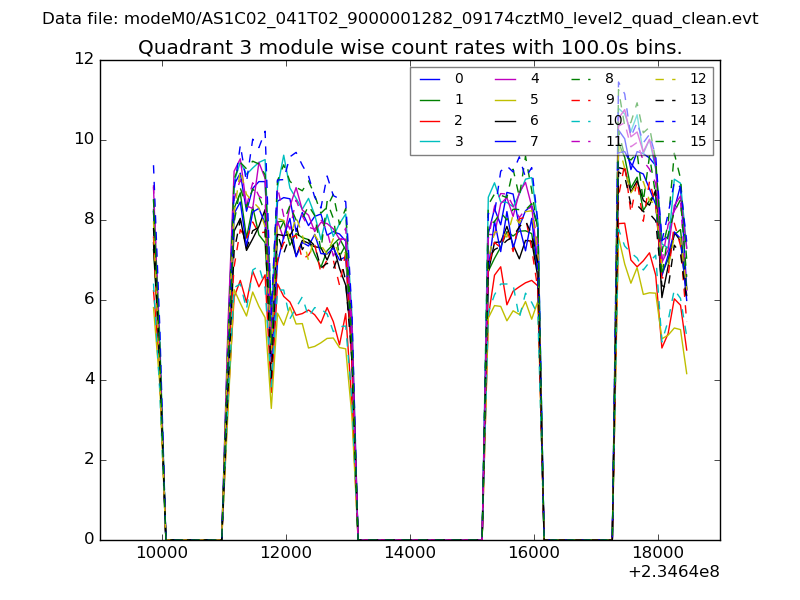
| Module-wise count rates for Quadrant A Data is divided into 100 sec bins |
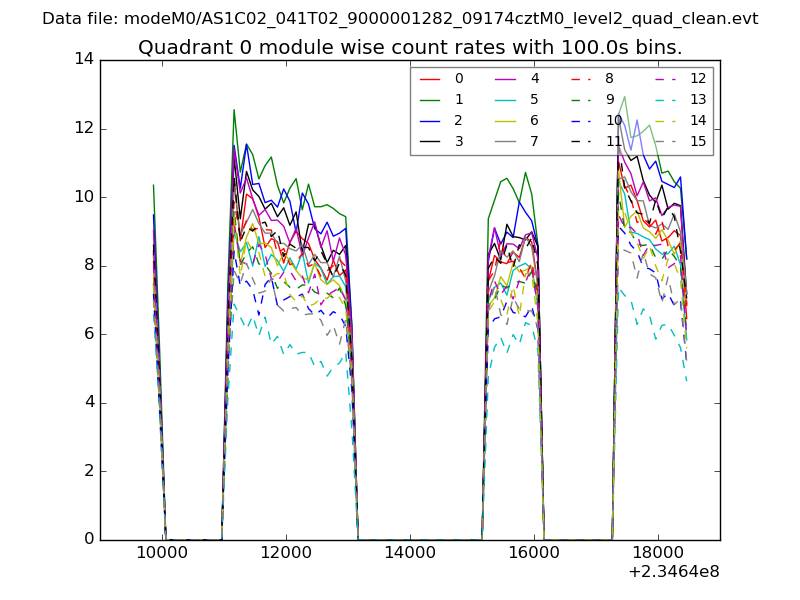 |
 |
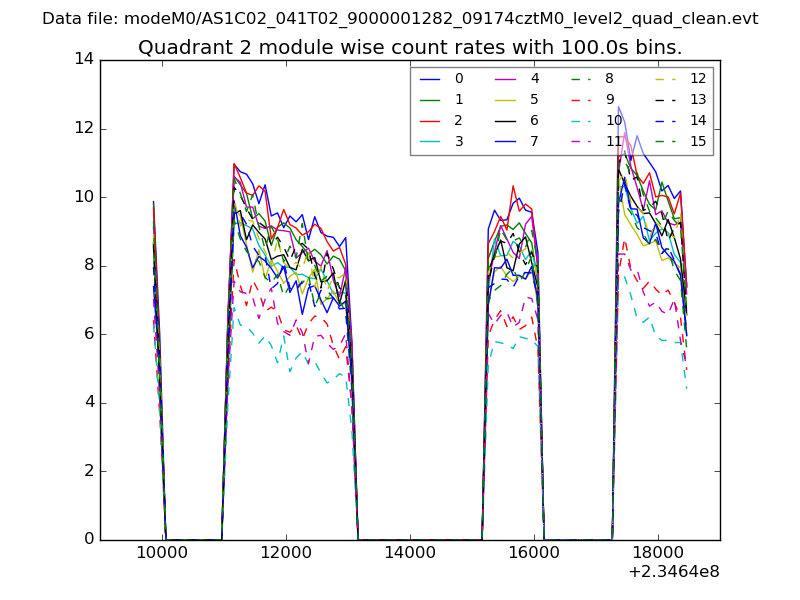
| Module-wise count rates for Quadrant B Data is divided into 100 sec bins |
 |
 |
| Module-wise count rates for Quadrant C Data is divided into 100 sec bins |
 |
 |
| Module-wise count rates for Quadrant D Data is divided into 100 sec bins |
 |
 |
| Parameter | Plot |
|---|---|
| CZT HV Monitor | 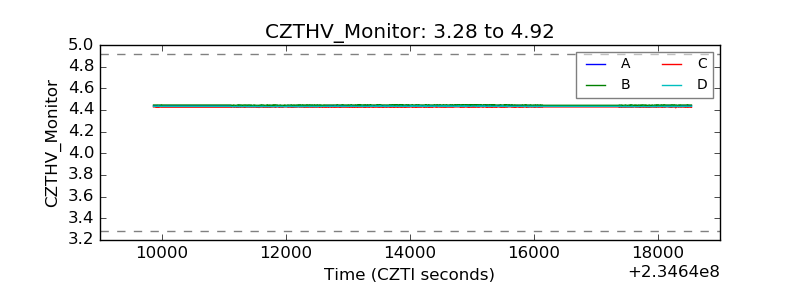 |
| D_VDD | 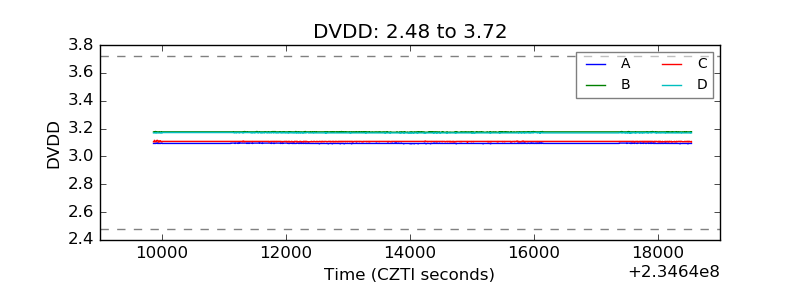 |
| Temperature 1 | 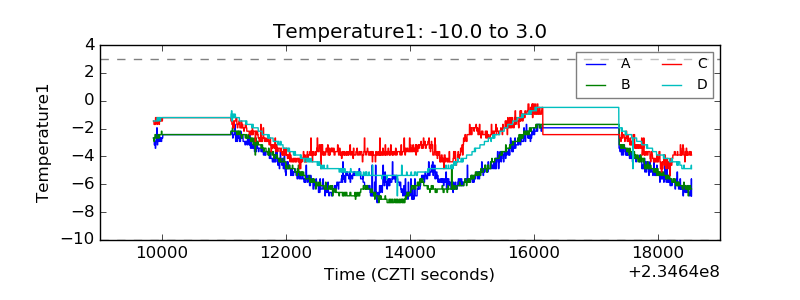 |
| Veto HV Monitor | 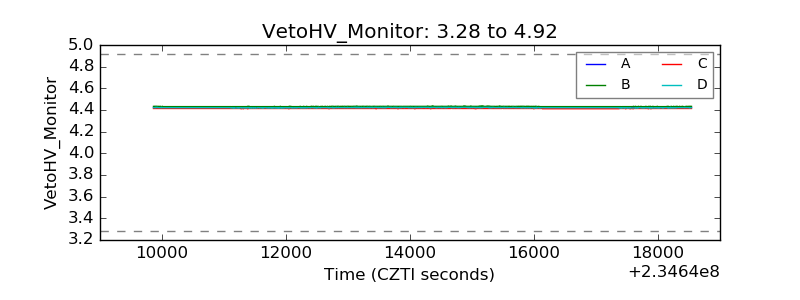 |
| Veto LLD |  |
| Alpha Counter | 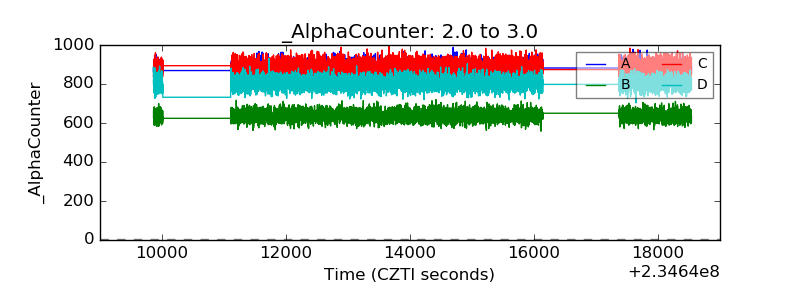 |
| _CPM_Rate | 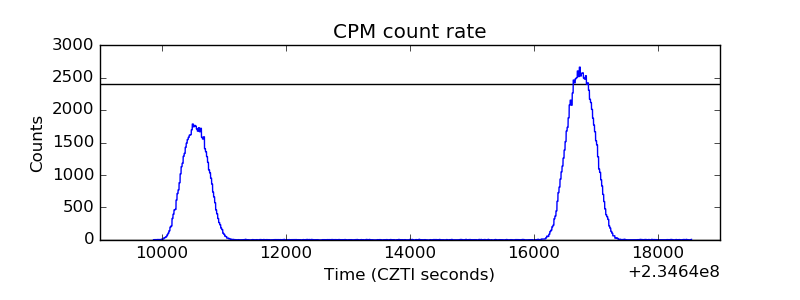 |
| CZT Counter | 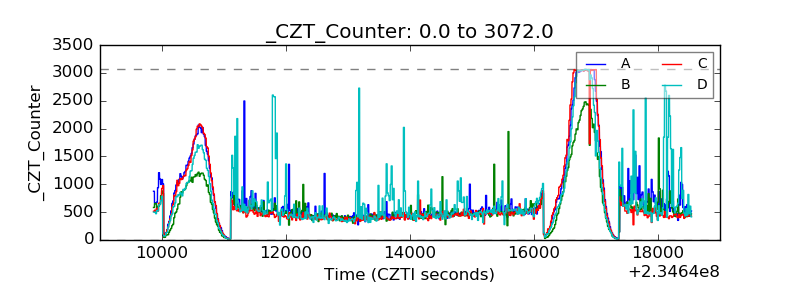 |
| +2.5 Volts monitor |  |
| +5 Volts monitor |  |
| _ROLL_ROT | 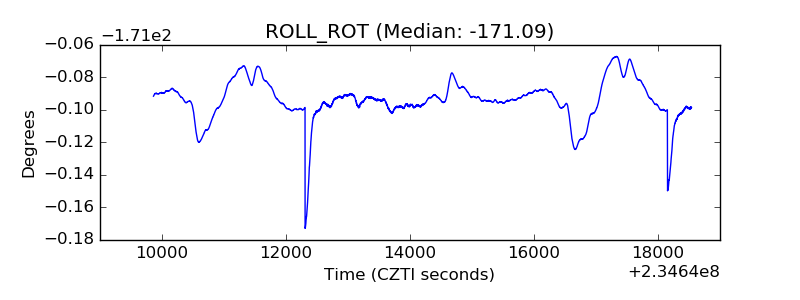 |
| _Roll_DEC | 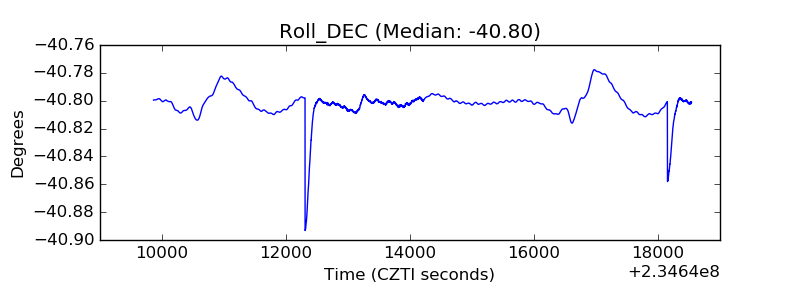 |
| _Roll_RA | 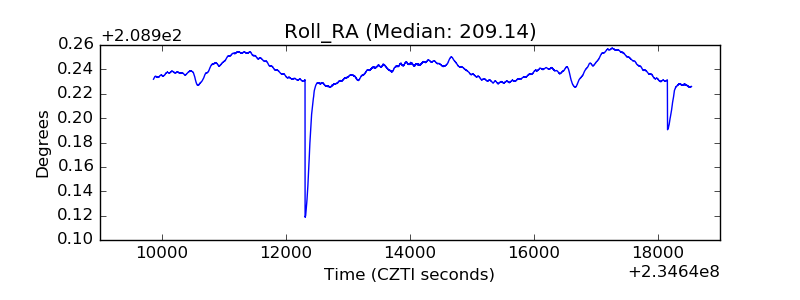 |
| Veto Counter | 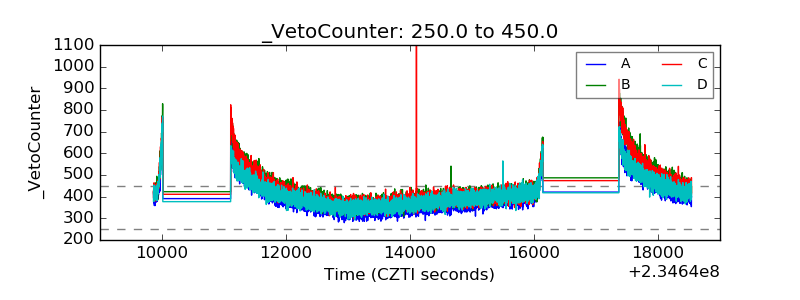 |