| Param | Original file | Final file |
|---|---|---|
| Filename | modeM0/AS1C02_041T02_9000001282_09177cztM0_level2.evt | modeM0/AS1C02_041T02_9000001282_09177cztM0_level2_quad_clean.evt |
| Size (bytes) | 472,835,520 | 73,725,120 |
| Size | 450.9 MB | 70.3 MB |
| Events in quadrant A | 3,374,563 | 451,837 |
| Events in quadrant B | 3,239,484 | 462,026 |
| Events in quadrant C | 3,115,271 | 452,370 |
| Events in quadrant D | 4,160,956 | 424,457 |
| Mode SS | |||
|---|---|---|---|
| Quadrant | BADHDUFLAG | Total packets | Discarded packets |
| A | 0 | 130 | 0 |
| B | 0 | 130 | 0 |
| C | 0 | 130 | 0 |
| D | 0 | 130 | 0 |
| Mode M0 | |||
|---|---|---|---|
| Quadrant | BADHDUFLAG | Total packets | Discarded packets |
| A | 0 | 13768 | 3 |
| B | 0 | 13490 | 2 |
| C | 0 | 13111 | 2 |
| D | 0 | 16565 | 2 |
| Mode M9 | |||
|---|---|---|---|
| Quadrant | BADHDUFLAG | Total packets | Discarded packets |
| A | 0 | 21 | 0 |
| B | 0 | 21 | 0 |
| C | 0 | 21 | 0 |
| D | 0 | 22 | 0 |
| Quadrant | Total seconds | Saturated seconds | Saturation percentage |
|---|---|---|---|
| A | 6322 | 36 | 0.569440% |
| B | 6322 | 57 | 0.901613% |
| C | 6322 | 21 | 0.332173% |
| D | 6322 | 273 | 4.318254% |
Noise dominated data is calculated using 1-second bins in cleaned event files. If a bin has >2000 counts, and if more than 50% of those come from <1% of pixels, then it is considered to be noise-dominated and hence unusable.
| Quadrant | # 1 sec bins | Bins with >0 counts | Bins with >2000 counts | High rate bins dominated by noise | Noise dominated (total time) | Noise dominated (detector-on time) | Marked lightcurve |
|---|---|---|---|---|---|---|---|
| A | 7662 | 6322 | 10 | 10 | 0.13% | 0.16% | 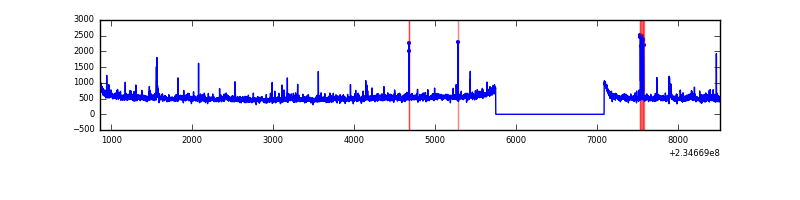 |
| B | 7662 | 6322 | 0 | 0 | 0.00% | 0.00% | 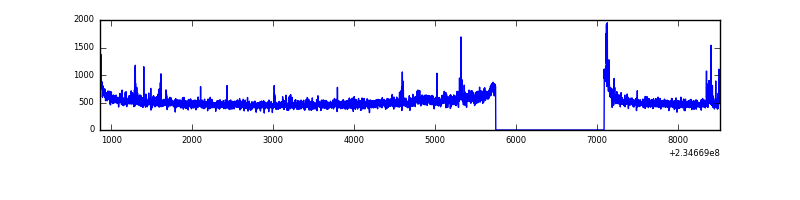 |
| C | 7662 | 6322 | 0 | 0 | 0.00% | 0.00% |  |
| D | 7662 | 6322 | 270 | 270 | 3.52% | 4.27% | 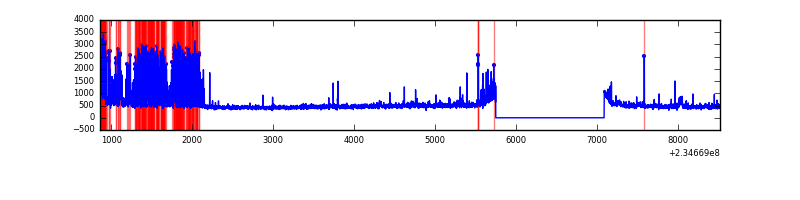 |
Top three noisy pixels from each quadrant. If the there are fewer than three noisy pixels in the level2.evt file, extra rows are filled as -1
| Pixel properties | Quadrant properties | ||||||
|---|---|---|---|---|---|---|---|
| Quadrant | DetID | PixID | Counts | Sigma | Mean | Median | Sigma |
| A | 8 | 5 | 136547 | 851.7 | 790 | 775 | 159.4 |
| A | 1 | 162 | 49425 | 305.18 | 790 | 775 | 159.4 |
| A | 15 | 174 | 38978 | 239.65 | 790 | 775 | 159.4 |
| B | 0 | 214 | 28337 | 182.8 | 802 | 784 | 150.7 |
| B | 0 | 219 | 22740 | 145.67 | 802 | 784 | 150.7 |
| B | 8 | 234 | 21183 | 135.34 | 802 | 784 | 150.7 |
| C | 9 | 68 | 83755 | 466.77 | 776 | 782 | 177.8 |
| C | 13 | 61 | 6047 | 29.62 | 776 | 782 | 177.8 |
| C | 14 | 67 | 2504 | 9.69 | 776 | 782 | 177.8 |
| D | 1 | 52 | 1159689 | 5812.98 | 754 | 737 | 199.4 |
| D | 7 | 71 | 54094 | 267.62 | 754 | 737 | 199.4 |
| D | 2 | 14 | 44514 | 219.57 | 754 | 737 | 199.4 |
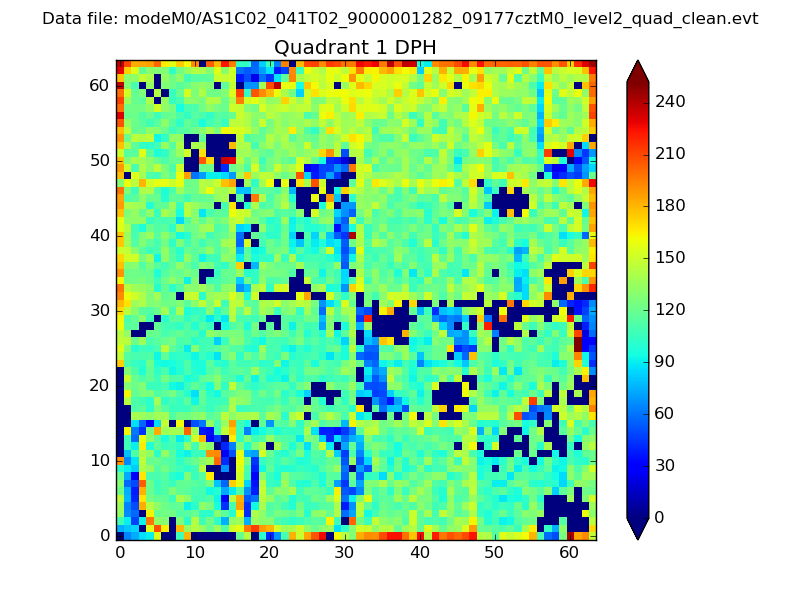
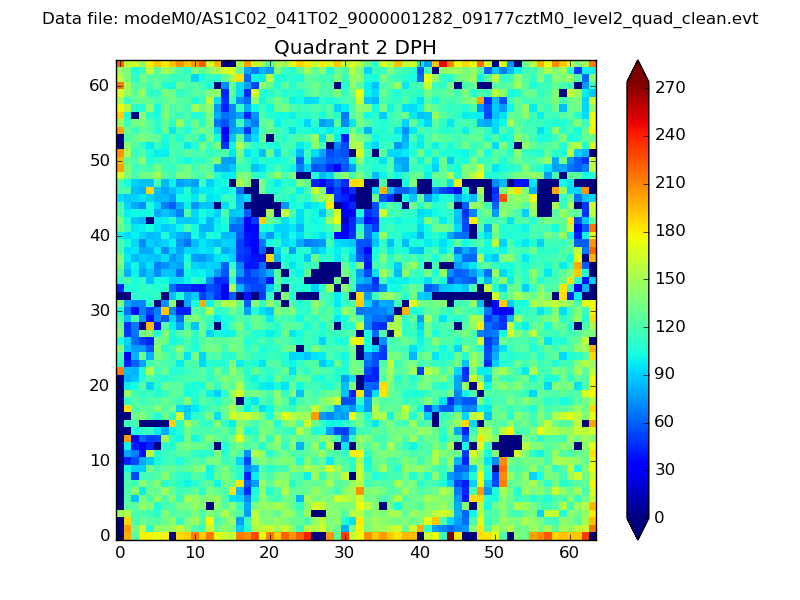
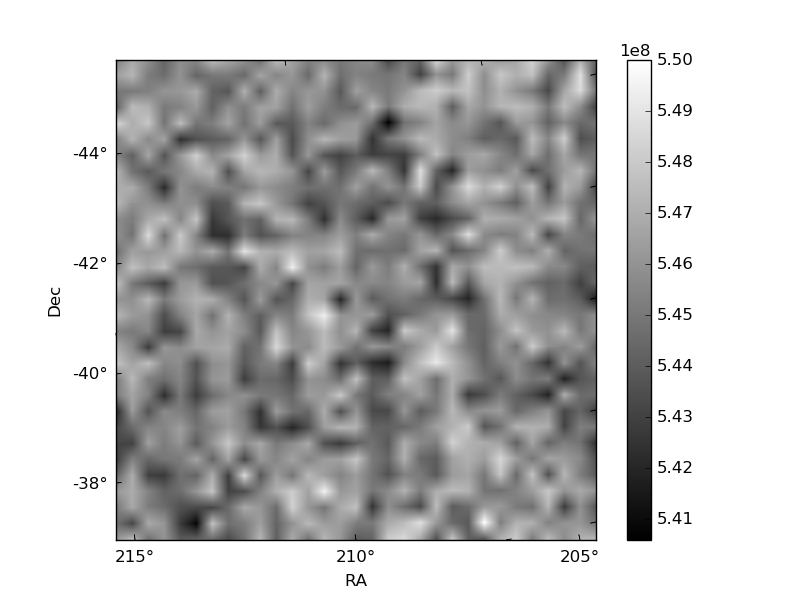
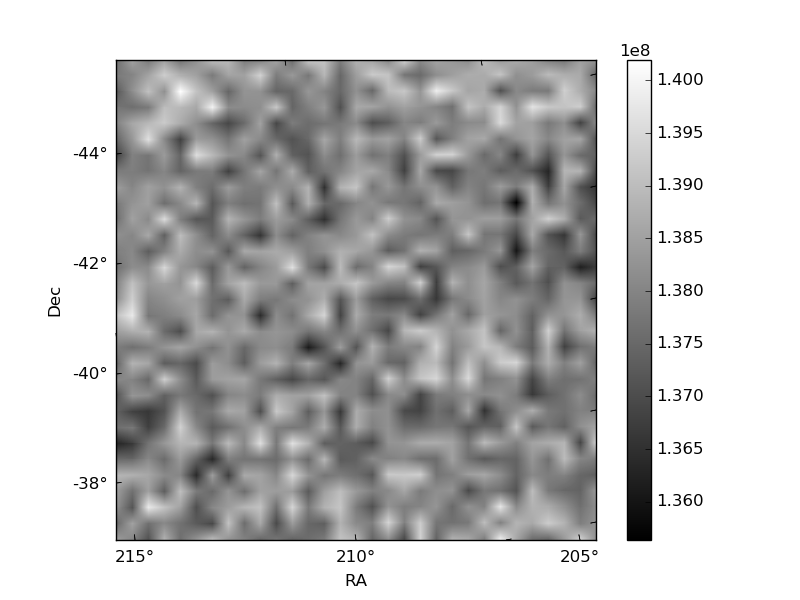
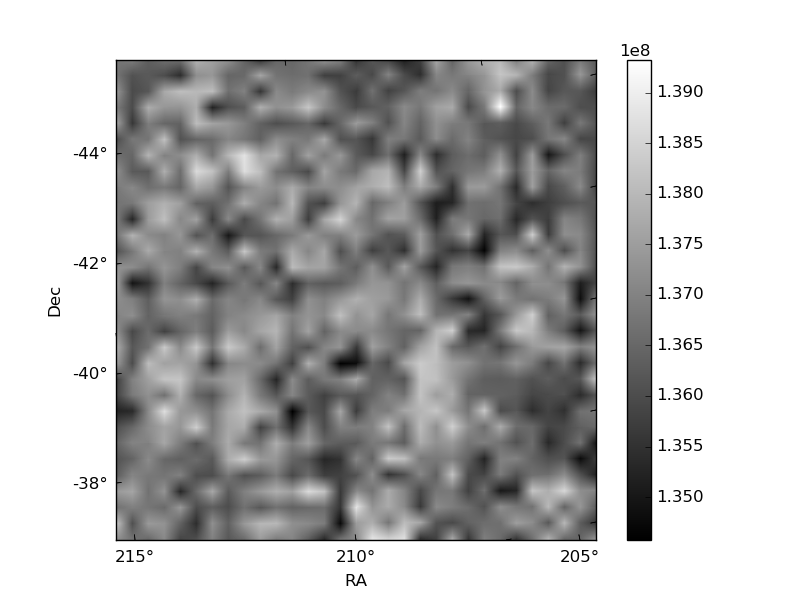
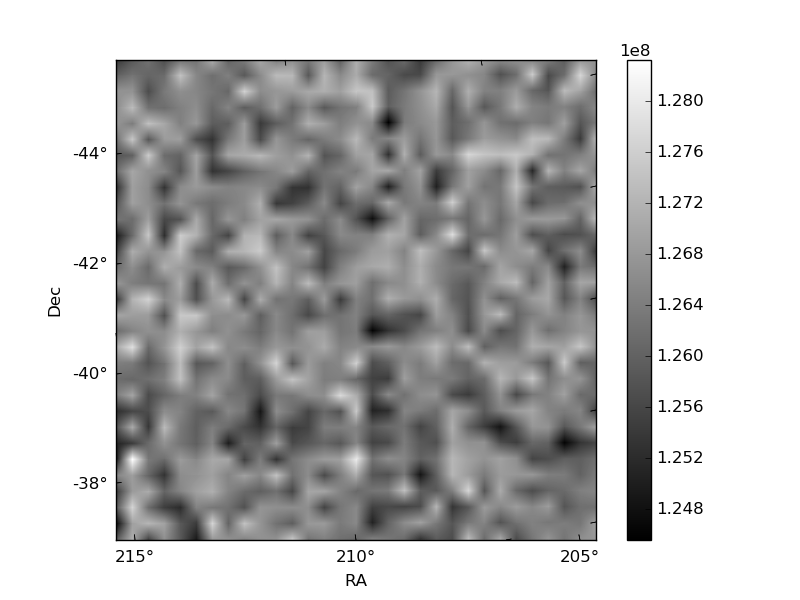
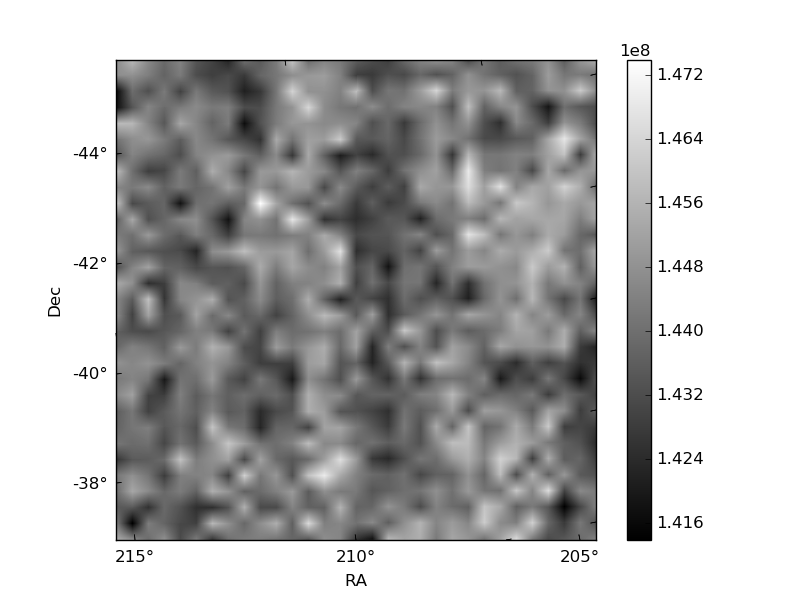
Histogram calculated using DETX and DETY for each event in the final _common_clean file
| Quadrant A | 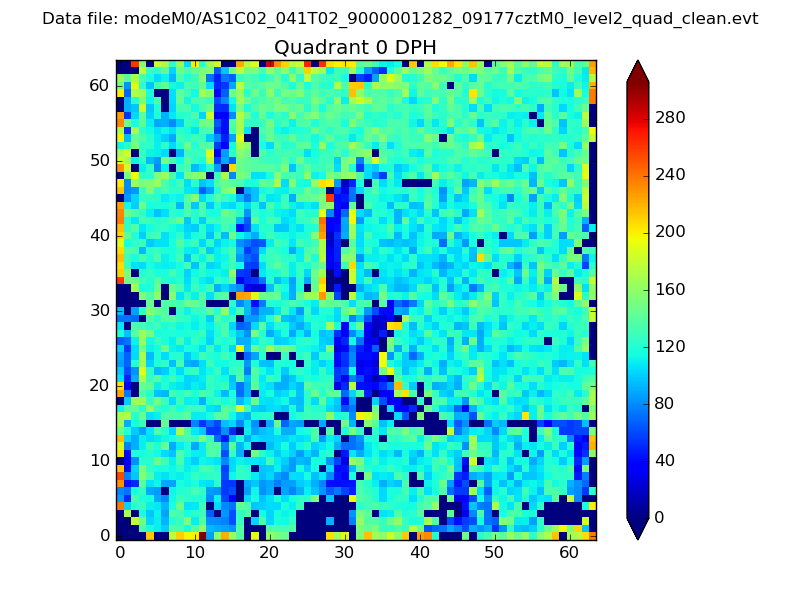 |
 |
Quadrant B |
|---|---|---|---|
| Quadrant D | 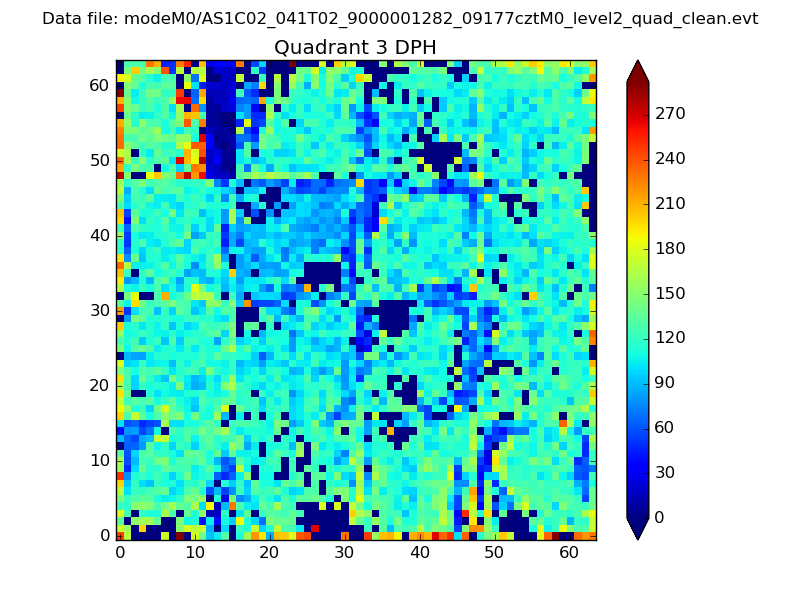 |
 |
Quadrant C |
| Plot type | Count rate plots | Images |
|---|---|---|
| Comparison with Poisson distribution Blue bars denote a histogram of data divided into 1 sec bins. Red curve is a Poisson curve with rate = median count rate of data. |
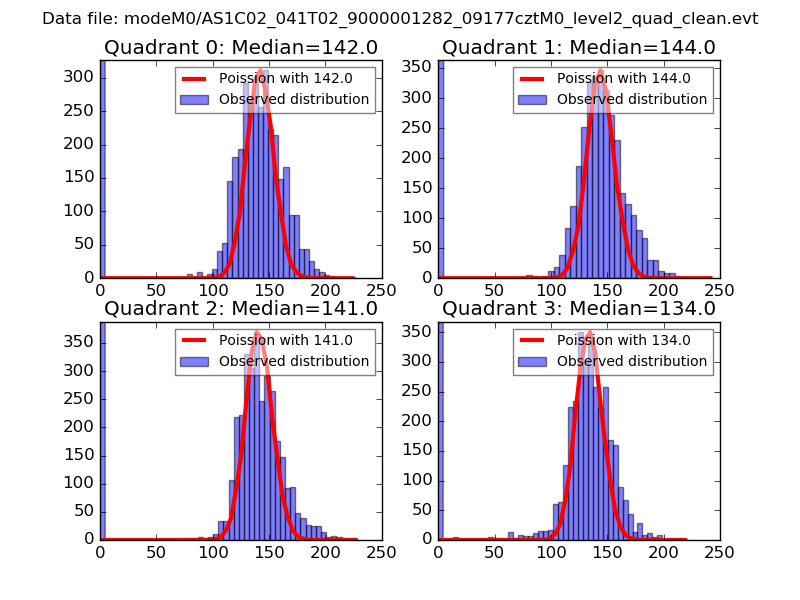 |
 |
| Quadrant-wise count rates Data is divided into 100 sec bins |
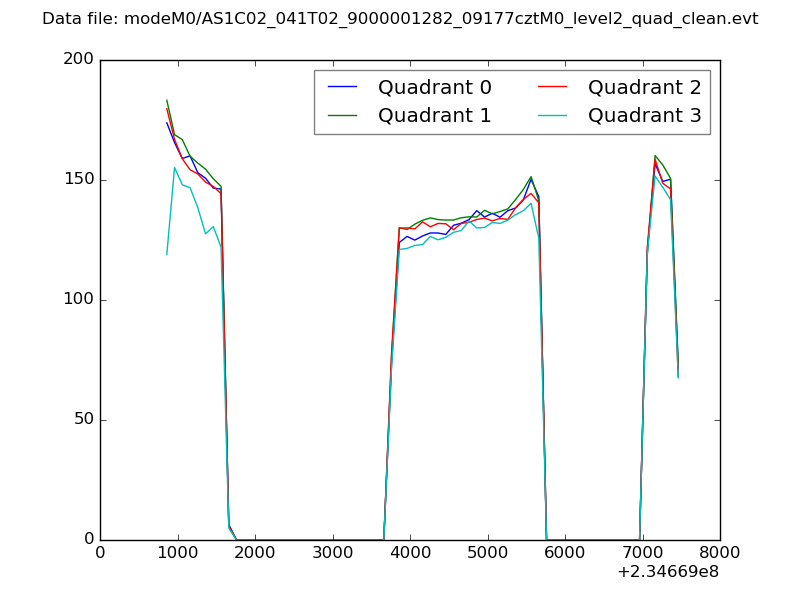 |
|
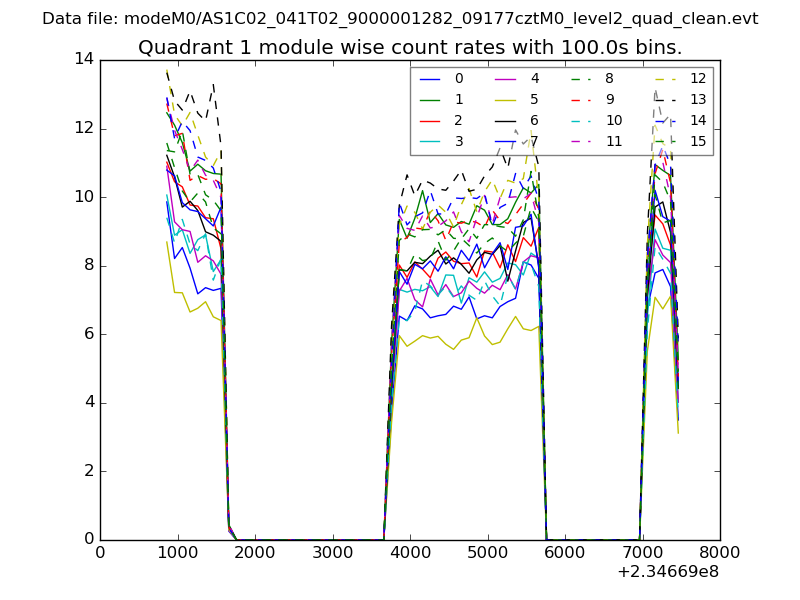
| Module-wise count rates for Quadrant A Data is divided into 100 sec bins |
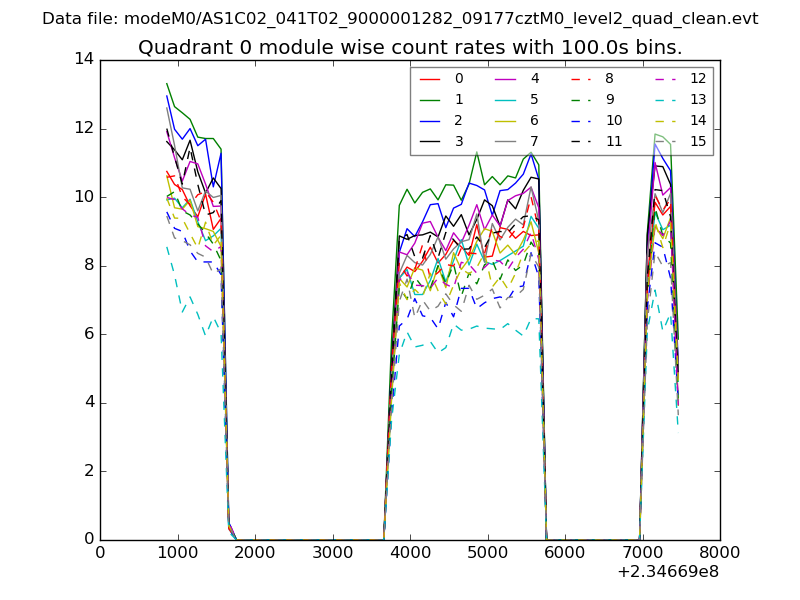 |
 |
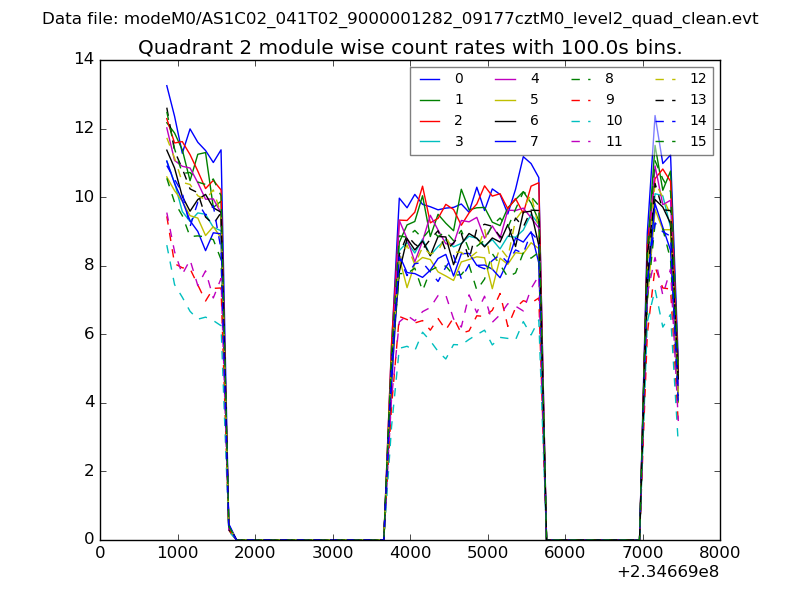
| Module-wise count rates for Quadrant B Data is divided into 100 sec bins |
 |
 |
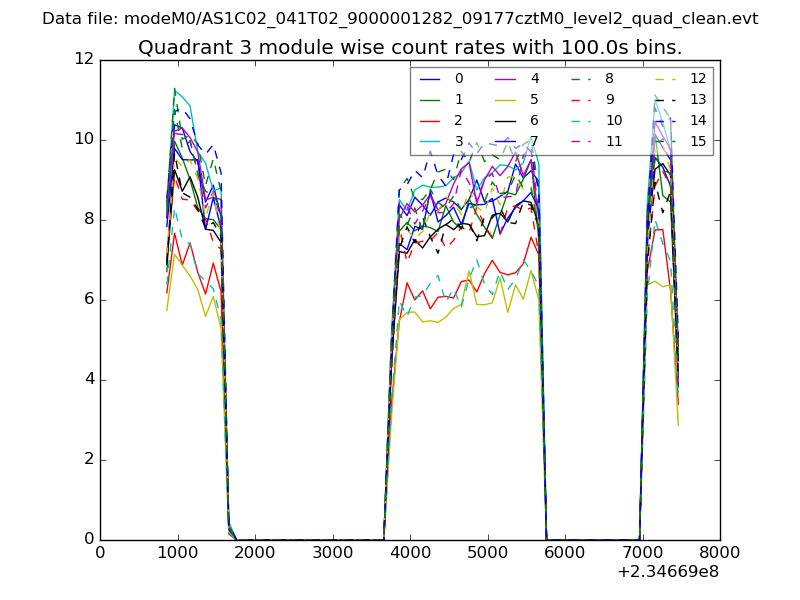
| Module-wise count rates for Quadrant C Data is divided into 100 sec bins |
 |
 |
| Module-wise count rates for Quadrant D Data is divided into 100 sec bins |
 |
 |
| Parameter | Plot |
|---|---|
| CZT HV Monitor | 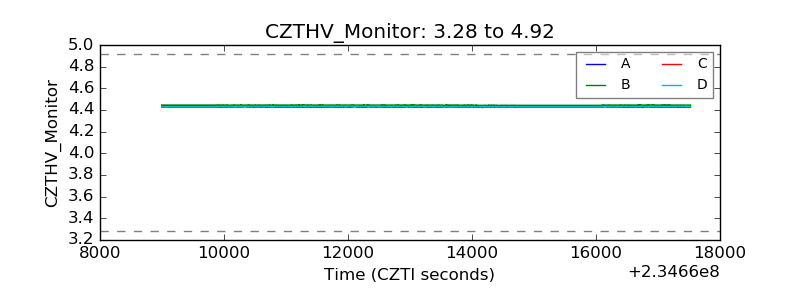 |
| D_VDD | 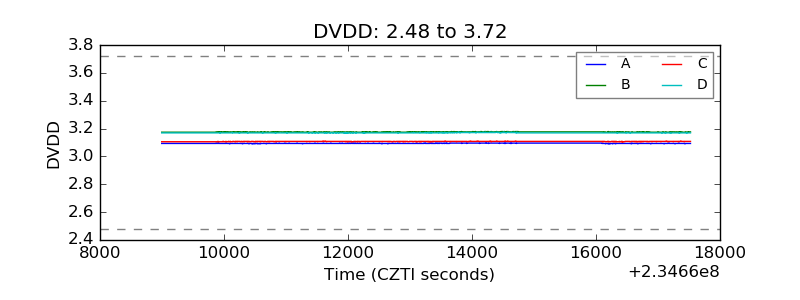 |
| Temperature 1 | 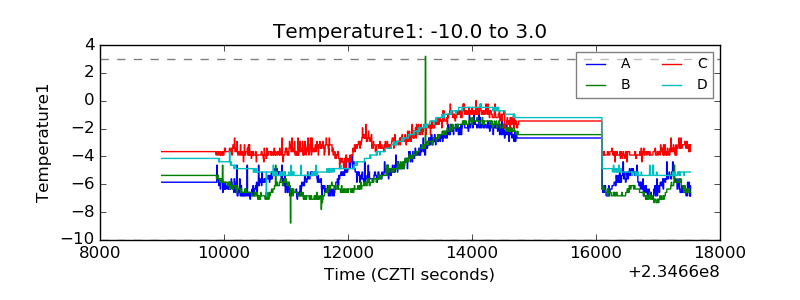 |
| Veto HV Monitor | 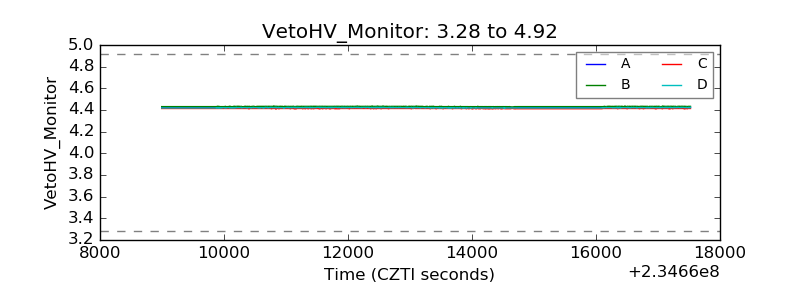 |
| Veto LLD | 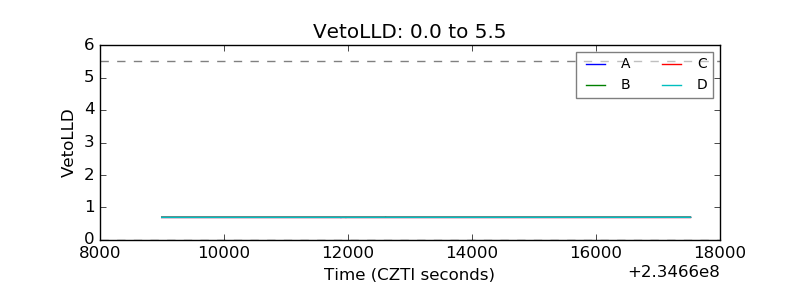 |
| Alpha Counter | 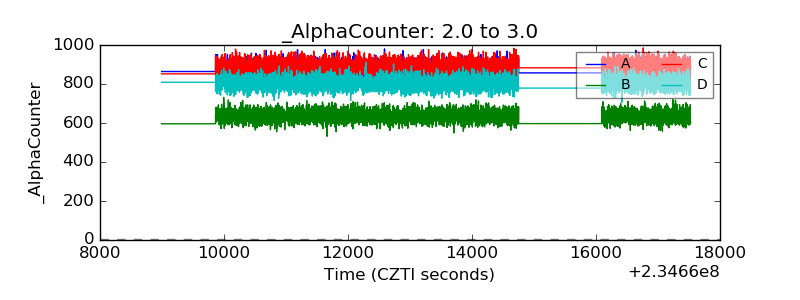 |
| _CPM_Rate | 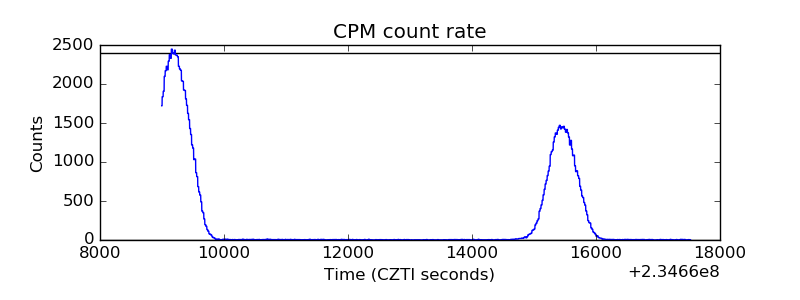 |
| CZT Counter | 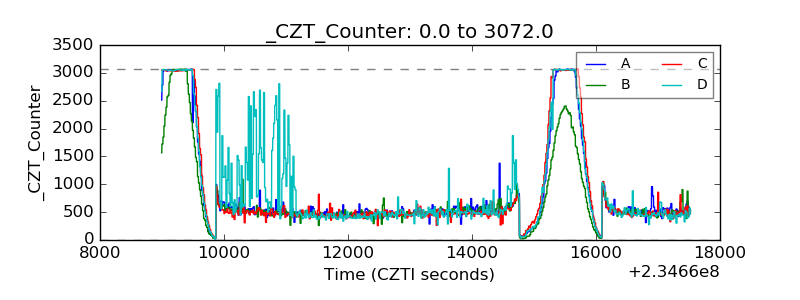 |
| +2.5 Volts monitor |  |
| +5 Volts monitor |  |
| _ROLL_ROT | 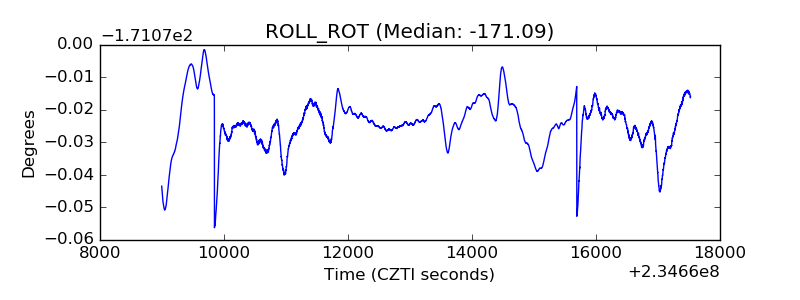 |
| _Roll_DEC | 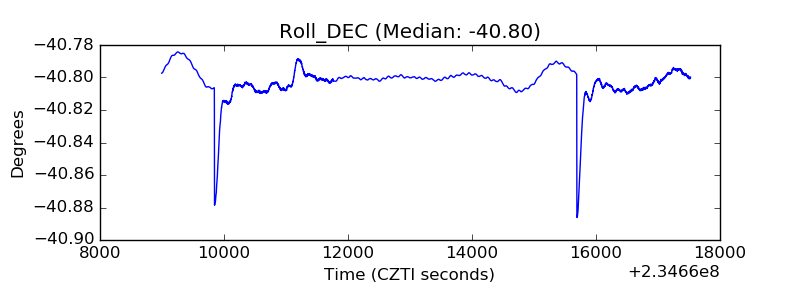 |
| _Roll_RA | 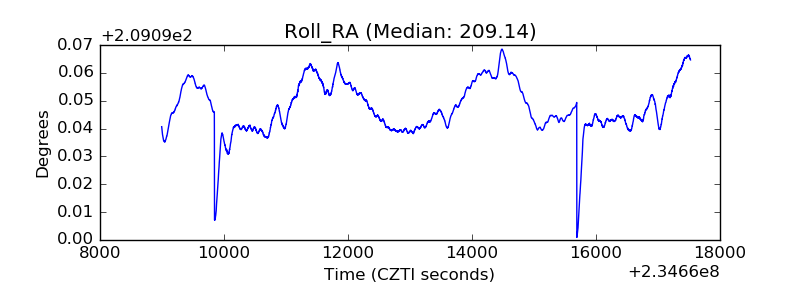 |
| Veto Counter | 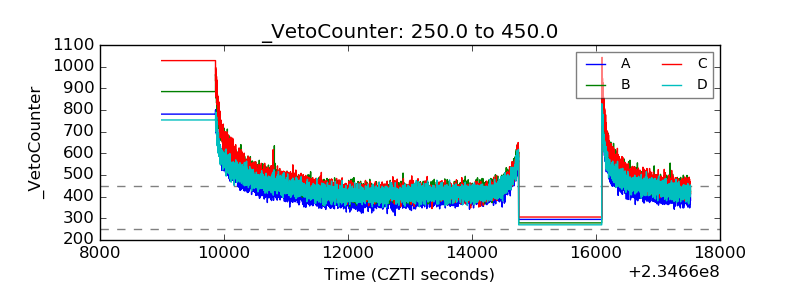 |