| Param | Original file | Final file |
|---|---|---|
| Filename | modeM0/AS1C02_041T02_9000001282_09179cztM0_level2.evt | modeM0/AS1C02_041T02_9000001282_09179cztM0_level2_quad_clean.evt |
| Size (bytes) | 449,138,880 | 68,883,840 |
| Size | 428.3 MB | 65.7 MB |
| Events in quadrant A | 3,387,513 | 409,889 |
| Events in quadrant B | 3,270,538 | 414,268 |
| Events in quadrant C | 3,209,777 | 407,260 |
| Events in quadrant D | 3,288,943 | 397,123 |
| Mode SS | |||
|---|---|---|---|
| Quadrant | BADHDUFLAG | Total packets | Discarded packets |
| A | 0 | 132 | 0 |
| B | 0 | 132 | 0 |
| C | 0 | 132 | 0 |
| D | 0 | 132 | 0 |
| Mode M0 | |||
|---|---|---|---|
| Quadrant | BADHDUFLAG | Total packets | Discarded packets |
| A | 0 | 13989 | 2 |
| B | 0 | 13895 | 1 |
| C | 0 | 13764 | 1 |
| D | 0 | 14262 | 1 |
| Mode M9 | |||
|---|---|---|---|
| Quadrant | BADHDUFLAG | Total packets | Discarded packets |
| A | 0 | 9 | 0 |
| B | 0 | 9 | 0 |
| C | 0 | 9 | 0 |
| D | 0 | 9 | 0 |
| Quadrant | Total seconds | Saturated seconds | Saturation percentage |
|---|---|---|---|
| A | 6558 | 61 | 0.930162% |
| B | 6558 | 84 | 1.280878% |
| C | 6558 | 59 | 0.899665% |
| D | 6558 | 103 | 1.570601% |
Noise dominated data is calculated using 1-second bins in cleaned event files. If a bin has >2000 counts, and if more than 50% of those come from <1% of pixels, then it is considered to be noise-dominated and hence unusable.
| Quadrant | # 1 sec bins | Bins with >0 counts | Bins with >2000 counts | High rate bins dominated by noise | Noise dominated (total time) | Noise dominated (detector-on time) | Marked lightcurve |
|---|---|---|---|---|---|---|---|
| A | 7413 | 6559 | 1 | 1 | 0.01% | 0.02% | 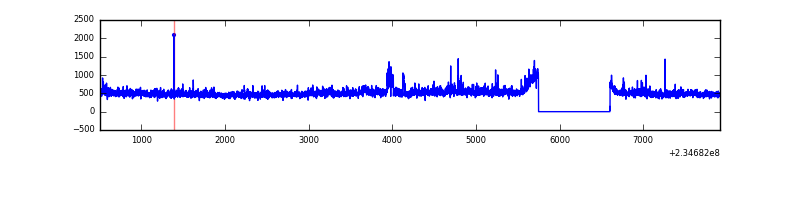 |
| B | 7413 | 6559 | 11 | 11 | 0.15% | 0.17% | 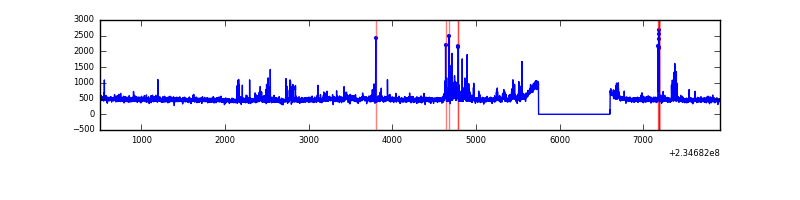 |
| C | 7413 | 6559 | 0 | 0 | 0.00% | 0.00% | 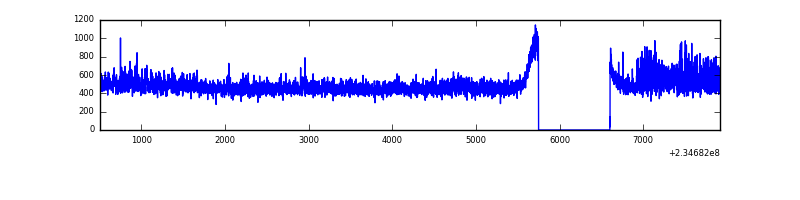 |
| D | 7413 | 6559 | 50 | 50 | 0.67% | 0.76% | 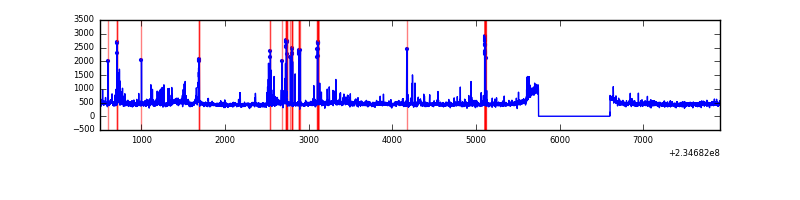 |
Top three noisy pixels from each quadrant. If the there are fewer than three noisy pixels in the level2.evt file, extra rows are filled as -1
| Pixel properties | Quadrant properties | ||||||
|---|---|---|---|---|---|---|---|
| Quadrant | DetID | PixID | Counts | Sigma | Mean | Median | Sigma |
| A | 8 | 5 | 213435 | 1341.58 | 778 | 762 | 158.5 |
| A | 1 | 162 | 102676 | 642.89 | 778 | 762 | 158.5 |
| A | 1 | 178 | 22802 | 139.03 | 778 | 762 | 158.5 |
| B | 8 | 234 | 84384 | 561.6 | 786 | 766 | 148.9 |
| B | 4 | 80 | 54907 | 363.62 | 786 | 766 | 148.9 |
| B | 0 | 214 | 21747 | 140.91 | 786 | 766 | 148.9 |
| C | 9 | 68 | 236398 | 1332.01 | 761 | 765 | 176.9 |
| C | 13 | 61 | 5940 | 29.25 | 761 | 765 | 176.9 |
| C | 8 | 222 | 3313 | 14.4 | 761 | 765 | 176.9 |
| D | 1 | 52 | 295165 | 1489.85 | 754 | 734 | 197.6 |
| D | 2 | 14 | 48126 | 239.81 | 754 | 734 | 197.6 |
| D | 2 | 234 | 26445 | 130.1 | 754 | 734 | 197.6 |
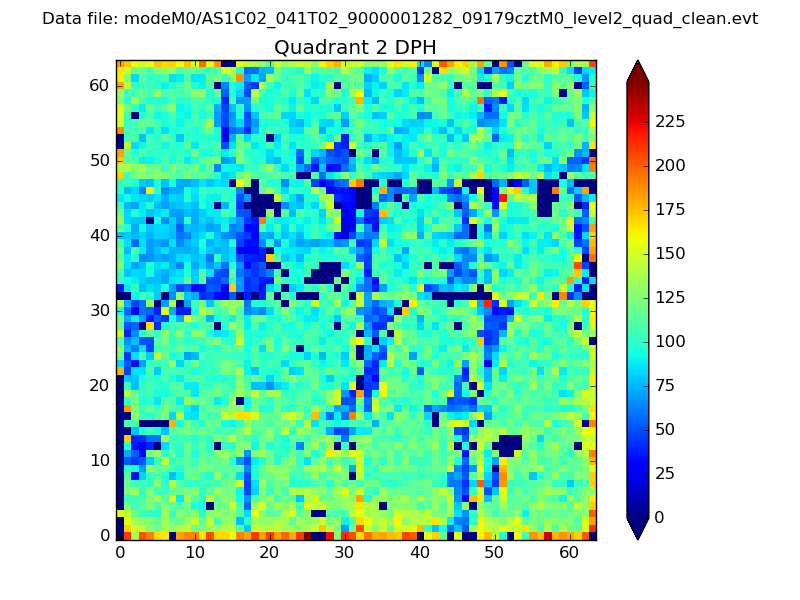
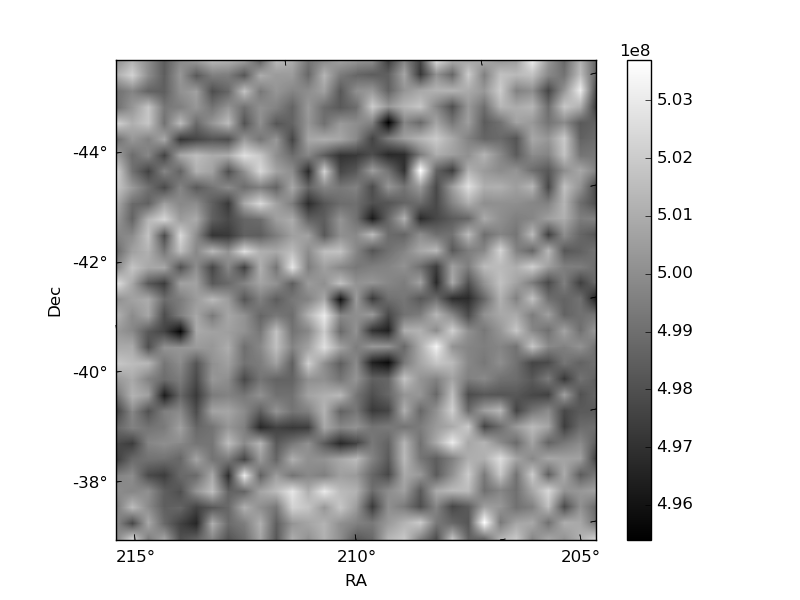
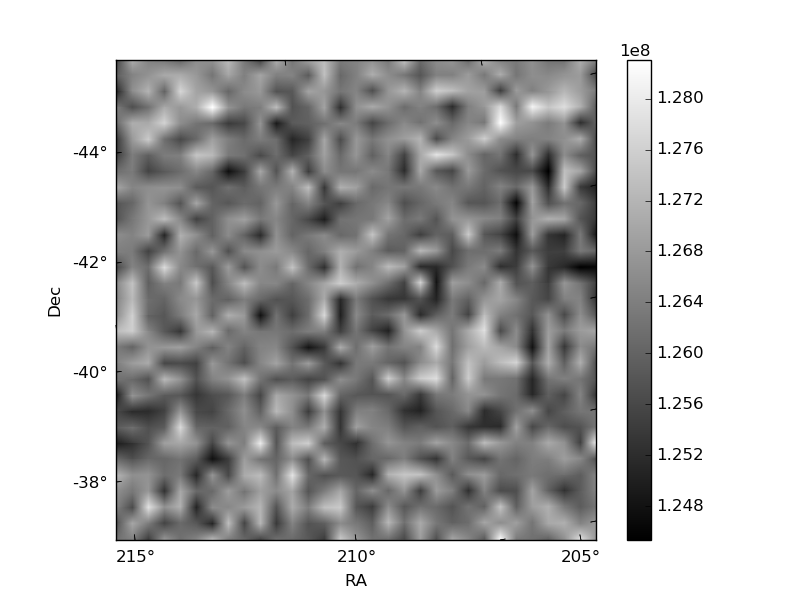
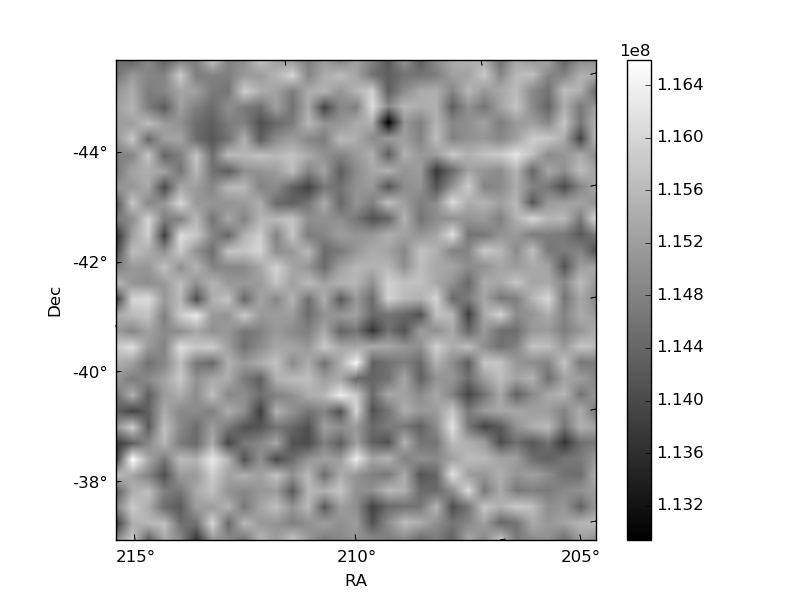
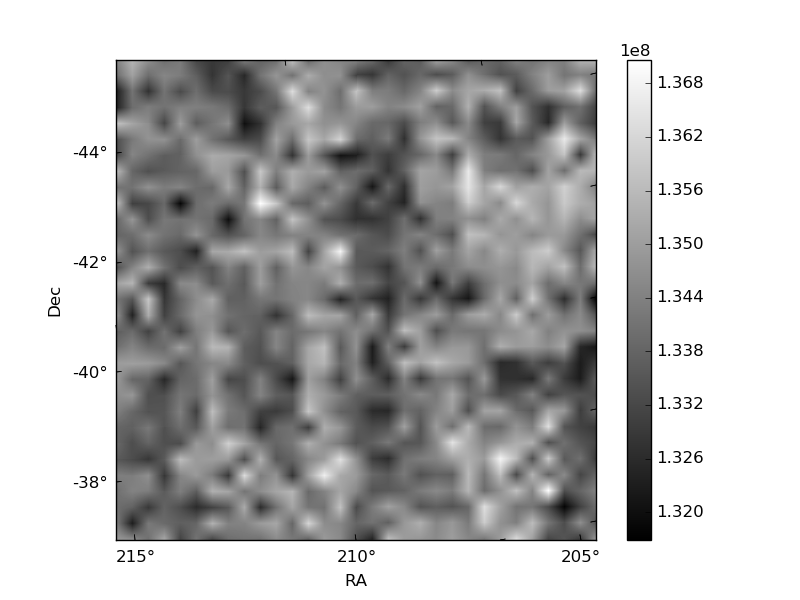
Histogram calculated using DETX and DETY for each event in the final _common_clean file
| Quadrant A | 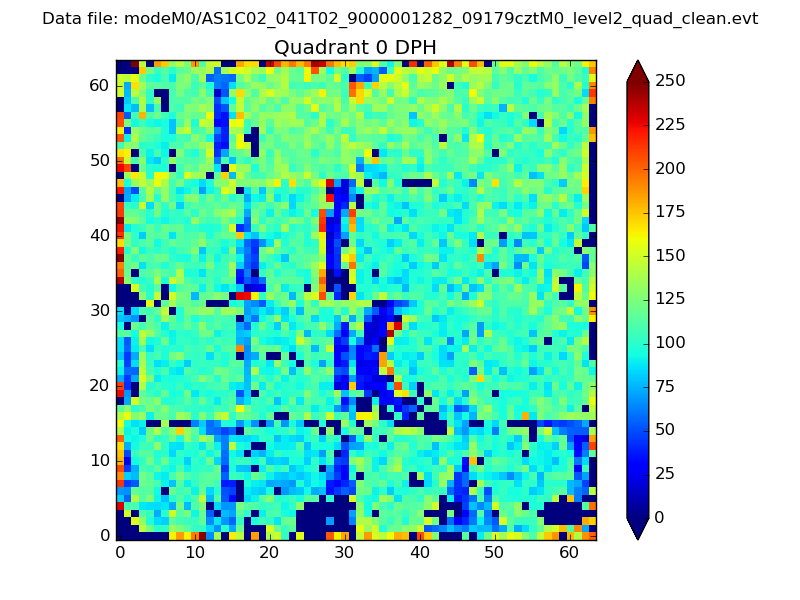 |
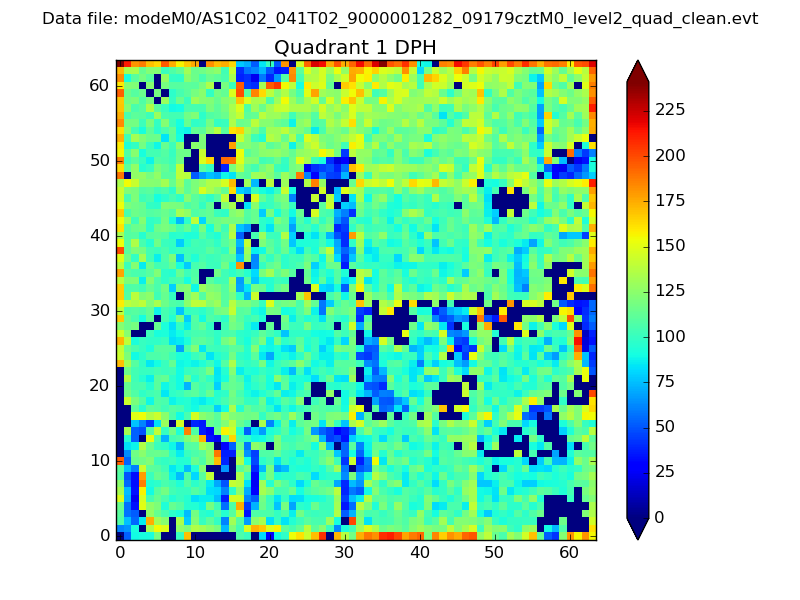 |
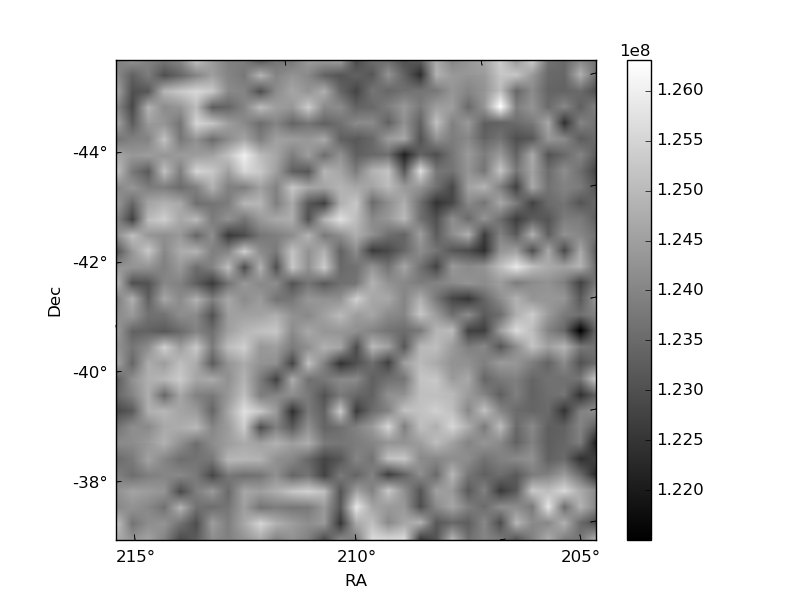
Quadrant B |
|---|---|---|---|
| Quadrant D | 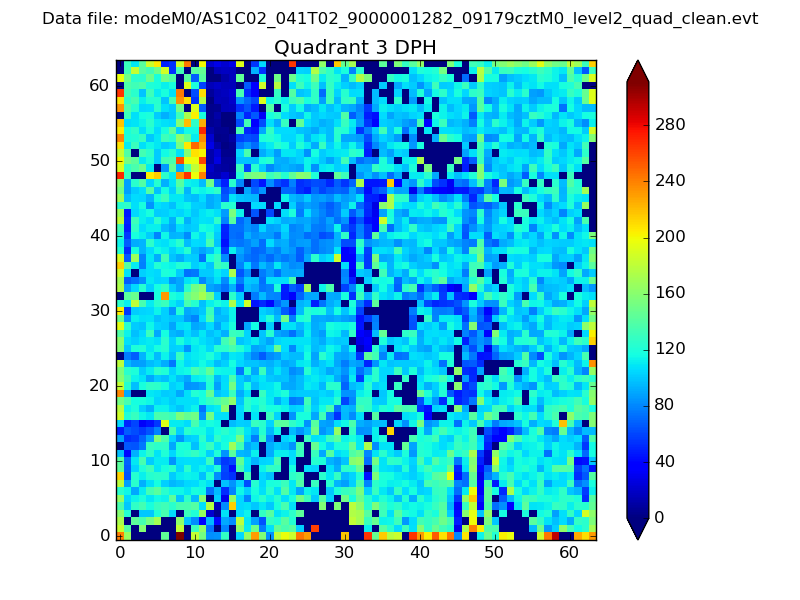 |
 |
Quadrant C |
| Plot type | Count rate plots | Images |
|---|---|---|
| Comparison with Poisson distribution Blue bars denote a histogram of data divided into 1 sec bins. Red curve is a Poisson curve with rate = median count rate of data. |
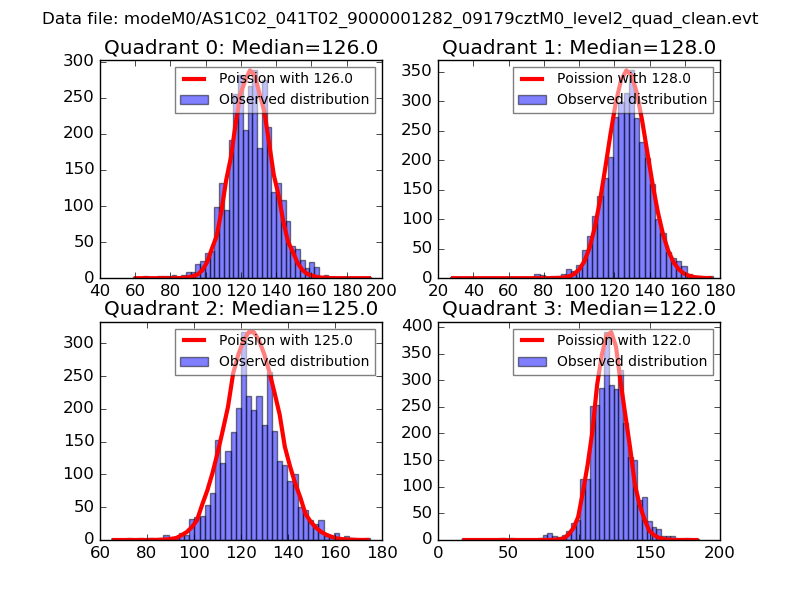 |
 |
| Quadrant-wise count rates Data is divided into 100 sec bins |
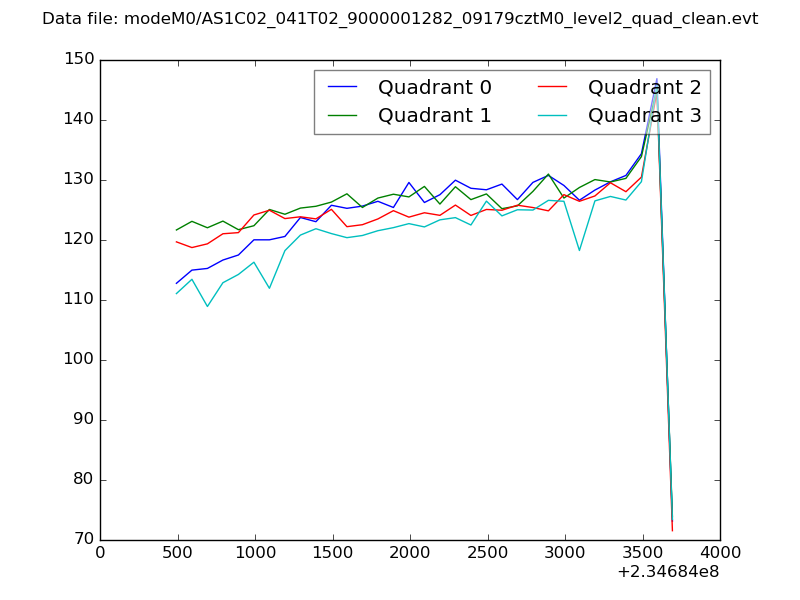 |
|
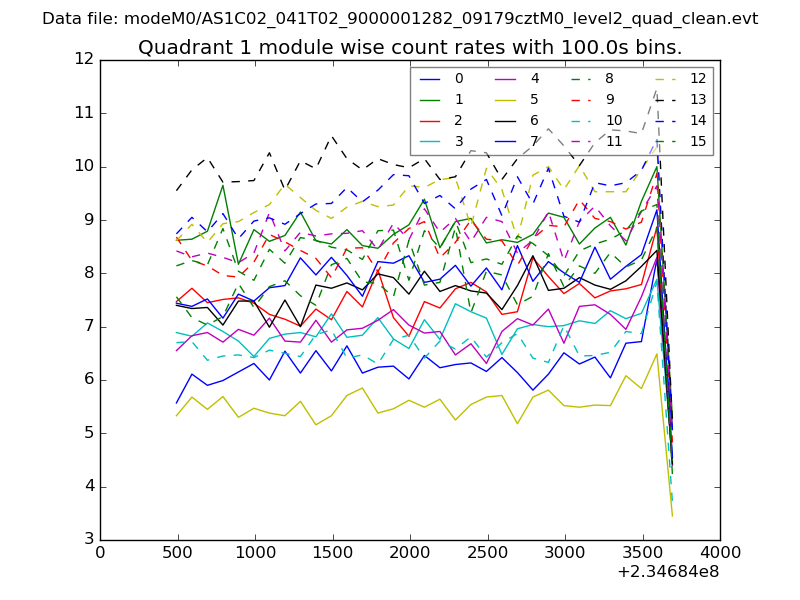
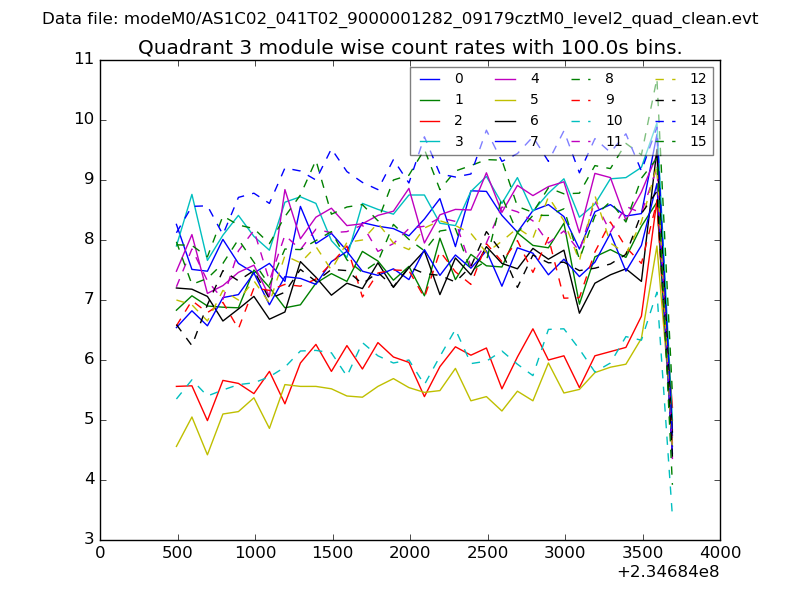
| Module-wise count rates for Quadrant A Data is divided into 100 sec bins |
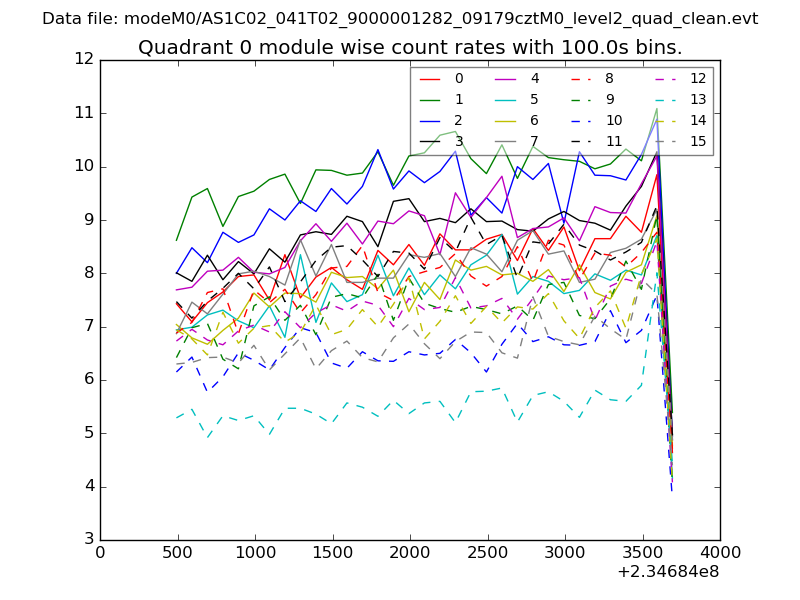 |
 |
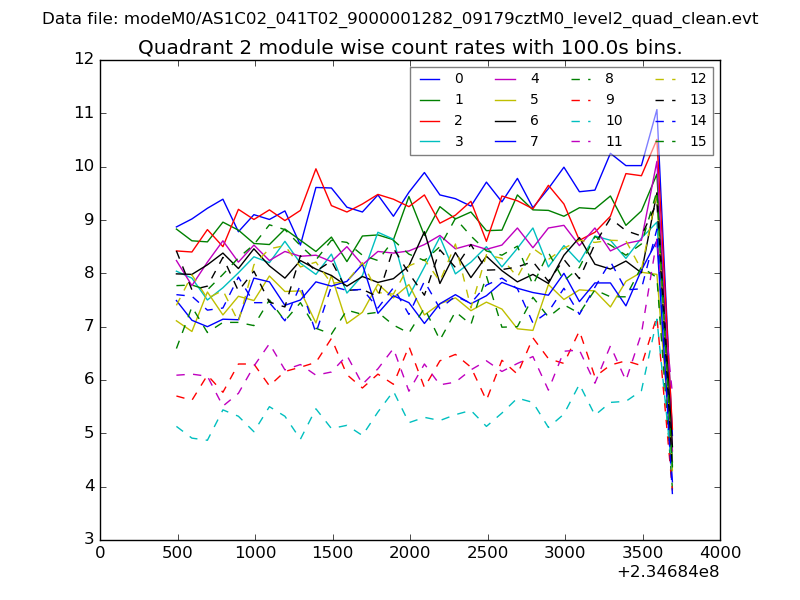
| Module-wise count rates for Quadrant B Data is divided into 100 sec bins |
 |
 |
| Module-wise count rates for Quadrant C Data is divided into 100 sec bins |
 |
 |
| Module-wise count rates for Quadrant D Data is divided into 100 sec bins |
 |
 |
| Parameter | Plot |
|---|---|
| CZT HV Monitor | 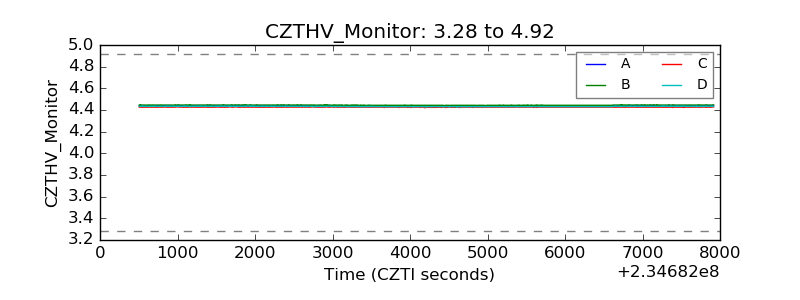 |
| D_VDD |  |
| Temperature 1 | 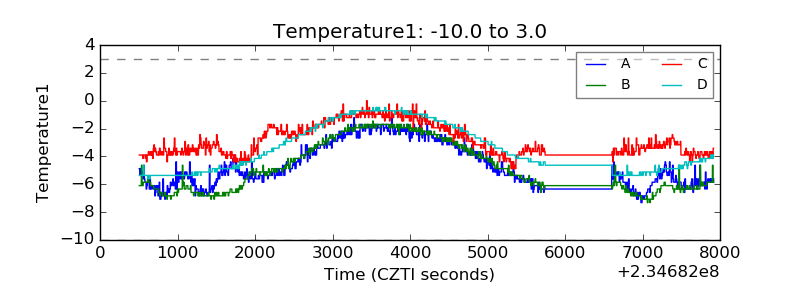 |
| Veto HV Monitor |  |
| Veto LLD | 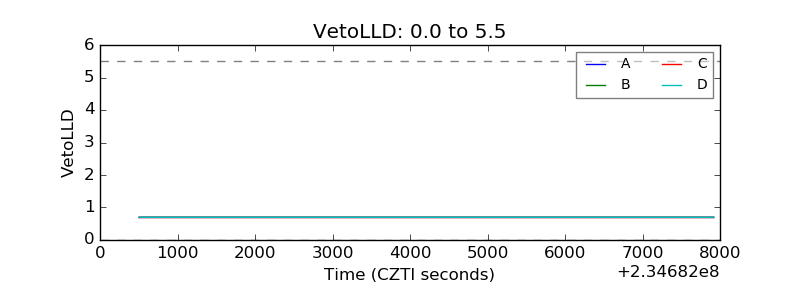 |
| Alpha Counter | 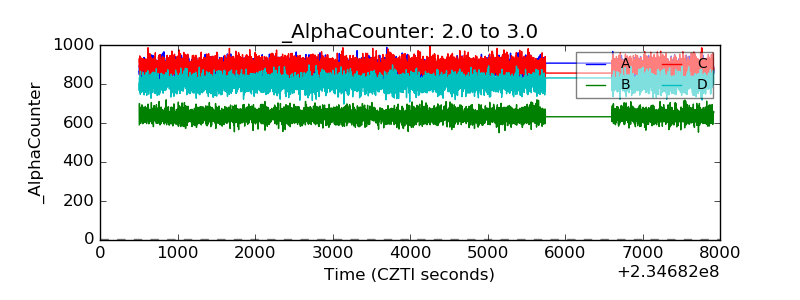 |
| _CPM_Rate | 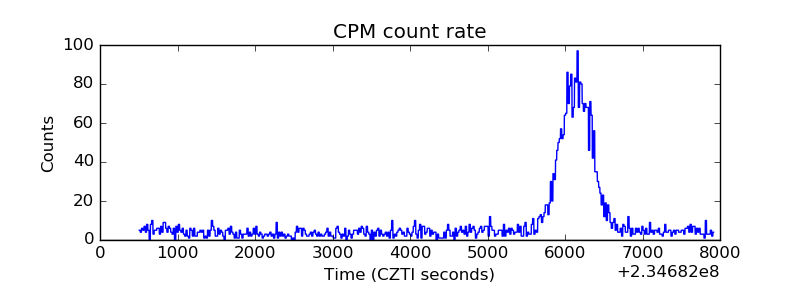 |
| CZT Counter |  |
| +2.5 Volts monitor |  |
| +5 Volts monitor |  |
| _ROLL_ROT | 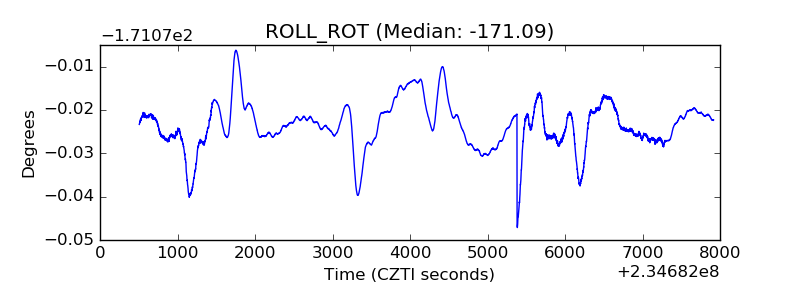 |
| _Roll_DEC | 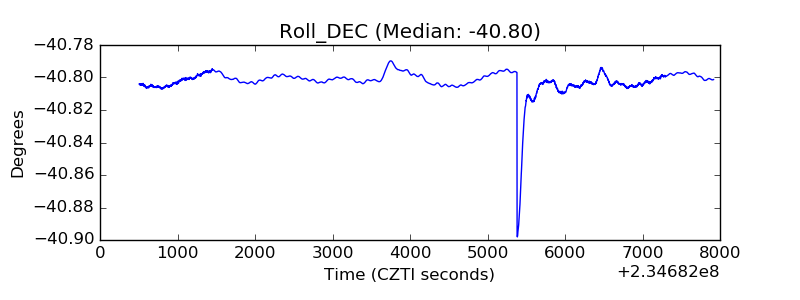 |
| _Roll_RA | 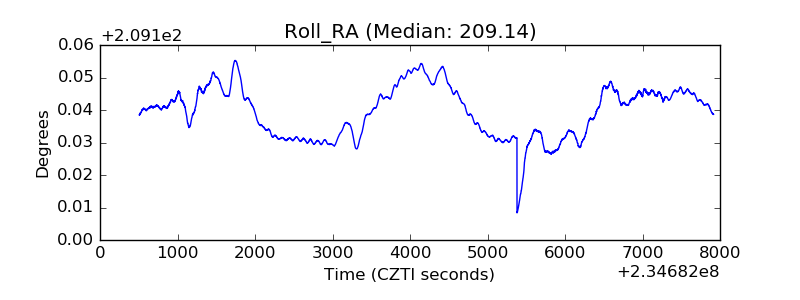 |
| Veto Counter | 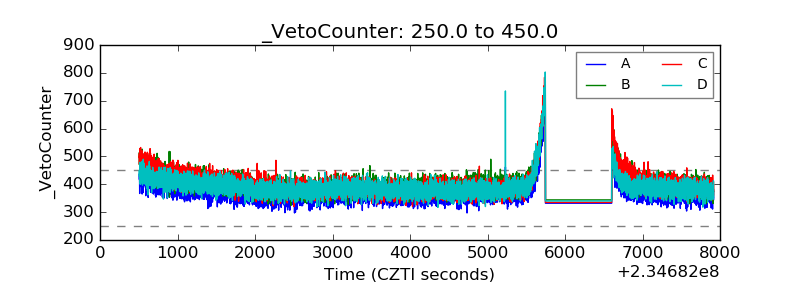 |