| Param | Original file | Final file |
|---|---|---|
| Filename | modeM0/AS1C02_041T02_9000001282_09180cztM0_level2.evt | modeM0/AS1C02_041T02_9000001282_09180cztM0_level2_quad_clean.evt |
| Size (bytes) | 539,144,640 | 79,367,040 |
| Size | 514.2 MB | 75.7 MB |
| Events in quadrant A | 4,482,733 | 472,799 |
| Events in quadrant B | 3,732,437 | 481,086 |
| Events in quadrant C | 3,674,405 | 469,854 |
| Events in quadrant D | 3,932,133 | 460,388 |
| Mode SS | |||
|---|---|---|---|
| Quadrant | BADHDUFLAG | Total packets | Discarded packets |
| A | 0 | 152 | 0 |
| B | 0 | 152 | 0 |
| C | 0 | 152 | 0 |
| D | 0 | 152 | 0 |
| Mode M0 | |||
|---|---|---|---|
| Quadrant | BADHDUFLAG | Total packets | Discarded packets |
| A | 0 | 18019 | 3 |
| B | 0 | 15970 | 2 |
| C | 0 | 16061 | 2 |
| D | 0 | 16859 | 2 |
| Mode M9 | |||
|---|---|---|---|
| Quadrant | BADHDUFLAG | Total packets | Discarded packets |
| A | 0 | 12 | 0 |
| B | 0 | 12 | 0 |
| C | 0 | 12 | 0 |
| D | 0 | 12 | 0 |
| Quadrant | Total seconds | Saturated seconds | Saturation percentage |
|---|---|---|---|
| A | 7463 | 275 | 3.684845% |
| B | 7463 | 231 | 3.095270% |
| C | 7463 | 193 | 2.586091% |
| D | 7463 | 260 | 3.483854% |
Noise dominated data is calculated using 1-second bins in cleaned event files. If a bin has >2000 counts, and if more than 50% of those come from <1% of pixels, then it is considered to be noise-dominated and hence unusable.
| Quadrant | # 1 sec bins | Bins with >0 counts | Bins with >2000 counts | High rate bins dominated by noise | Noise dominated (total time) | Noise dominated (detector-on time) | Marked lightcurve |
|---|---|---|---|---|---|---|---|
| A | 8643 | 7465 | 70 | 70 | 0.81% | 0.94% | 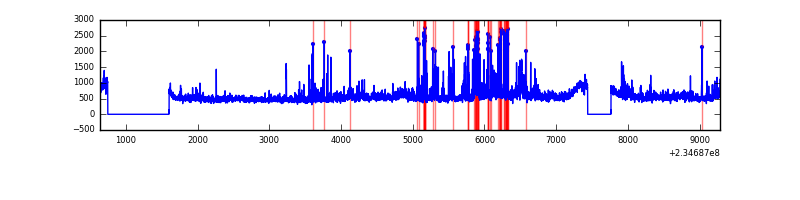 |
| B | 8643 | 7465 | 10 | 10 | 0.12% | 0.13% | 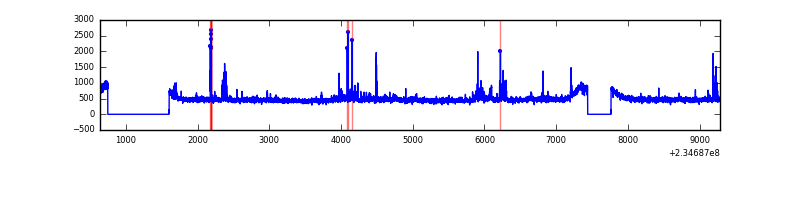 |
| C | 8643 | 7465 | 0 | 0 | 0.00% | 0.00% | 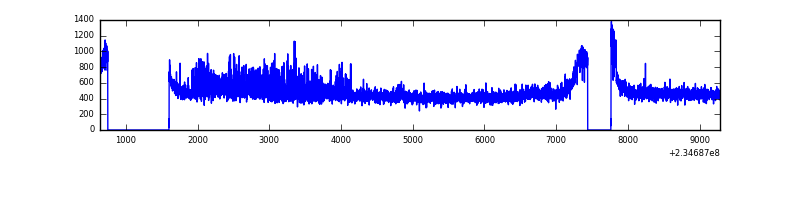 |
| D | 8643 | 7465 | 75 | 75 | 0.87% | 1.00% | 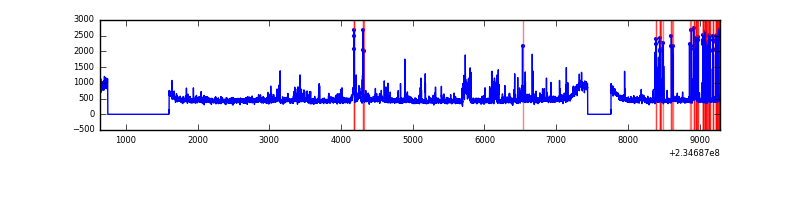 |
Top three noisy pixels from each quadrant. If the there are fewer than three noisy pixels in the level2.evt file, extra rows are filled as -1
| Pixel properties | Quadrant properties | ||||||
|---|---|---|---|---|---|---|---|
| Quadrant | DetID | PixID | Counts | Sigma | Mean | Median | Sigma |
| A | 8 | 5 | 753045 | 4081.27 | 898 | 879 | 184.3 |
| A | 1 | 162 | 154891 | 835.67 | 898 | 879 | 184.3 |
| A | 1 | 161 | 35315 | 186.85 | 898 | 879 | 184.3 |
| B | 4 | 80 | 38463 | 214.35 | 906 | 881 | 175.3 |
| B | 10 | 252 | 29222 | 161.65 | 906 | 881 | 175.3 |
| B | 0 | 213 | 26780 | 147.72 | 906 | 881 | 175.3 |
| C | 9 | 68 | 239183 | 1155.24 | 880 | 883 | 206.3 |
| C | 13 | 61 | 6766 | 28.52 | 880 | 883 | 206.3 |
| C | 8 | 222 | 3927 | 14.76 | 880 | 883 | 206.3 |
| D | 1 | 52 | 398711 | 1700.1 | 871 | 851 | 234.0 |
| D | 7 | 71 | 61832 | 260.58 | 871 | 851 | 234.0 |
| D | 6 | 225 | 49068 | 206.04 | 871 | 851 | 234.0 |
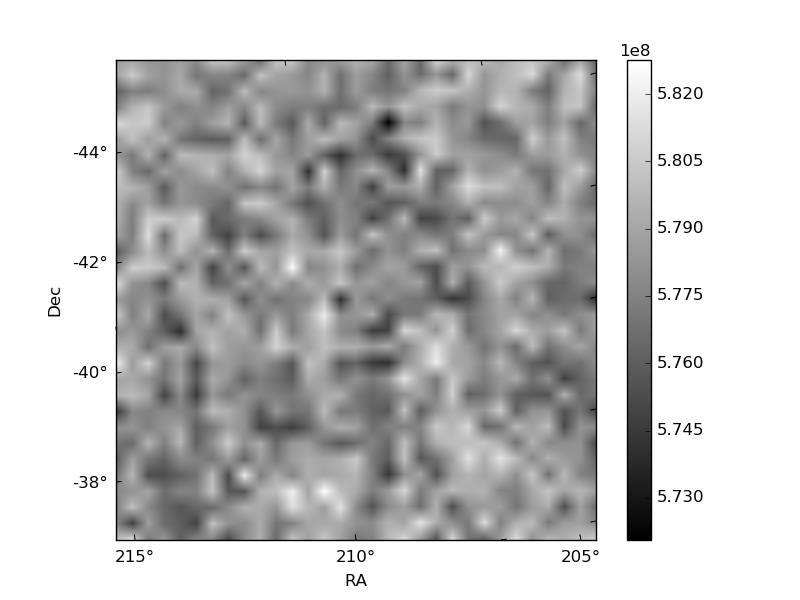
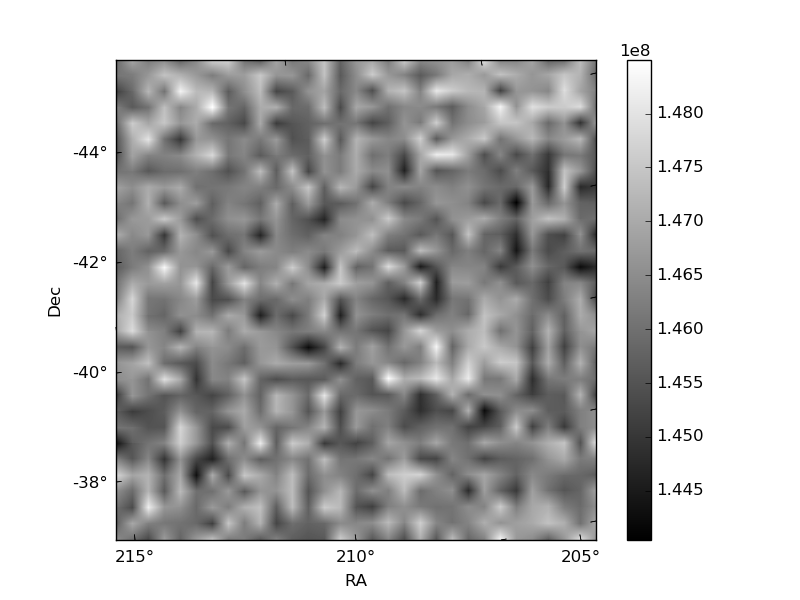
Histogram calculated using DETX and DETY for each event in the final _common_clean file
| Quadrant A | 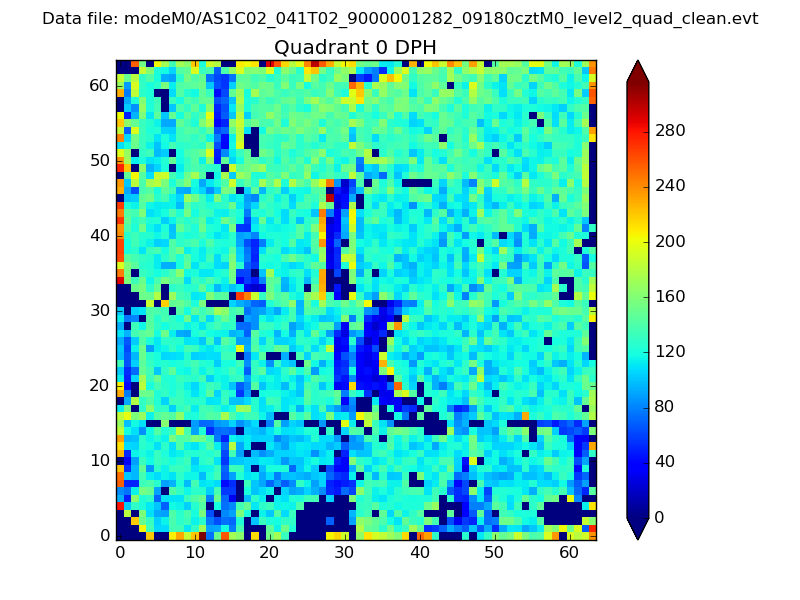 |
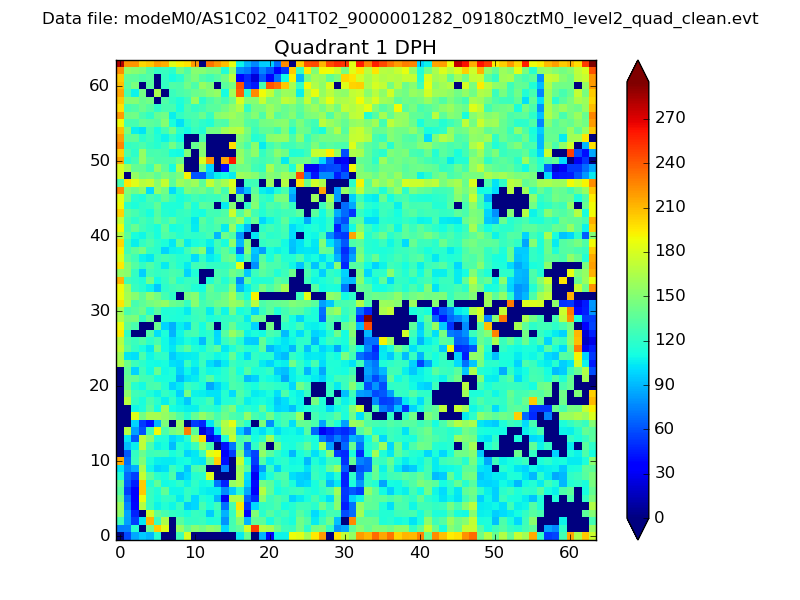 |
Quadrant B |
|---|---|---|---|
| Quadrant D |  |
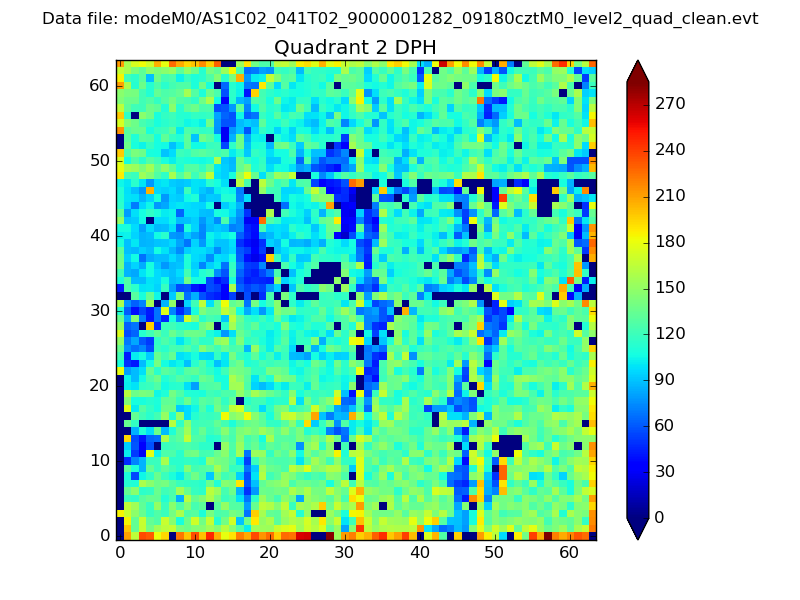 |
Quadrant C |
| Plot type | Count rate plots | Images |
|---|---|---|
| Comparison with Poisson distribution Blue bars denote a histogram of data divided into 1 sec bins. Red curve is a Poisson curve with rate = median count rate of data. |
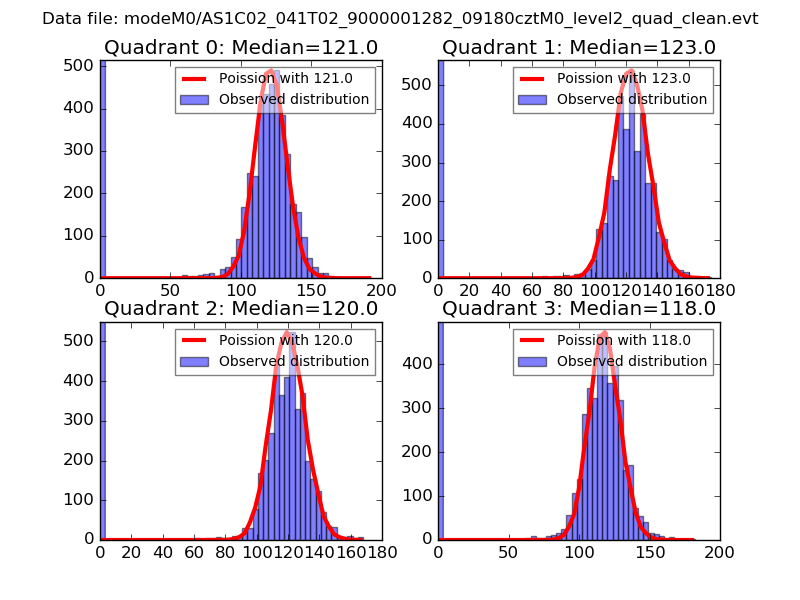 |
 |
| Quadrant-wise count rates Data is divided into 100 sec bins |
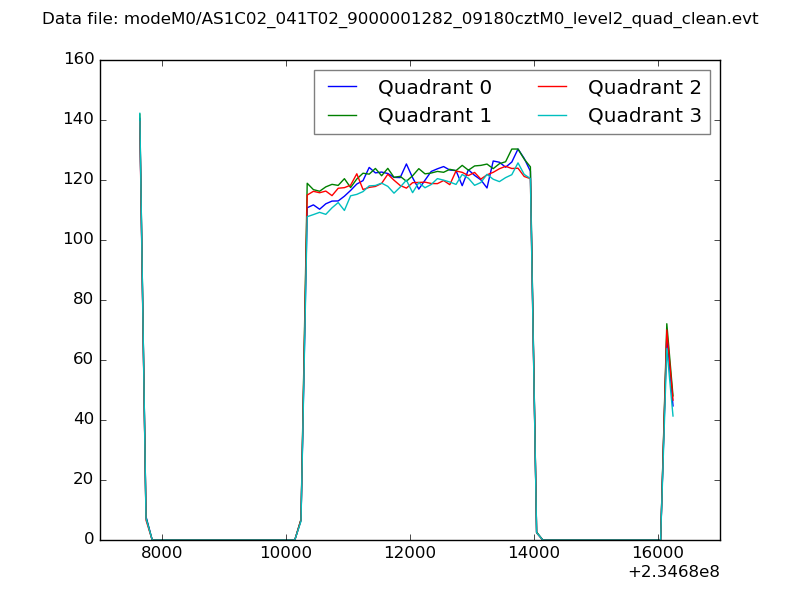 |
|
| Module-wise count rates for Quadrant A Data is divided into 100 sec bins |
 |
 |
| Module-wise count rates for Quadrant B Data is divided into 100 sec bins |
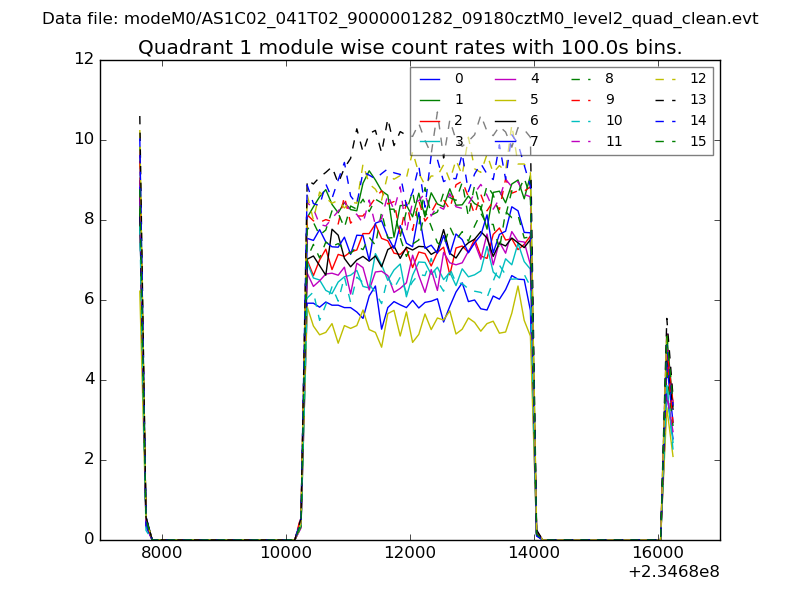 |
 |
| Module-wise count rates for Quadrant C Data is divided into 100 sec bins |
 |
 |
| Module-wise count rates for Quadrant D Data is divided into 100 sec bins |
 |
 |
| Parameter | Plot |
|---|---|
| CZT HV Monitor |  |
| D_VDD | 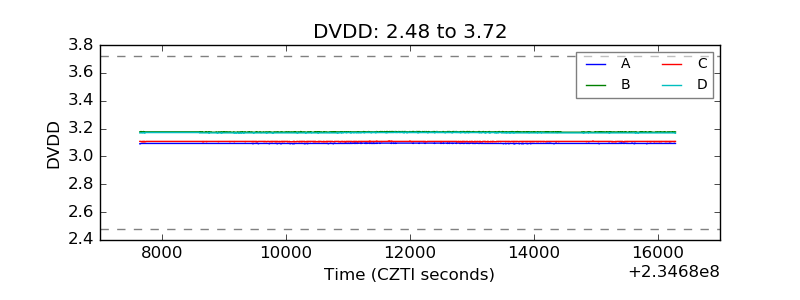 |
| Temperature 1 | 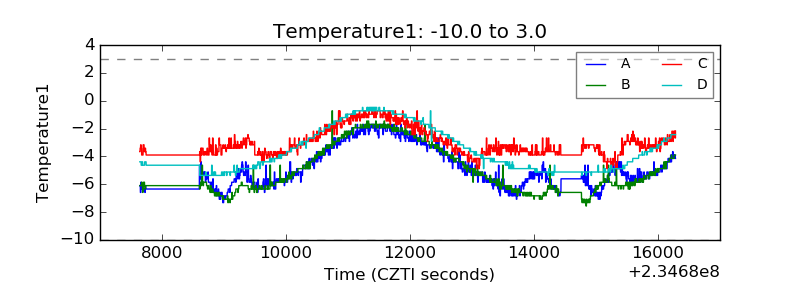 |
| Veto HV Monitor | 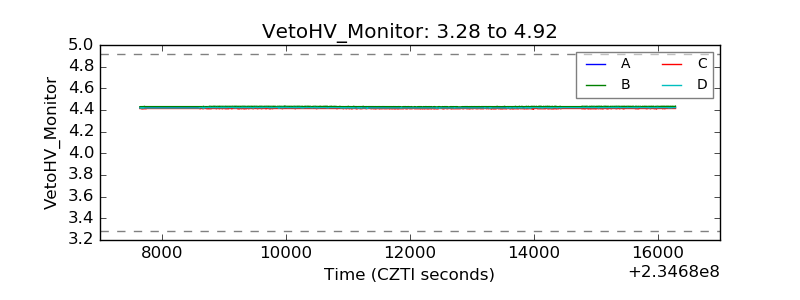 |
| Veto LLD |  |
| Alpha Counter | 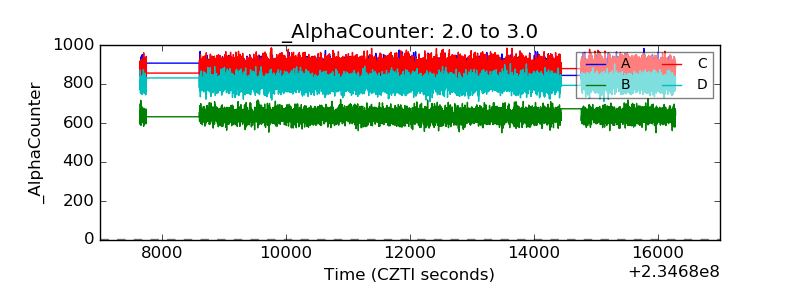 |
| _CPM_Rate | 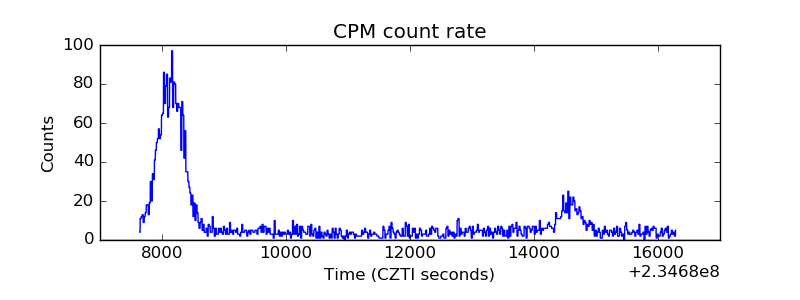 |
| CZT Counter | 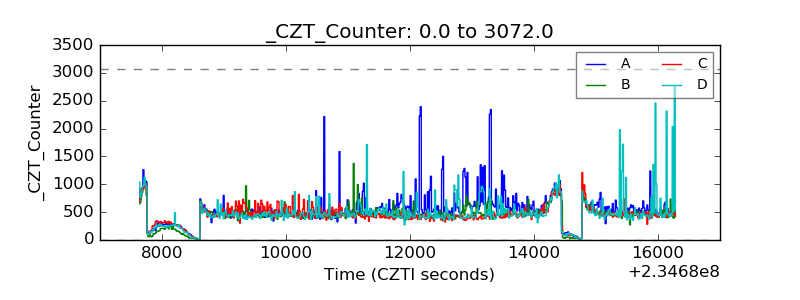 |
| +2.5 Volts monitor |  |
| +5 Volts monitor |  |
| _ROLL_ROT | 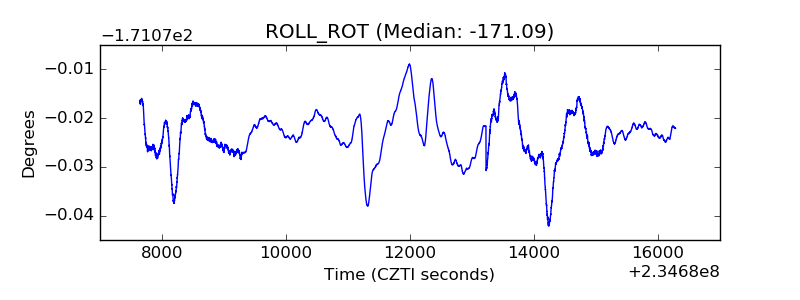 |
| _Roll_DEC | 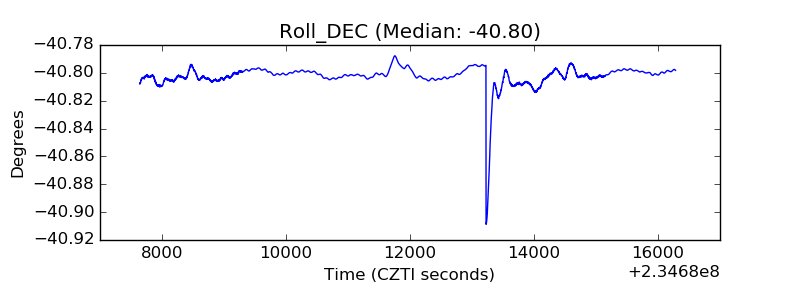 |
| _Roll_RA | 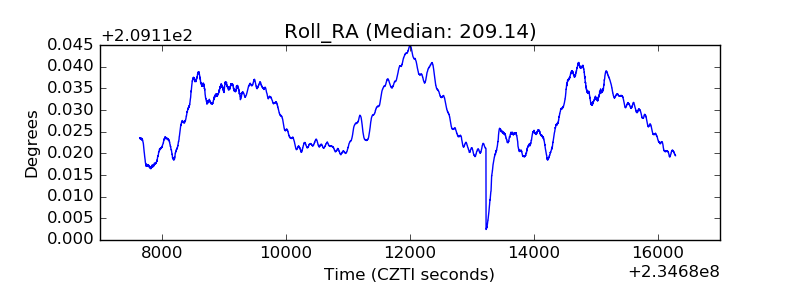 |
| Veto Counter | 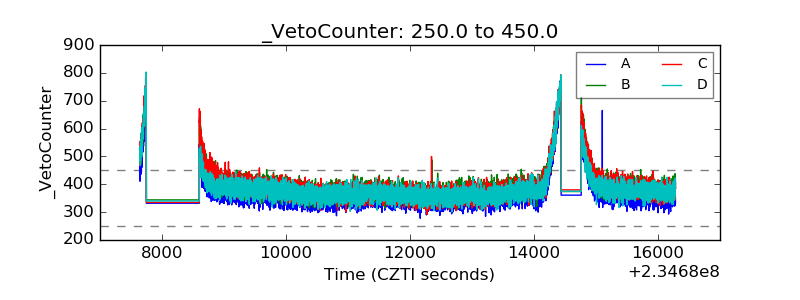 |