| Param | Original file | Final file |
|---|---|---|
| Filename | modeM0/AS1C02_041T02_9000001282_09181cztM0_level2.evt | modeM0/AS1C02_041T02_9000001282_09181cztM0_level2_quad_clean.evt |
| Size (bytes) | 579,559,680 | 85,014,720 |
| Size | 552.7 MB | 81.1 MB |
| Events in quadrant A | 4,667,979 | 510,022 |
| Events in quadrant B | 3,937,868 | 519,394 |
| Events in quadrant C | 3,735,787 | 508,554 |
| Events in quadrant D | 4,669,446 | 482,444 |
| Mode SS | |||
|---|---|---|---|
| Quadrant | BADHDUFLAG | Total packets | Discarded packets |
| A | 0 | 162 | 0 |
| B | 0 | 162 | 0 |
| C | 0 | 162 | 0 |
| D | 0 | 162 | 0 |
| Mode M0 | |||
|---|---|---|---|
| Quadrant | BADHDUFLAG | Total packets | Discarded packets |
| A | 0 | 18890 | 2 |
| B | 0 | 16896 | 1 |
| C | 0 | 16678 | 1 |
| D | 0 | 19356 | 1 |
| Mode M9 | |||
|---|---|---|---|
| Quadrant | BADHDUFLAG | Total packets | Discarded packets |
| A | 0 | 3 | 0 |
| B | 0 | 3 | 0 |
| C | 0 | 3 | 0 |
| D | 0 | 3 | 0 |
| Quadrant | Total seconds | Saturated seconds | Saturation percentage |
|---|---|---|---|
| A | 7963 | 409 | 5.136255% |
| B | 7963 | 390 | 4.897652% |
| C | 7963 | 313 | 3.930679% |
| D | 7963 | 603 | 7.572523% |
Noise dominated data is calculated using 1-second bins in cleaned event files. If a bin has >2000 counts, and if more than 50% of those come from <1% of pixels, then it is considered to be noise-dominated and hence unusable.
| Quadrant | # 1 sec bins | Bins with >0 counts | Bins with >2000 counts | High rate bins dominated by noise | Noise dominated (total time) | Noise dominated (detector-on time) | Marked lightcurve |
|---|---|---|---|---|---|---|---|
| A | 8288 | 7964 | 7 | 7 | 0.08% | 0.09% |  |
| B | 8288 | 7964 | 2 | 2 | 0.02% | 0.03% |  |
| C | 8288 | 7964 | 0 | 0 | 0.00% | 0.00% | 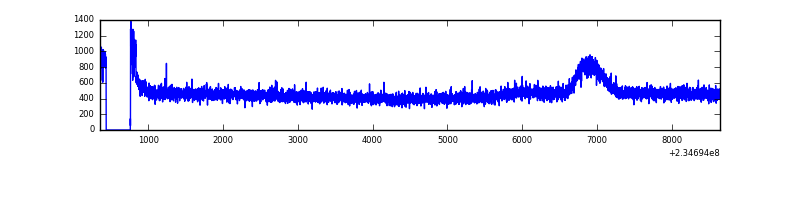 |
| D | 8288 | 7964 | 276 | 276 | 3.33% | 3.47% | 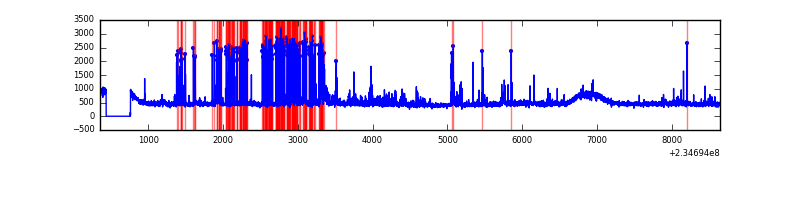 |
Top three noisy pixels from each quadrant. If the there are fewer than three noisy pixels in the level2.evt file, extra rows are filled as -1
| Pixel properties | Quadrant properties | ||||||
|---|---|---|---|---|---|---|---|
| Quadrant | DetID | PixID | Counts | Sigma | Mean | Median | Sigma |
| A | 8 | 5 | 677664 | 3435.22 | 965 | 941 | 197.0 |
| A | 1 | 162 | 144298 | 727.72 | 965 | 941 | 197.0 |
| A | 1 | 178 | 33729 | 166.44 | 965 | 941 | 197.0 |
| B | 8 | 234 | 46945 | 246.33 | 973 | 949 | 186.7 |
| B | 0 | 245 | 27064 | 139.86 | 973 | 949 | 186.7 |
| B | 0 | 214 | 22525 | 115.55 | 973 | 949 | 186.7 |
| C | 9 | 68 | 37530 | 166.02 | 947 | 948 | 220.4 |
| C | 13 | 61 | 7192 | 28.34 | 947 | 948 | 220.4 |
| C | 8 | 222 | 3920 | 13.49 | 947 | 948 | 220.4 |
| D | 1 | 52 | 841875 | 3574.27 | 936 | 905 | 235.3 |
| D | 6 | 225 | 97647 | 411.17 | 936 | 905 | 235.3 |
| D | 2 | 14 | 64997 | 272.4 | 936 | 905 | 235.3 |
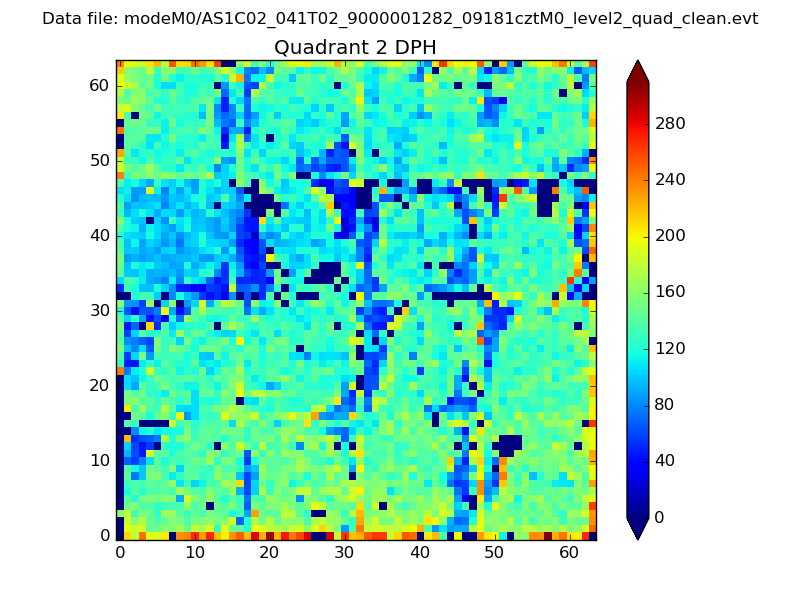
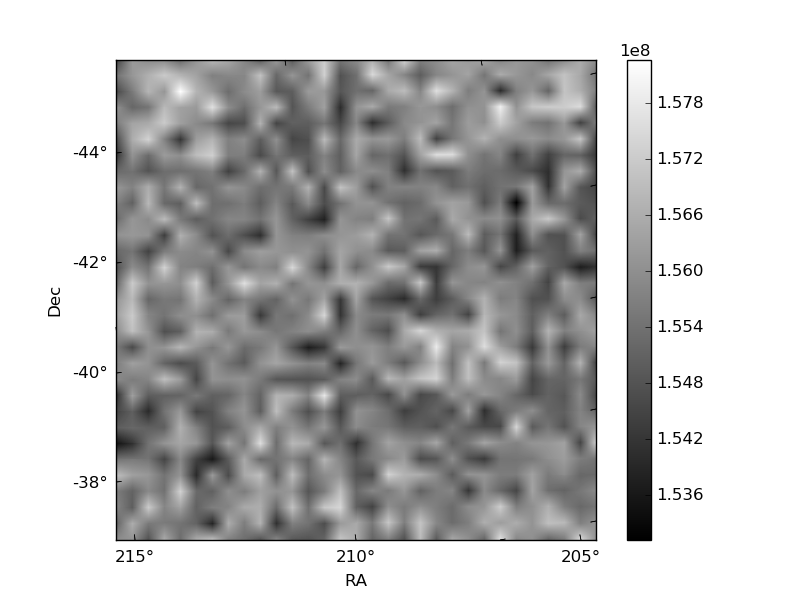
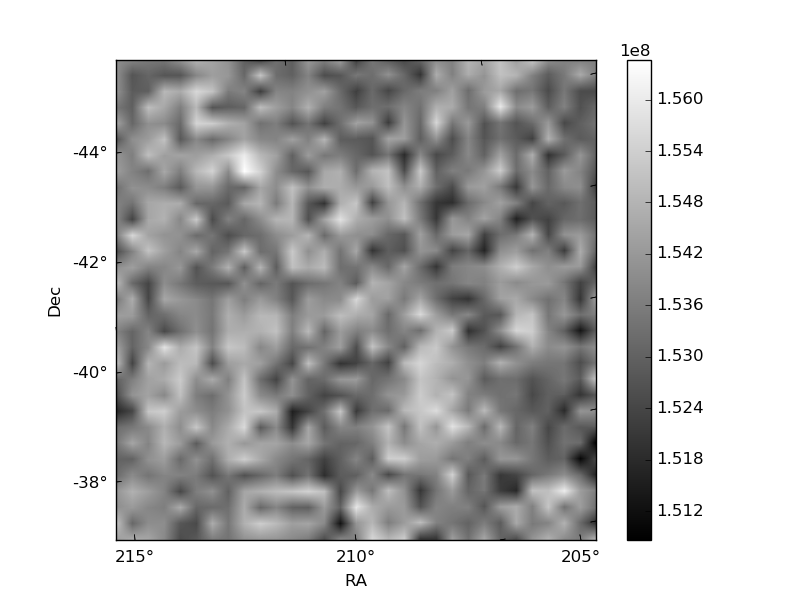
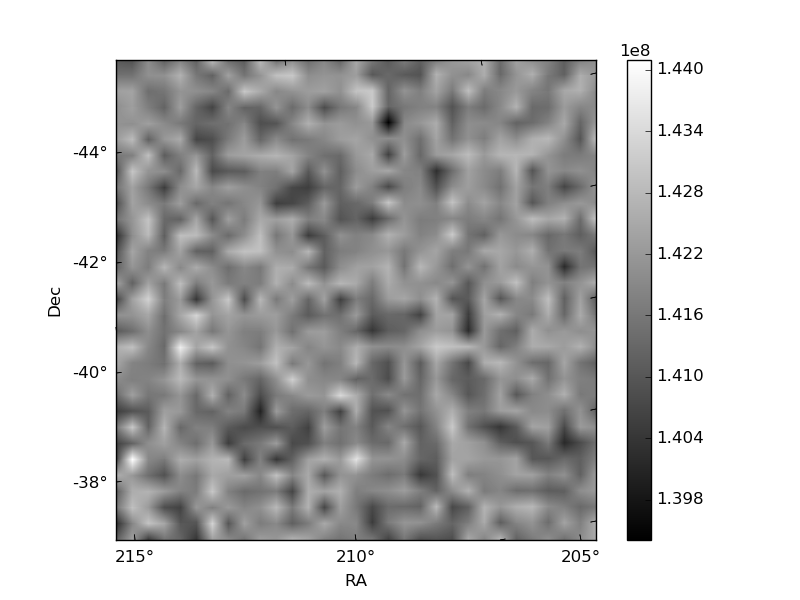
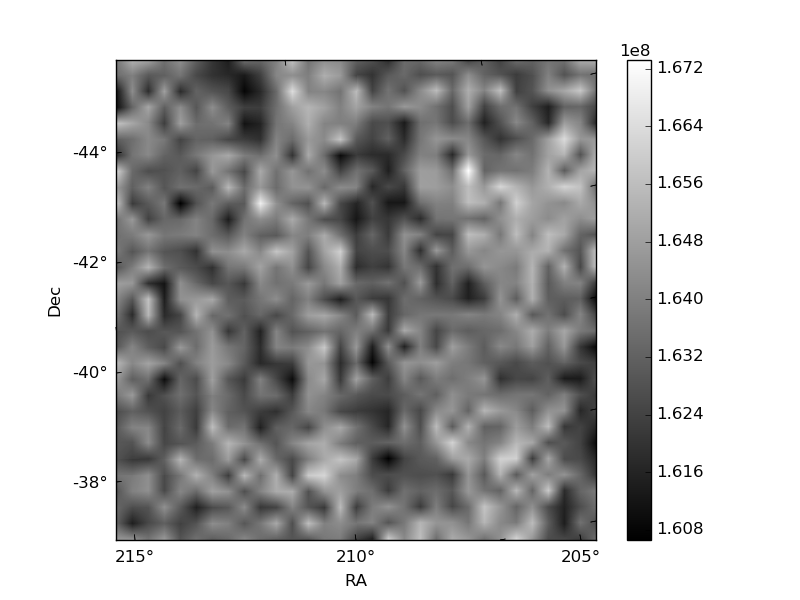
Histogram calculated using DETX and DETY for each event in the final _common_clean file
| Quadrant A | 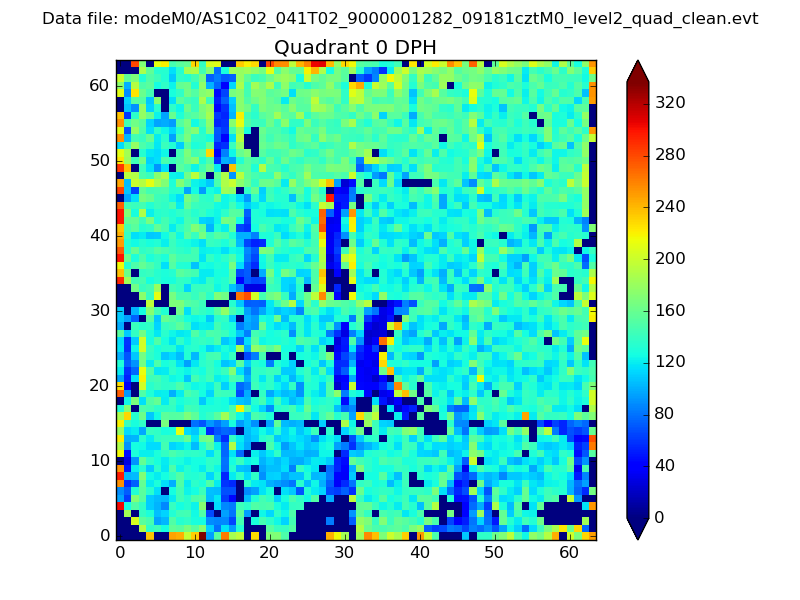 |
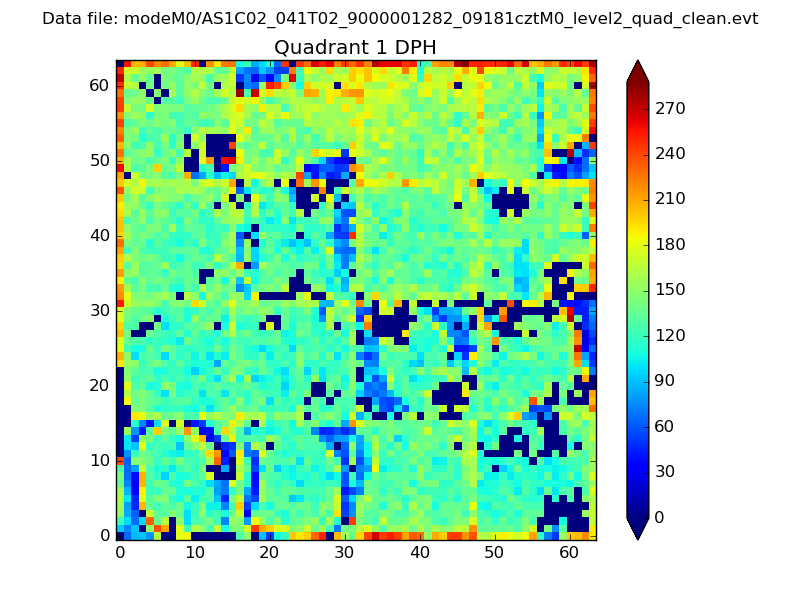 |
Quadrant B |
|---|---|---|---|
| Quadrant D | 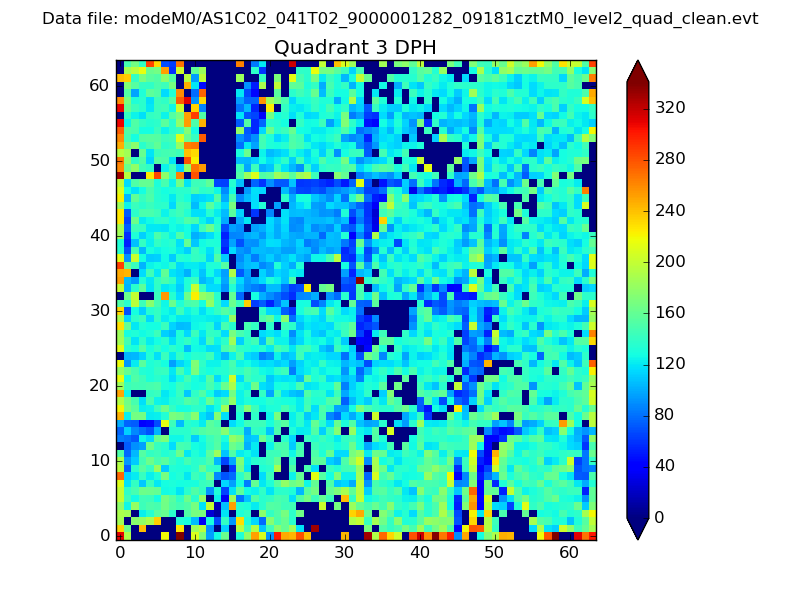 |
 |
Quadrant C |
| Plot type | Count rate plots | Images |
|---|---|---|
| Comparison with Poisson distribution Blue bars denote a histogram of data divided into 1 sec bins. Red curve is a Poisson curve with rate = median count rate of data. |
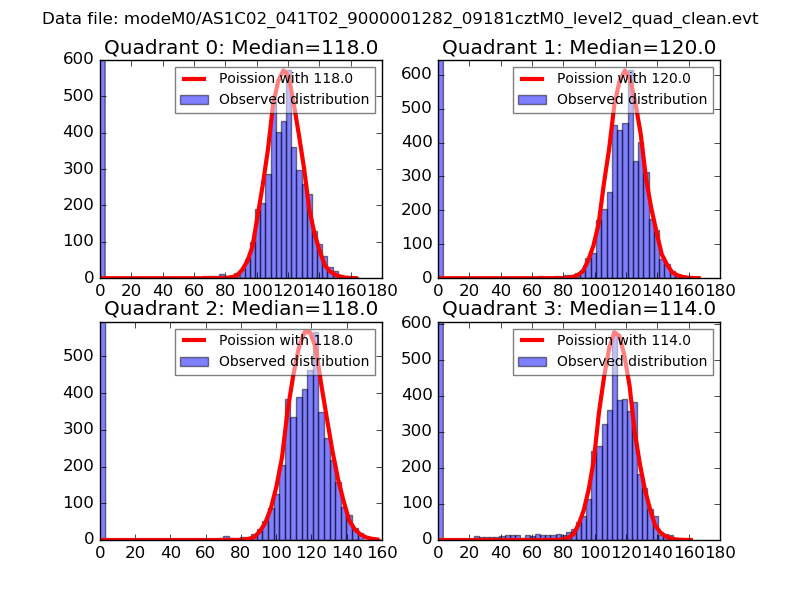 |
 |
| Quadrant-wise count rates Data is divided into 100 sec bins |
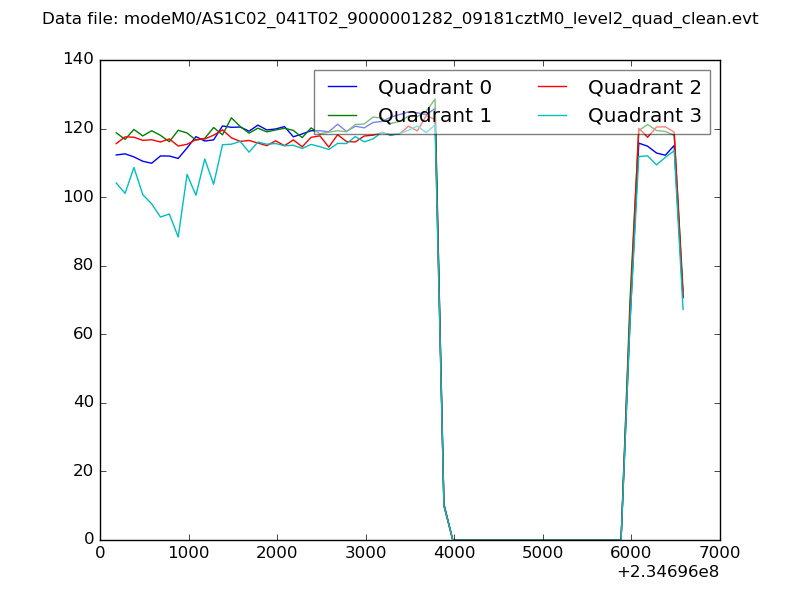 |
|
| Module-wise count rates for Quadrant A Data is divided into 100 sec bins |
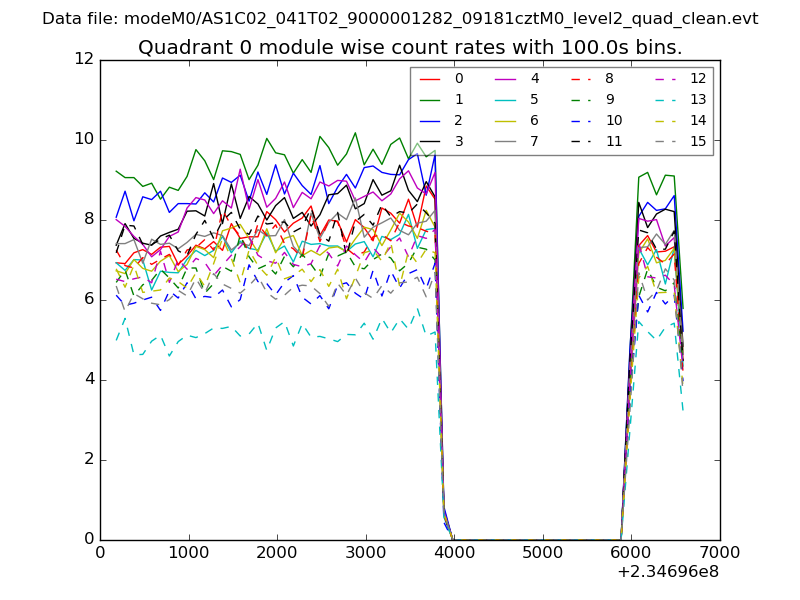 |
 |
| Module-wise count rates for Quadrant B Data is divided into 100 sec bins |
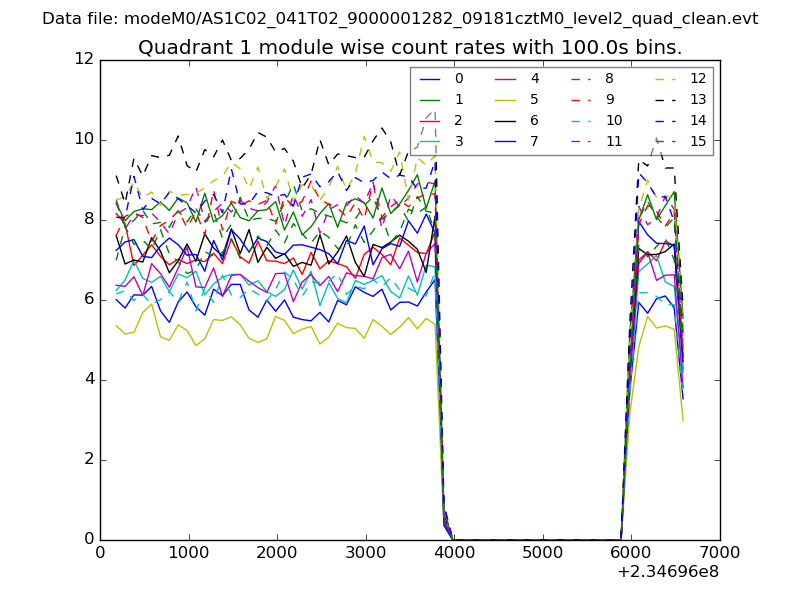 |
 |
| Module-wise count rates for Quadrant C Data is divided into 100 sec bins |
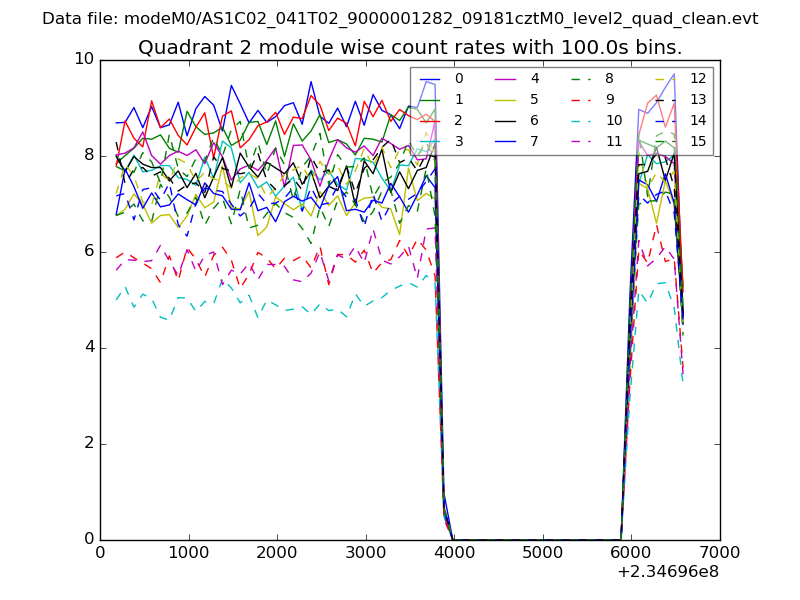 |
 |
| Module-wise count rates for Quadrant D Data is divided into 100 sec bins |
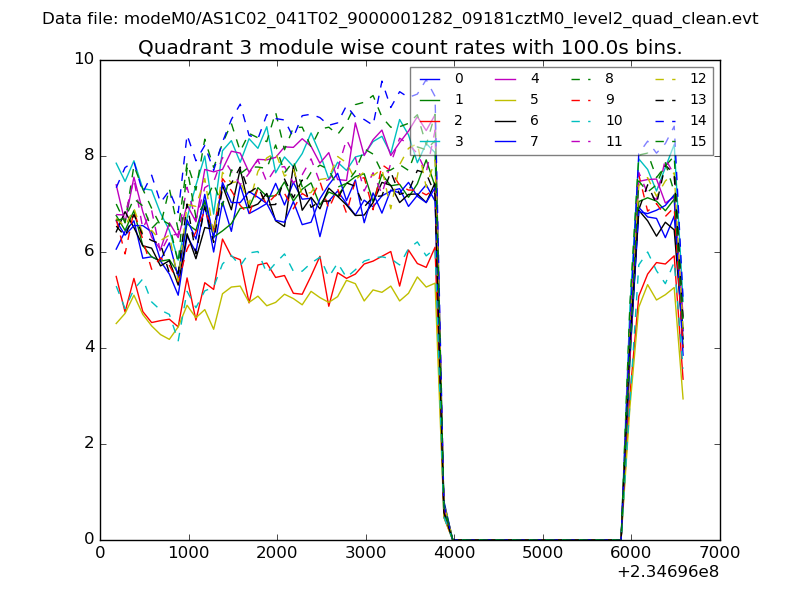 |
 |
| Parameter | Plot |
|---|---|
| CZT HV Monitor |  |
| D_VDD | 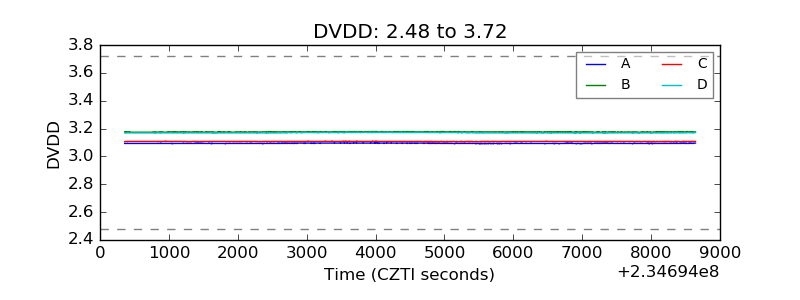 |
| Temperature 1 | 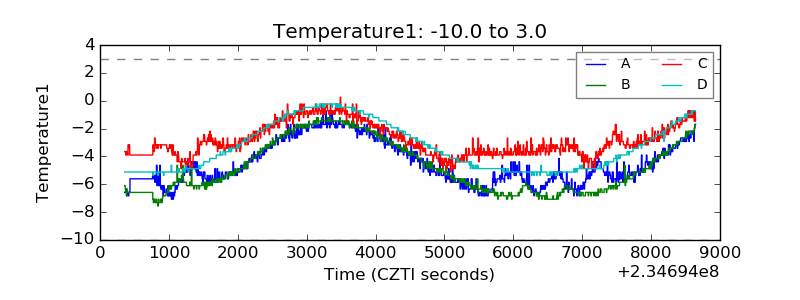 |
| Veto HV Monitor | 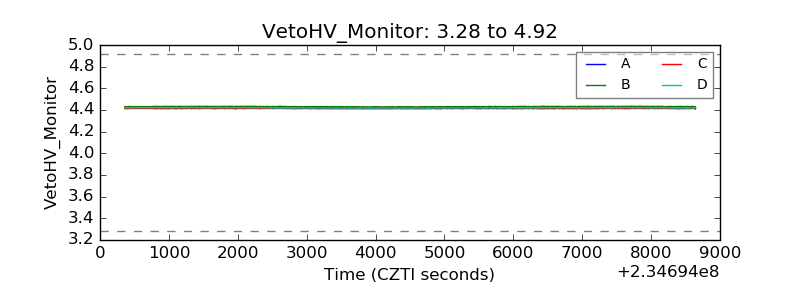 |
| Veto LLD | 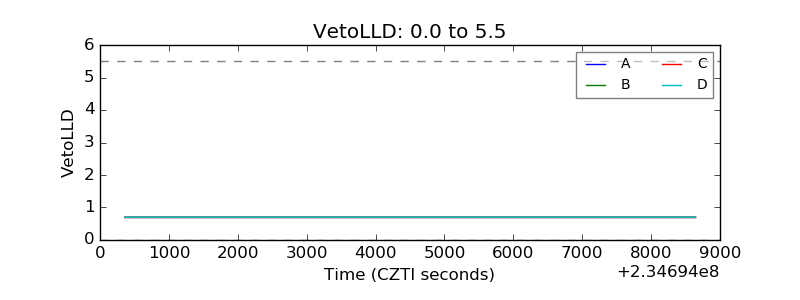 |
| Alpha Counter | 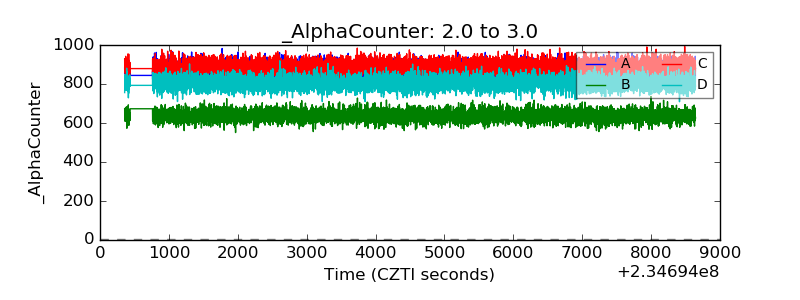 |
| _CPM_Rate | 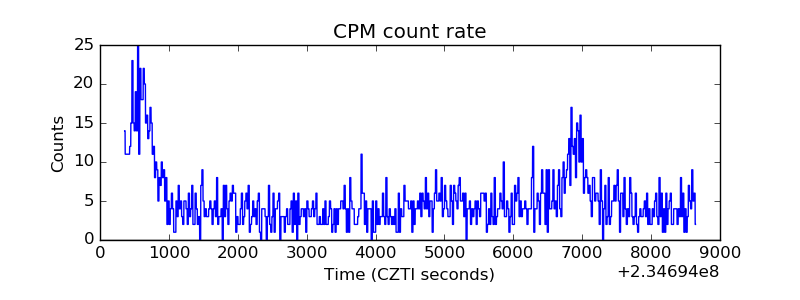 |
| CZT Counter | 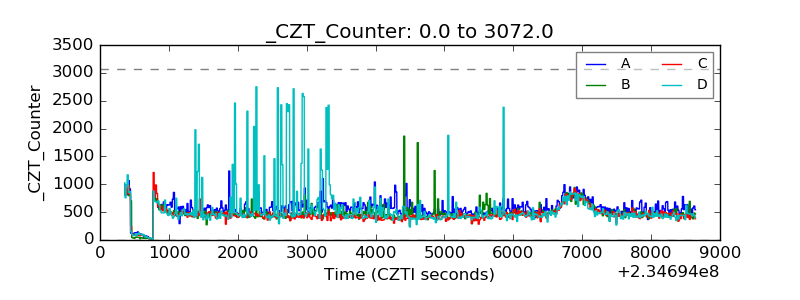 |
| +2.5 Volts monitor |  |
| +5 Volts monitor |  |
| _ROLL_ROT | 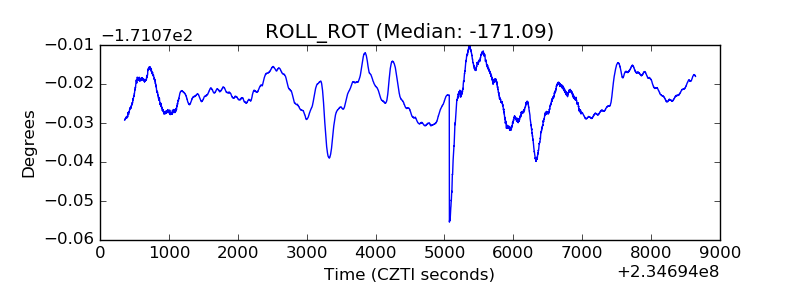 |
| _Roll_DEC | 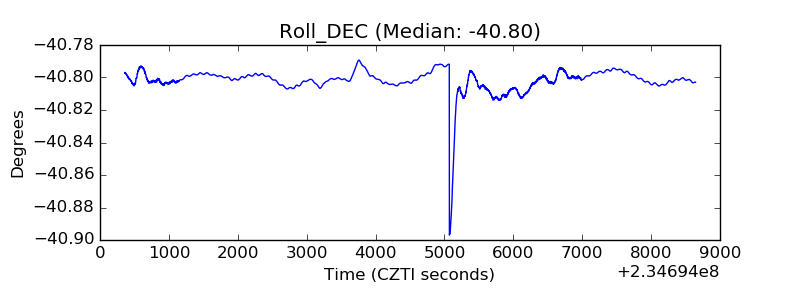 |
| _Roll_RA | 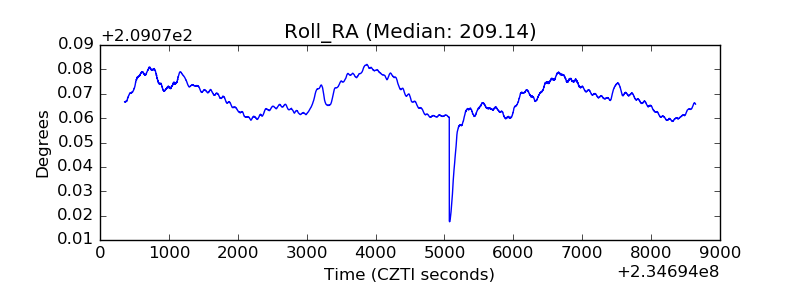 |
| Veto Counter | 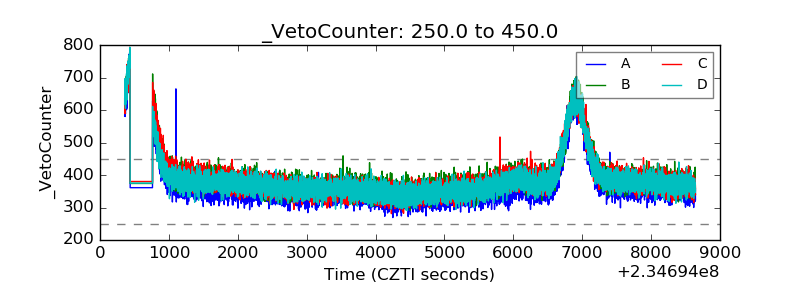 |