| Param | Original file | Final file |
|---|---|---|
| Filename | modeM0/AS1C02_041T02_9000001282_09182cztM0_level2.evt | modeM0/AS1C02_041T02_9000001282_09182cztM0_level2_quad_clean.evt |
| Size (bytes) | 567,648,000 | 91,895,040 |
| Size | 541.4 MB | 87.6 MB |
| Events in quadrant A | 4,828,095 | 562,383 |
| Events in quadrant B | 3,858,311 | 570,114 |
| Events in quadrant C | 3,647,291 | 559,304 |
| Events in quadrant D | 4,322,660 | 543,389 |
| Mode SS | |||
|---|---|---|---|
| Quadrant | BADHDUFLAG | Total packets | Discarded packets |
| A | 0 | 158 | 0 |
| B | 0 | 158 | 0 |
| C | 0 | 158 | 0 |
| D | 0 | 158 | 0 |
| Mode M0 | |||
|---|---|---|---|
| Quadrant | BADHDUFLAG | Total packets | Discarded packets |
| A | 0 | 19380 | 2 |
| B | 0 | 16567 | 1 |
| C | 0 | 16314 | 1 |
| D | 0 | 18300 | 1 |
| Mode M9 | |||
|---|---|---|---|
| Quadrant | BADHDUFLAG | Total packets | Discarded packets |
| A | 0 | 2 | 0 |
| B | 0 | 2 | 0 |
| C | 0 | 2 | 0 |
| D | 0 | 2 | 0 |
| Quadrant | Total seconds | Saturated seconds | Saturation percentage |
|---|---|---|---|
| A | 7876 | 397 | 5.040630% |
| B | 7876 | 366 | 4.647029% |
| C | 7876 | 270 | 3.428136% |
| D | 7876 | 524 | 6.653123% |
Noise dominated data is calculated using 1-second bins in cleaned event files. If a bin has >2000 counts, and if more than 50% of those come from <1% of pixels, then it is considered to be noise-dominated and hence unusable.
| Quadrant | # 1 sec bins | Bins with >0 counts | Bins with >2000 counts | High rate bins dominated by noise | Noise dominated (total time) | Noise dominated (detector-on time) | Marked lightcurve |
|---|---|---|---|---|---|---|---|
| A | 8126 | 7878 | 29 | 29 | 0.36% | 0.37% | 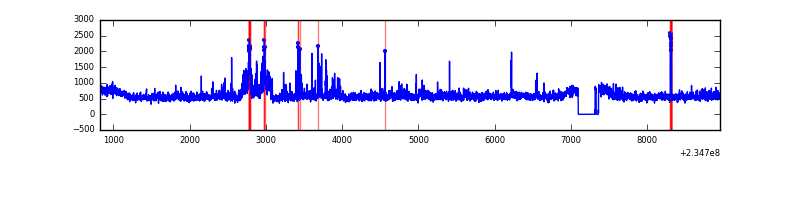 |
| B | 8126 | 7878 | 4 | 4 | 0.05% | 0.05% | 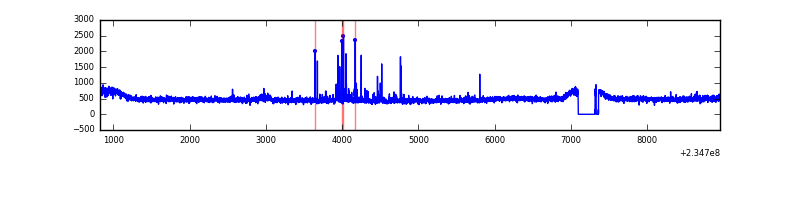 |
| C | 8126 | 7878 | 0 | 0 | 0.00% | 0.00% | 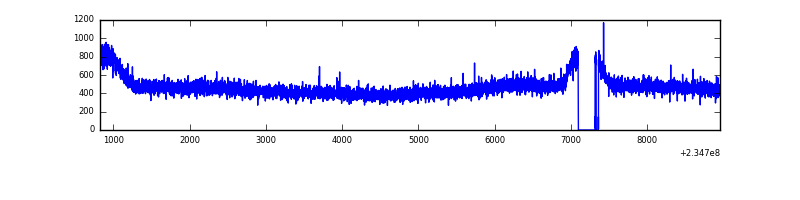 |
| D | 8126 | 7878 | 216 | 216 | 2.66% | 2.74% | 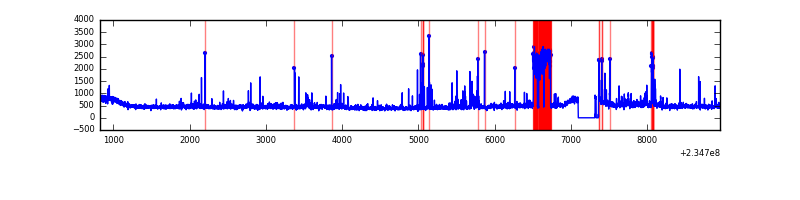 |
Top three noisy pixels from each quadrant. If the there are fewer than three noisy pixels in the level2.evt file, extra rows are filled as -1
| Pixel properties | Quadrant properties | ||||||
|---|---|---|---|---|---|---|---|
| Quadrant | DetID | PixID | Counts | Sigma | Mean | Median | Sigma |
| A | 8 | 5 | 771475 | 3934.7 | 952 | 929 | 195.8 |
| A | 15 | 223 | 123886 | 627.86 | 952 | 929 | 195.8 |
| A | 1 | 162 | 104749 | 530.14 | 952 | 929 | 195.8 |
| B | 8 | 234 | 61993 | 328.79 | 956 | 931 | 185.7 |
| B | 0 | 214 | 25968 | 134.81 | 956 | 931 | 185.7 |
| B | 12 | 111 | 19981 | 102.58 | 956 | 931 | 185.7 |
| C | 13 | 61 | 7062 | 28.21 | 931 | 932 | 217.3 |
| C | 8 | 222 | 6036 | 23.49 | 931 | 932 | 217.3 |
| C | 8 | 128 | 4915 | 18.33 | 931 | 932 | 217.3 |
| D | 1 | 52 | 628679 | 2754.47 | 923 | 893 | 227.9 |
| D | 7 | 71 | 58563 | 253.03 | 923 | 893 | 227.9 |
| D | 2 | 14 | 54174 | 233.78 | 923 | 893 | 227.9 |
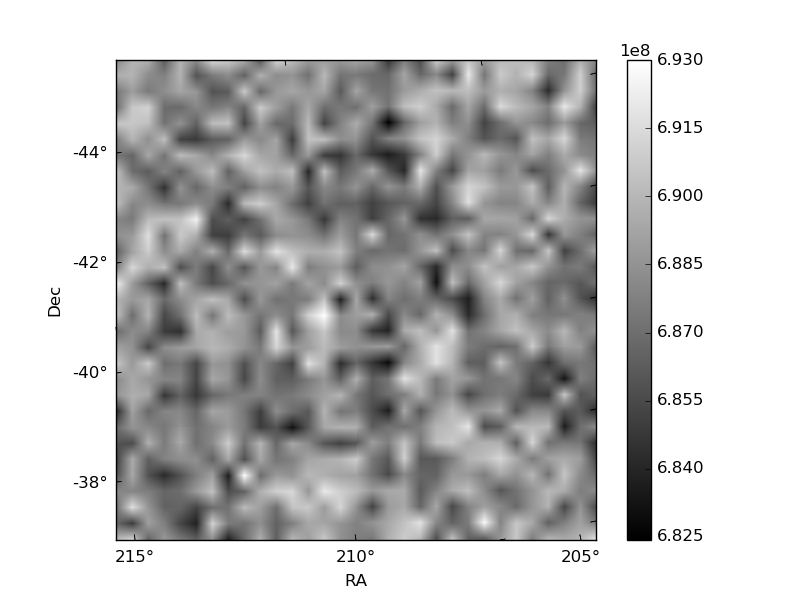
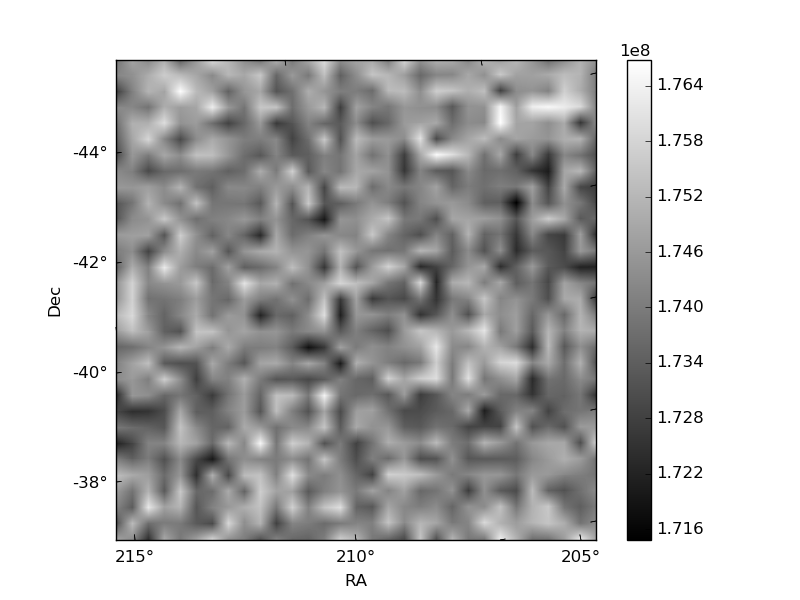
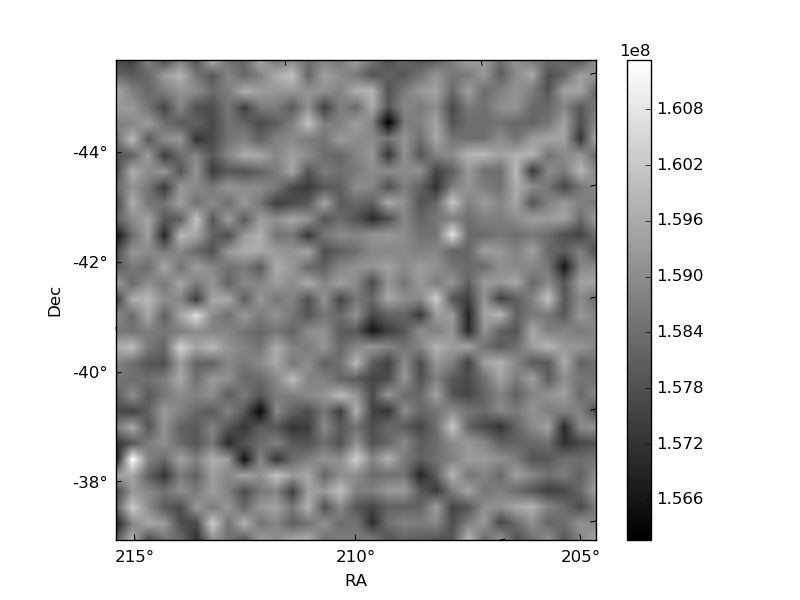
Histogram calculated using DETX and DETY for each event in the final _common_clean file
| Quadrant A | 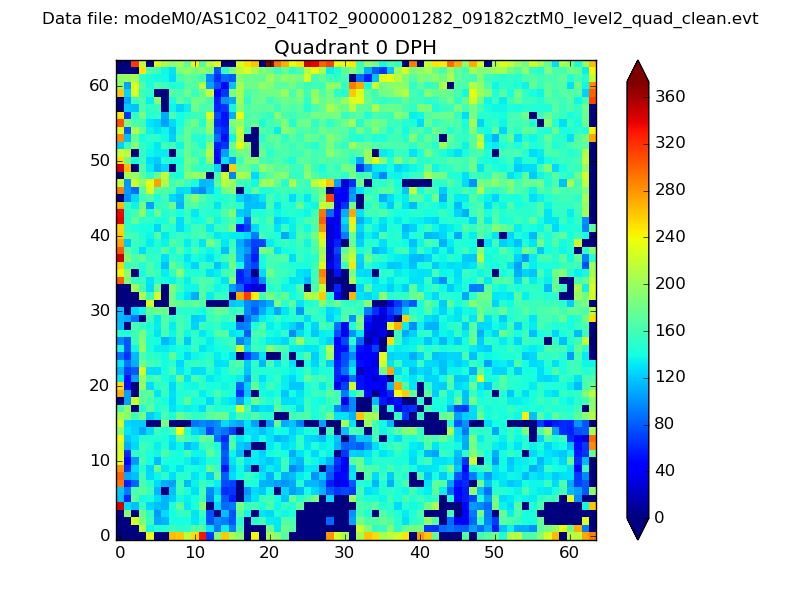 |
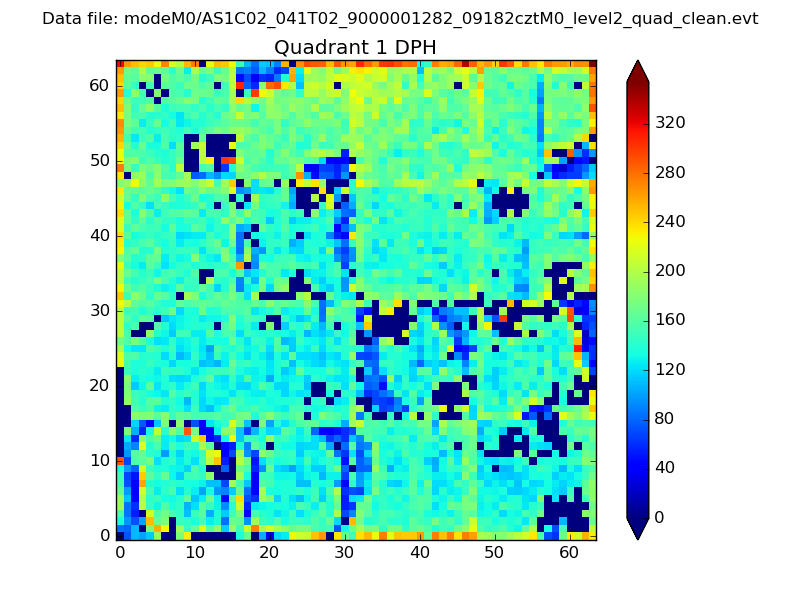 |
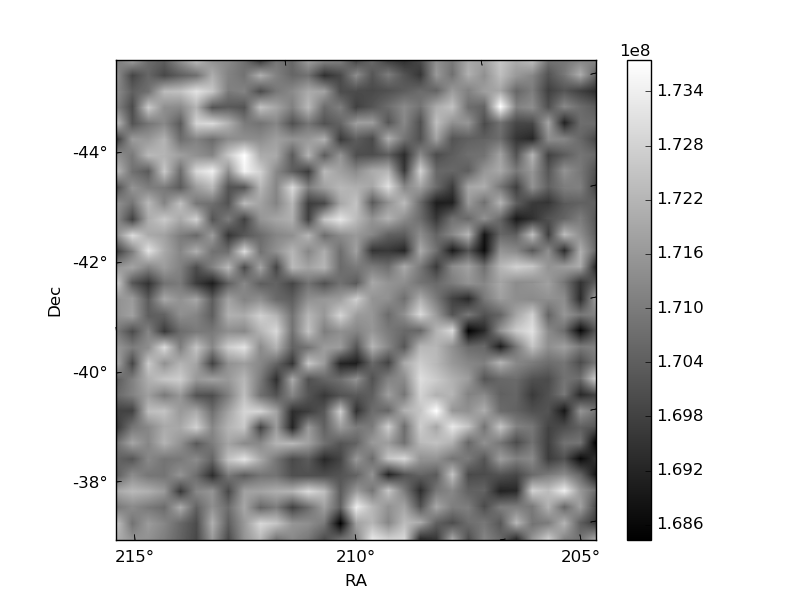
Quadrant B |
|---|---|---|---|
| Quadrant D | 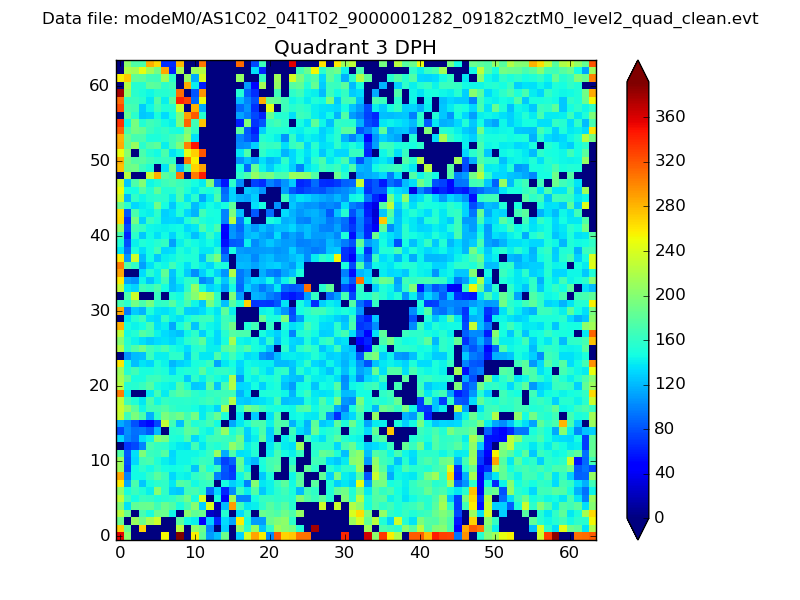 |
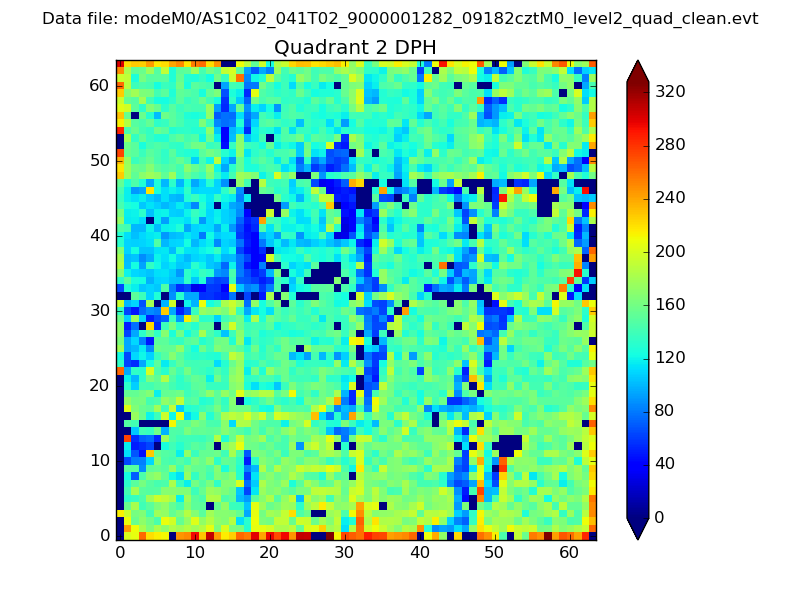 |
Quadrant C |
| Plot type | Count rate plots | Images |
|---|---|---|
| Comparison with Poisson distribution Blue bars denote a histogram of data divided into 1 sec bins. Red curve is a Poisson curve with rate = median count rate of data. |
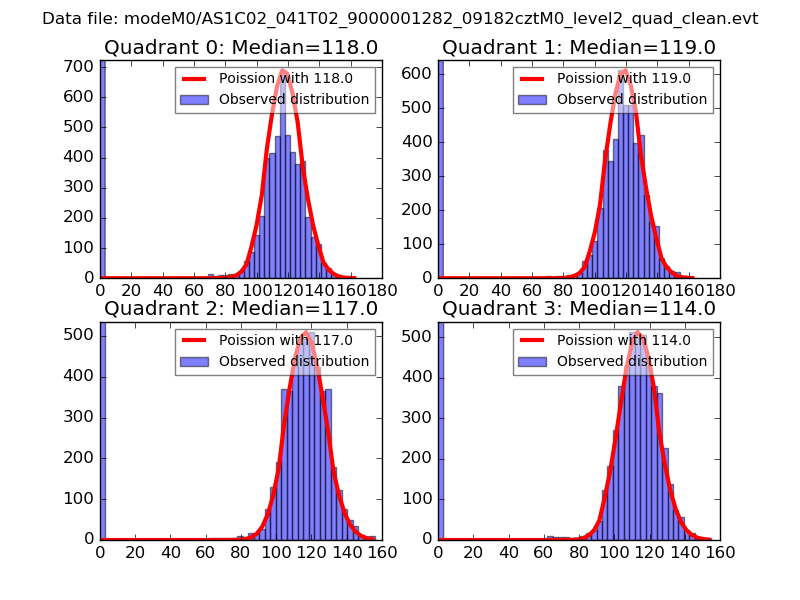 |
 |
| Quadrant-wise count rates Data is divided into 100 sec bins |
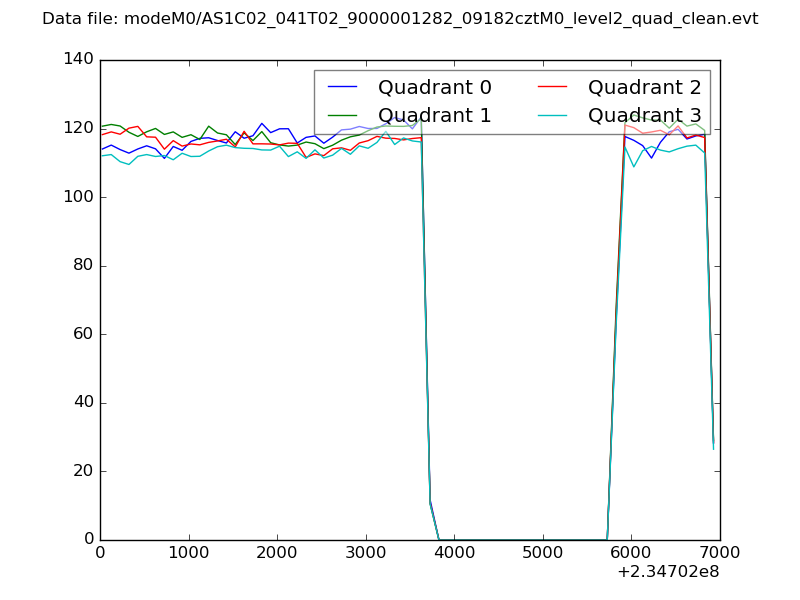 |
|
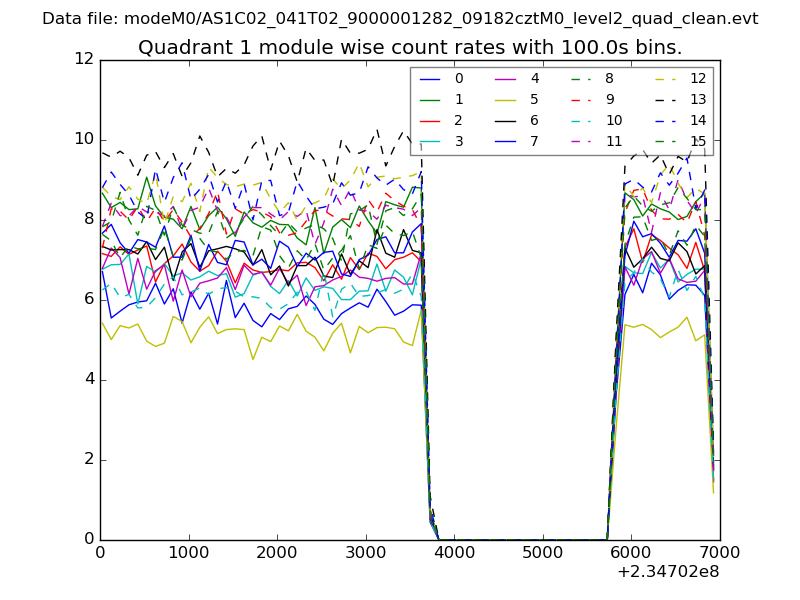
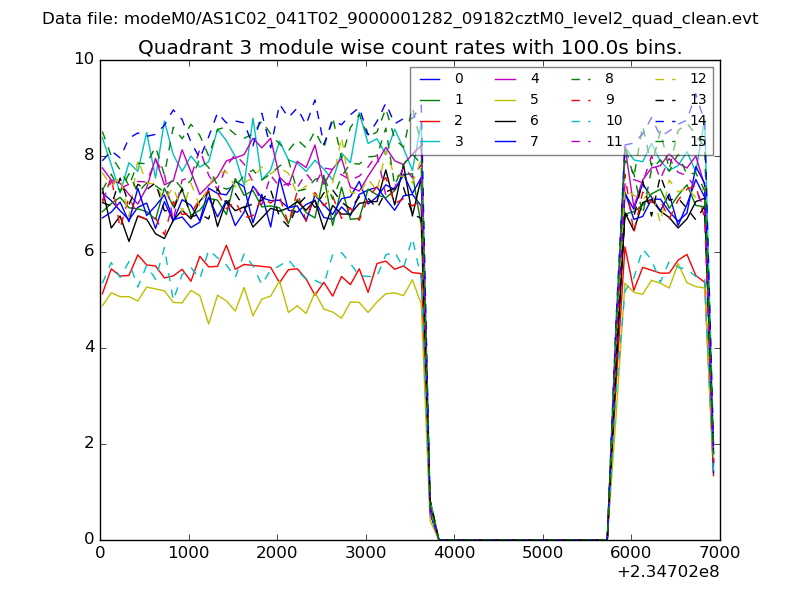
| Module-wise count rates for Quadrant A Data is divided into 100 sec bins |
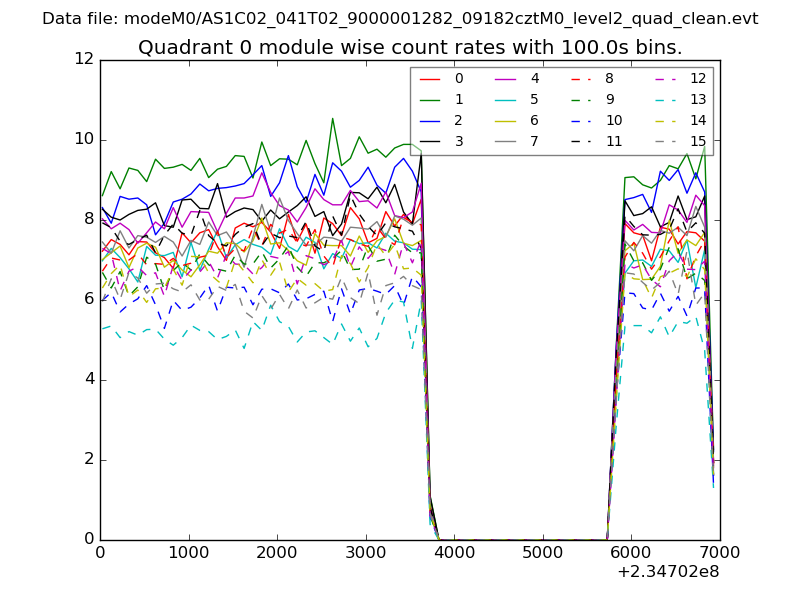 |
 |
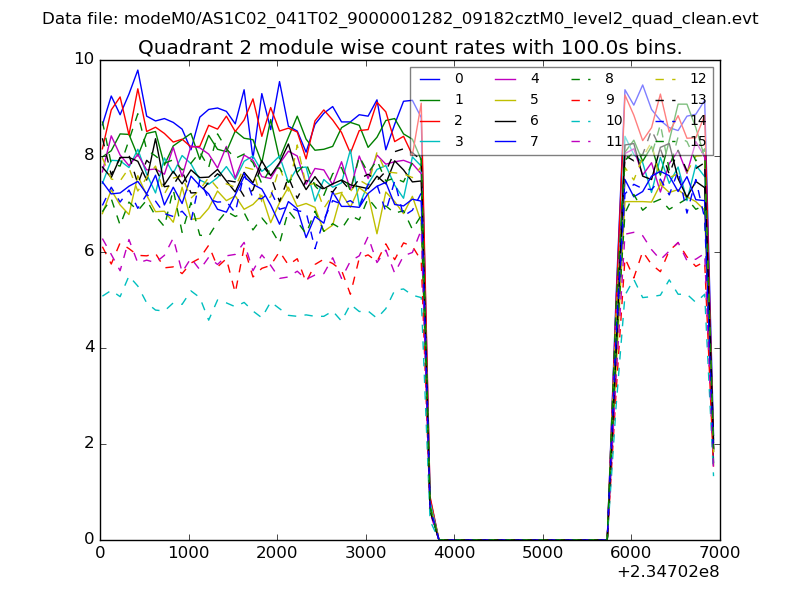
| Module-wise count rates for Quadrant B Data is divided into 100 sec bins |
 |
 |
| Module-wise count rates for Quadrant C Data is divided into 100 sec bins |
 |
 |
| Module-wise count rates for Quadrant D Data is divided into 100 sec bins |
 |
 |
| Parameter | Plot |
|---|---|
| CZT HV Monitor | 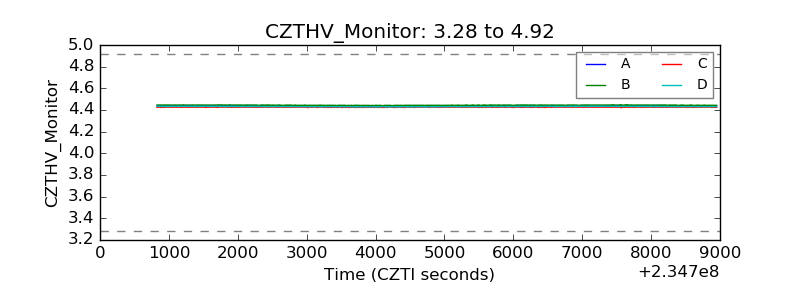 |
| D_VDD | 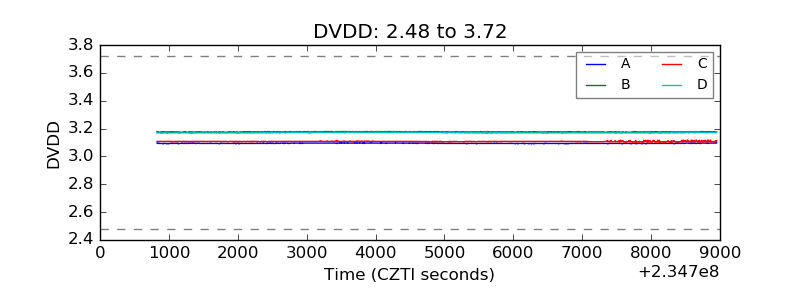 |
| Temperature 1 | 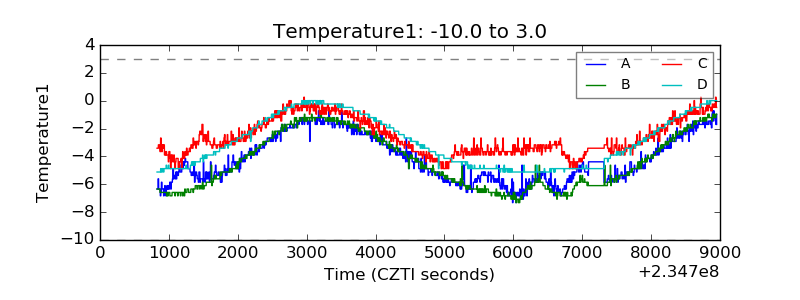 |
| Veto HV Monitor | 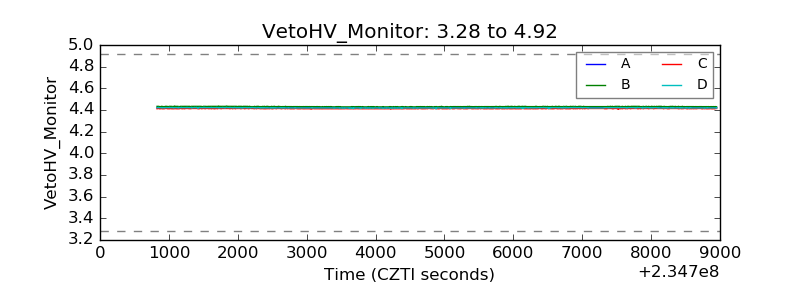 |
| Veto LLD | 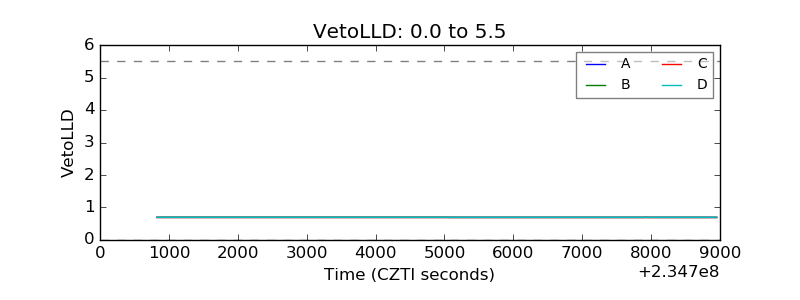 |
| Alpha Counter | 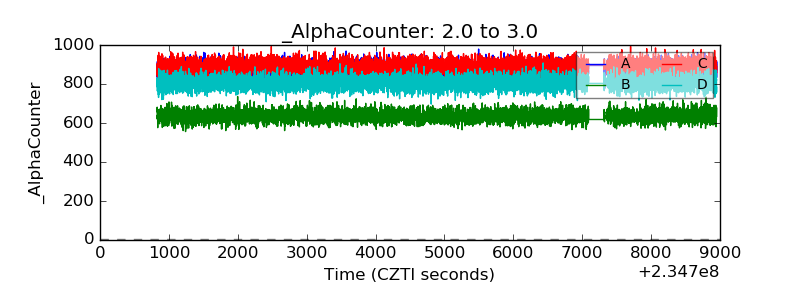 |
| _CPM_Rate | 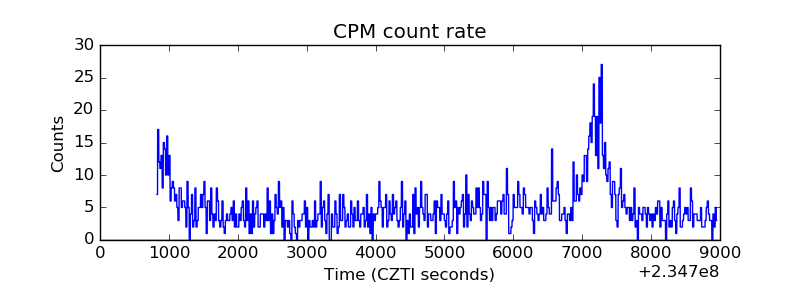 |
| CZT Counter | 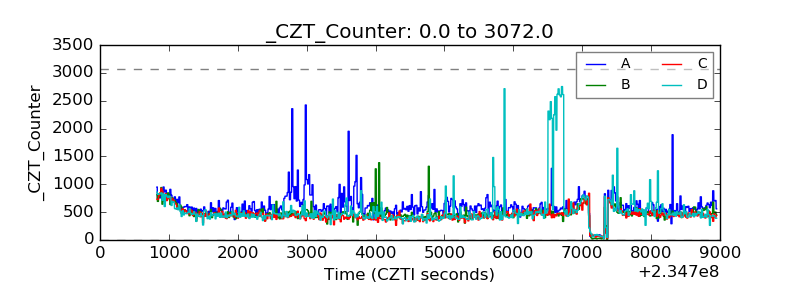 |
| +2.5 Volts monitor |  |
| +5 Volts monitor |  |
| _ROLL_ROT | 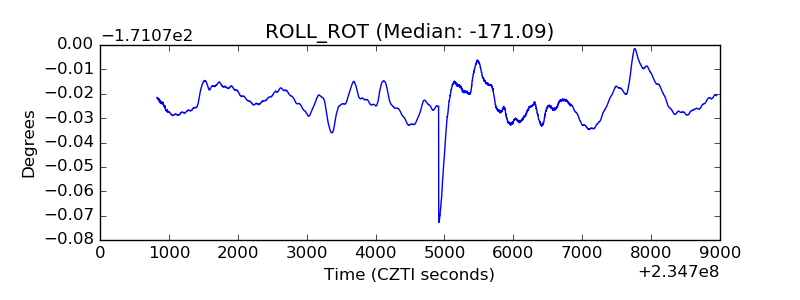 |
| _Roll_DEC | 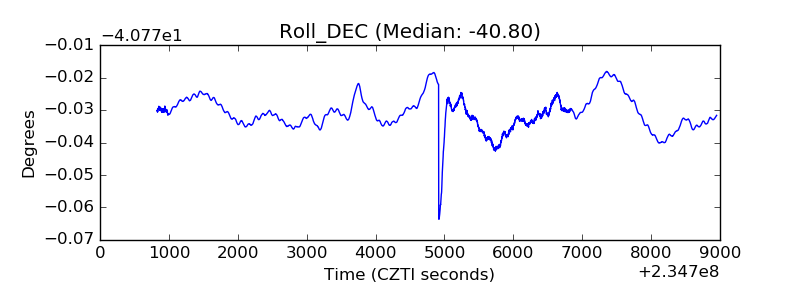 |
| _Roll_RA | 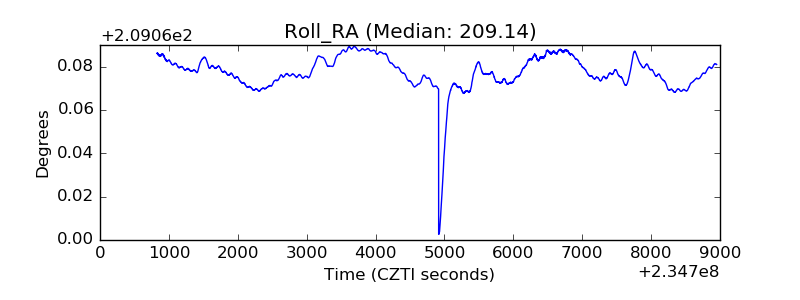 |
| Veto Counter | 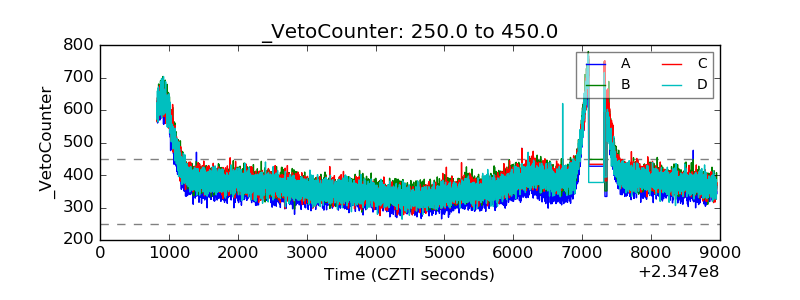 |