| Param | Original file | Final file |
|---|---|---|
| Filename | modeM0/AS1C02_041T02_9000001282_09185cztM0_level2.evt | modeM0/AS1C02_041T02_9000001282_09185cztM0_level2_quad_clean.evt |
| Size (bytes) | 482,961,600 | 86,590,080 |
| Size | 460.6 MB | 82.6 MB |
| Events in quadrant A | 4,468,189 | 547,439 |
| Events in quadrant B | 3,281,845 | 551,944 |
| Events in quadrant C | 2,962,149 | 535,080 |
| Events in quadrant D | 3,462,616 | 523,685 |
| Mode SS | |||
|---|---|---|---|
| Quadrant | BADHDUFLAG | Total packets | Discarded packets |
| A | 0 | 134 | 0 |
| B | 0 | 134 | 0 |
| C | 0 | 134 | 0 |
| D | 0 | 134 | 0 |
| Mode M0 | |||
|---|---|---|---|
| Quadrant | BADHDUFLAG | Total packets | Discarded packets |
| A | 0 | 17925 | 2 |
| B | 0 | 14034 | 1 |
| C | 0 | 13542 | 1 |
| D | 0 | 14941 | 1 |
| Mode M9 | |||
|---|---|---|---|
| Quadrant | BADHDUFLAG | Total packets | Discarded packets |
| A | 0 | 9 | 0 |
| B | 0 | 9 | 0 |
| C | 0 | 9 | 0 |
| D | 0 | 9 | 0 |
| Quadrant | Total seconds | Saturated seconds | Saturation percentage |
|---|---|---|---|
| A | 6659 | 60 | 0.901036% |
| B | 6659 | 26 | 0.390449% |
| C | 6659 | 18 | 0.270311% |
| D | 6659 | 104 | 1.561796% |
Noise dominated data is calculated using 1-second bins in cleaned event files. If a bin has >2000 counts, and if more than 50% of those come from <1% of pixels, then it is considered to be noise-dominated and hence unusable.
| Quadrant | # 1 sec bins | Bins with >0 counts | Bins with >2000 counts | High rate bins dominated by noise | Noise dominated (total time) | Noise dominated (detector-on time) | Marked lightcurve |
|---|---|---|---|---|---|---|---|
| A | 7519 | 6660 | 18 | 18 | 0.24% | 0.27% | 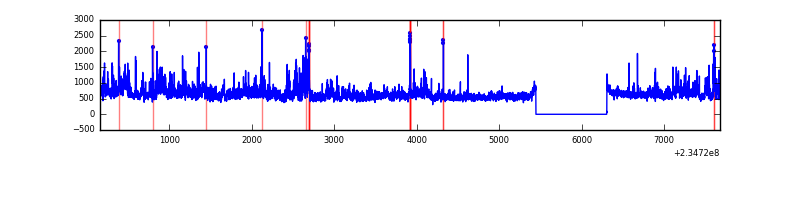 |
| B | 7519 | 6660 | 4 | 4 | 0.05% | 0.06% | 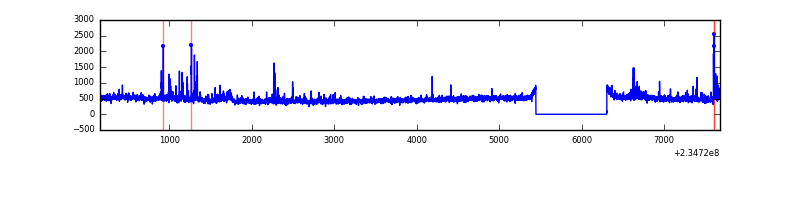 |
| C | 7519 | 6660 | 10 | 10 | 0.13% | 0.15% | 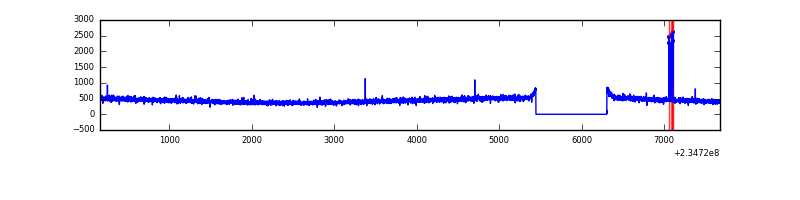 |
| D | 7519 | 6660 | 79 | 79 | 1.05% | 1.19% | 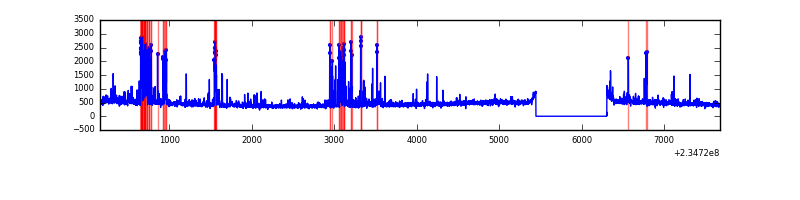 |
Top three noisy pixels from each quadrant. If the there are fewer than three noisy pixels in the level2.evt file, extra rows are filled as -1
| Pixel properties | Quadrant properties | ||||||
|---|---|---|---|---|---|---|---|
| Quadrant | DetID | PixID | Counts | Sigma | Mean | Median | Sigma |
| A | 8 | 5 | 991072 | 6181.01 | 783 | 765 | 160.2 |
| A | 1 | 162 | 161542 | 1003.49 | 783 | 765 | 160.2 |
| A | 15 | 223 | 113069 | 700.94 | 783 | 765 | 160.2 |
| B | 8 | 234 | 105330 | 689.66 | 787 | 767 | 151.6 |
| B | 0 | 230 | 43704 | 283.2 | 787 | 767 | 151.6 |
| B | 0 | 214 | 28243 | 181.22 | 787 | 767 | 151.6 |
| C | 14 | 234 | 31125 | 172.89 | 750 | 753 | 175.7 |
| C | 13 | 61 | 5948 | 29.57 | 750 | 753 | 175.7 |
| C | 8 | 222 | 4299 | 20.19 | 750 | 753 | 175.7 |
| D | 9 | 64 | 298479 | 1606.24 | 754 | 731 | 185.4 |
| D | 1 | 52 | 87139 | 466.14 | 754 | 731 | 185.4 |
| D | 2 | 14 | 80108 | 428.21 | 754 | 731 | 185.4 |
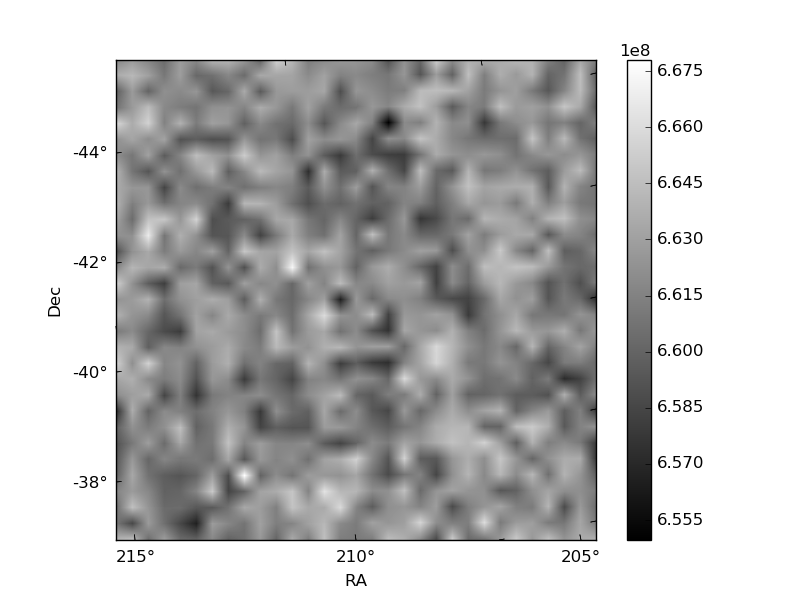
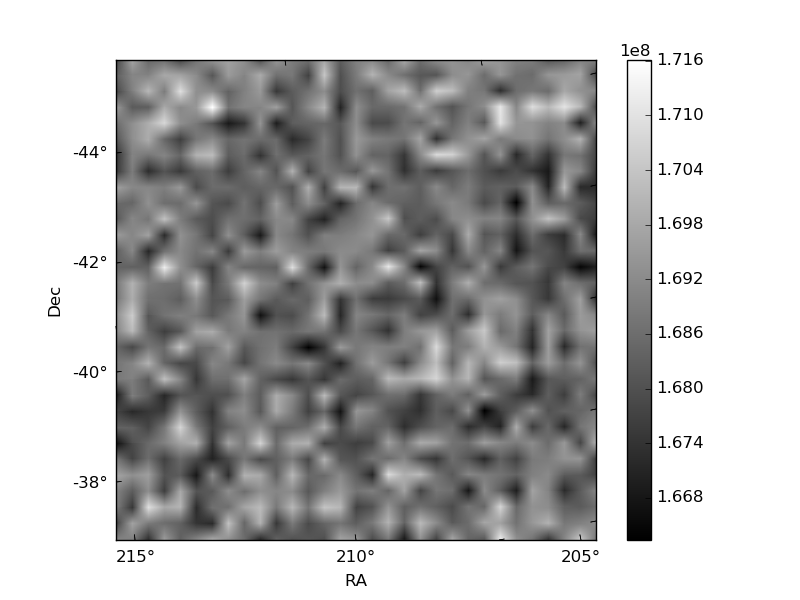
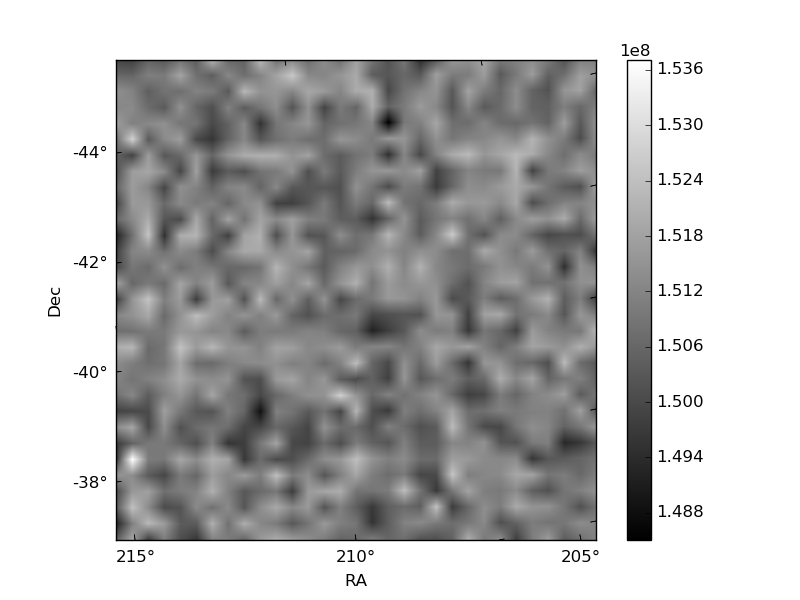
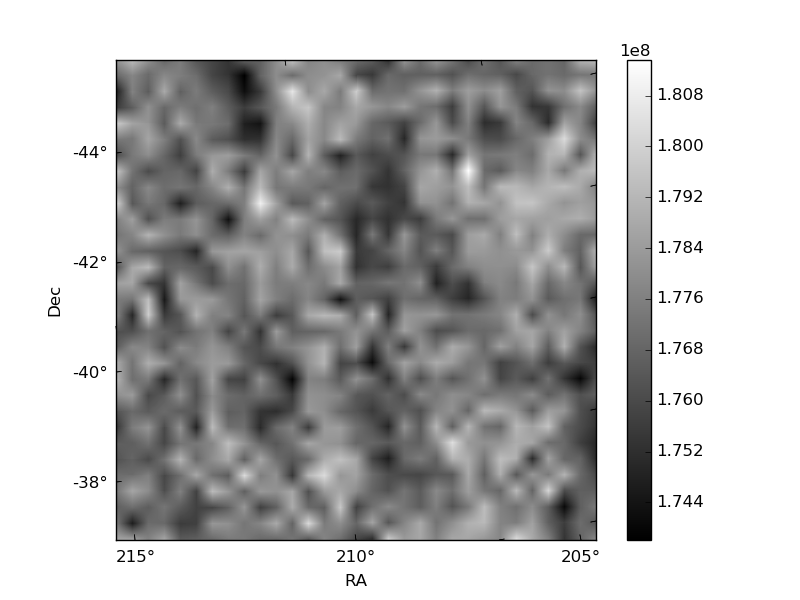
Histogram calculated using DETX and DETY for each event in the final _common_clean file
| Quadrant A | 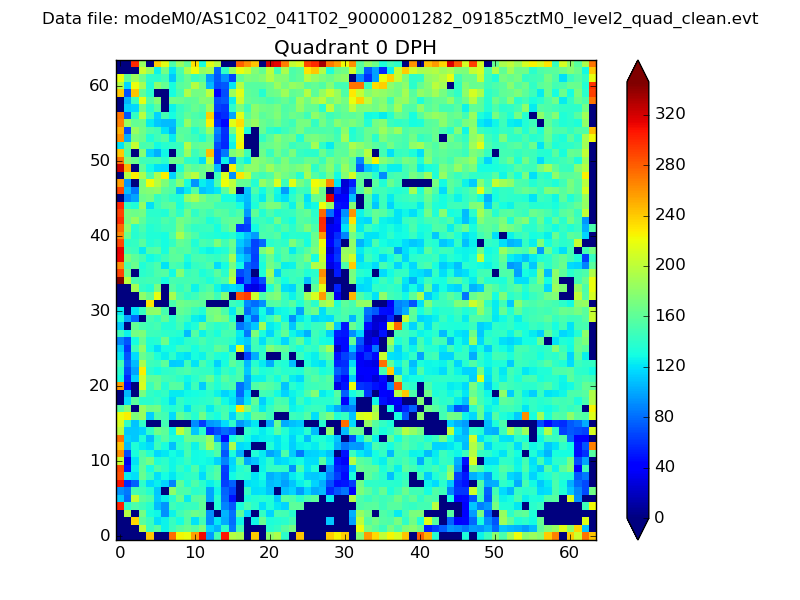 |
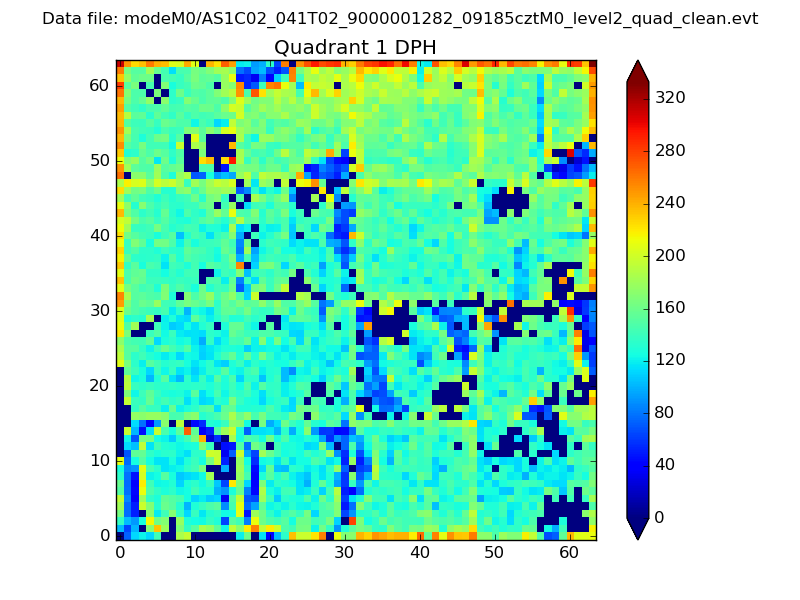 |
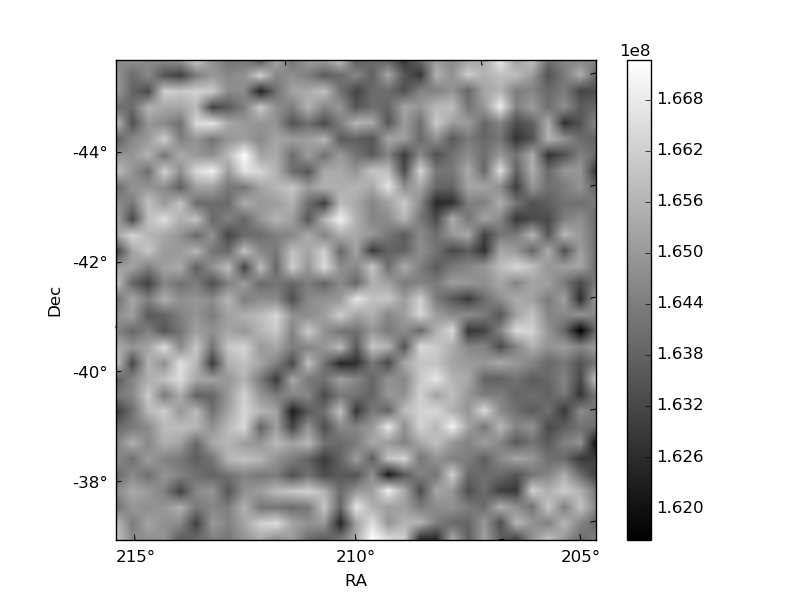
Quadrant B |
|---|---|---|---|
| Quadrant D | 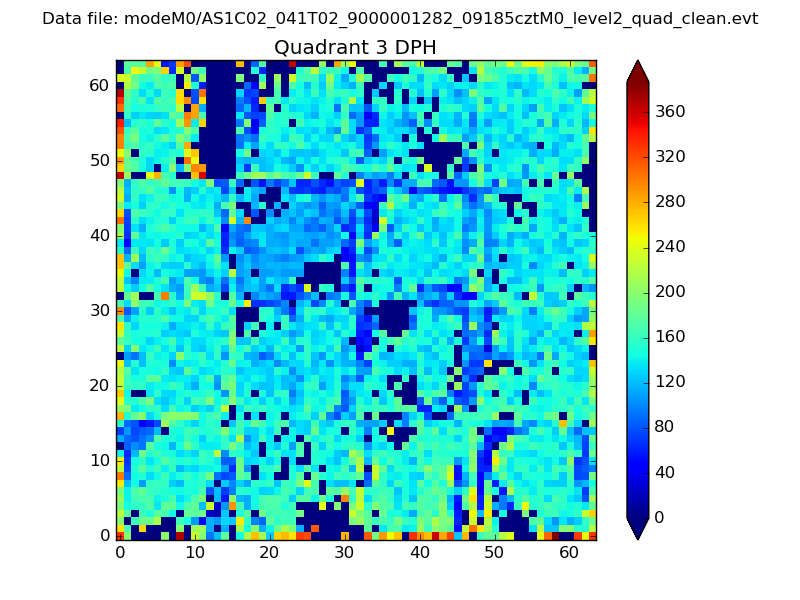 |
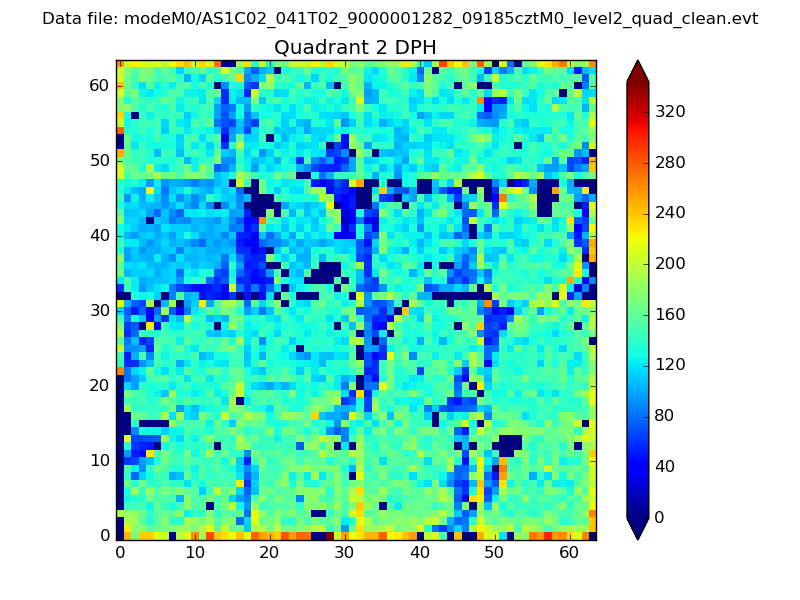 |
Quadrant C |
| Plot type | Count rate plots | Images |
|---|---|---|
| Comparison with Poisson distribution Blue bars denote a histogram of data divided into 1 sec bins. Red curve is a Poisson curve with rate = median count rate of data. |
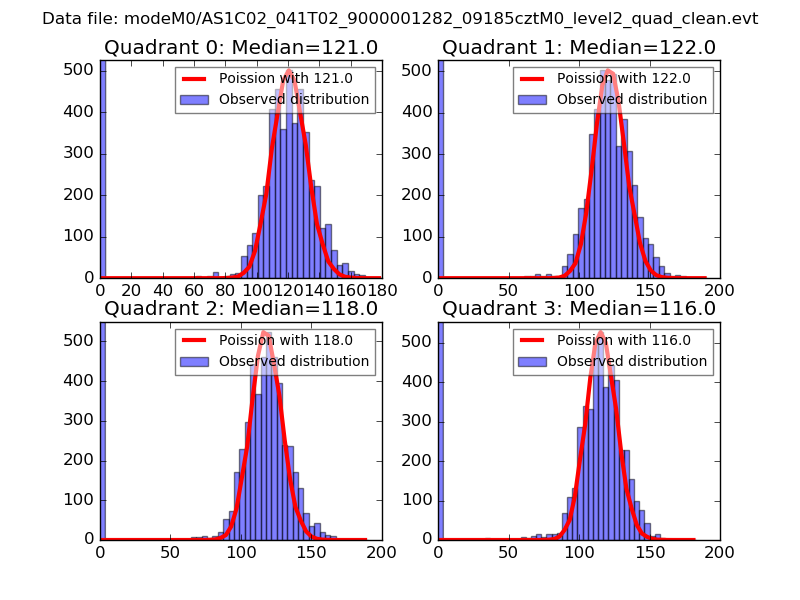 |
 |
| Quadrant-wise count rates Data is divided into 100 sec bins |
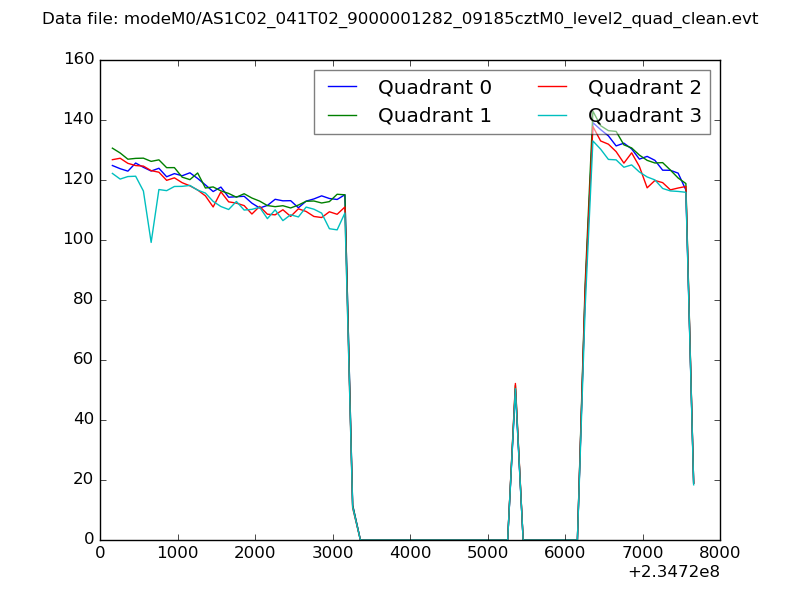 |
|
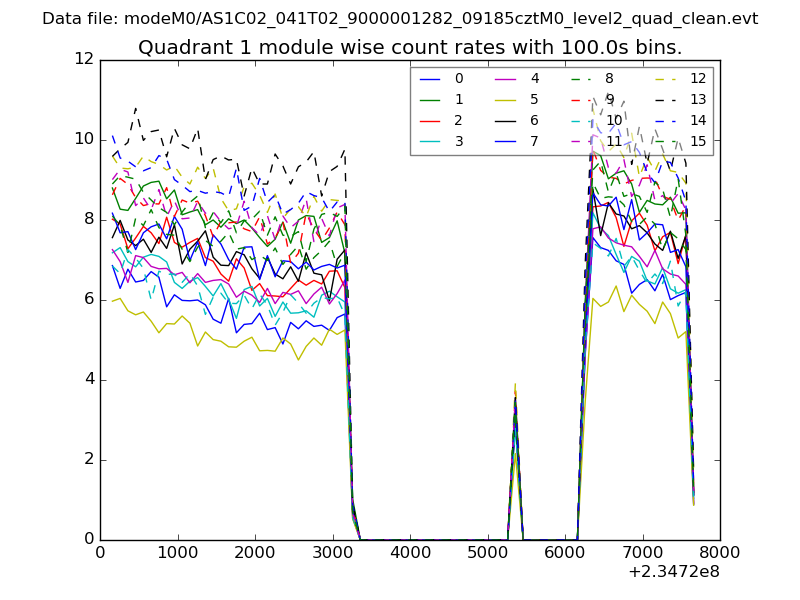
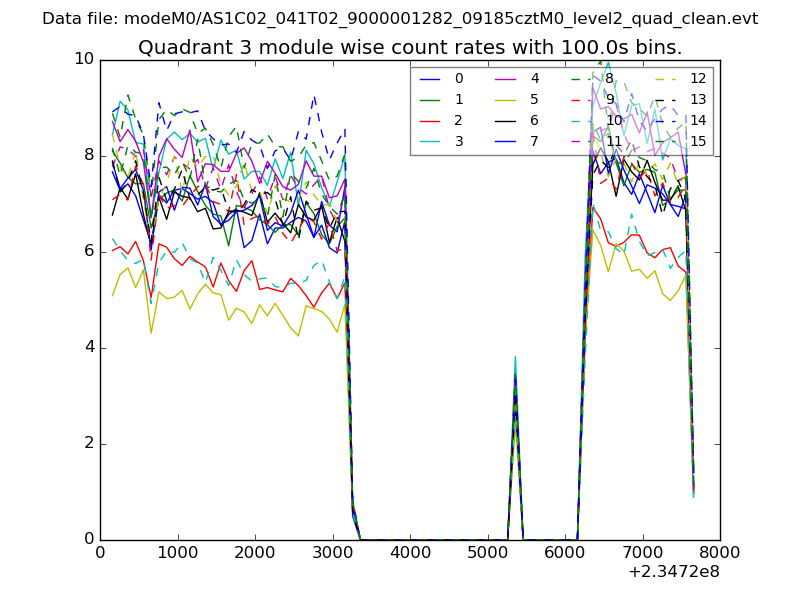
| Module-wise count rates for Quadrant A Data is divided into 100 sec bins |
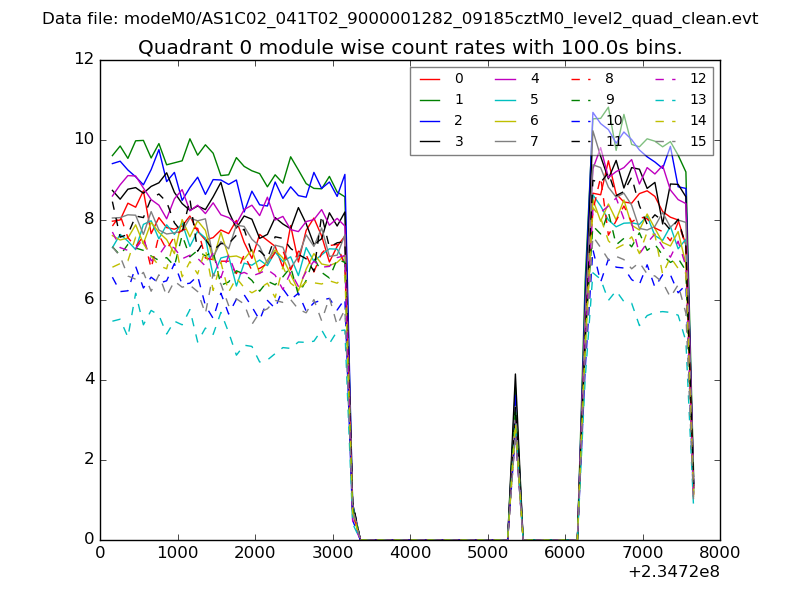 |
 |
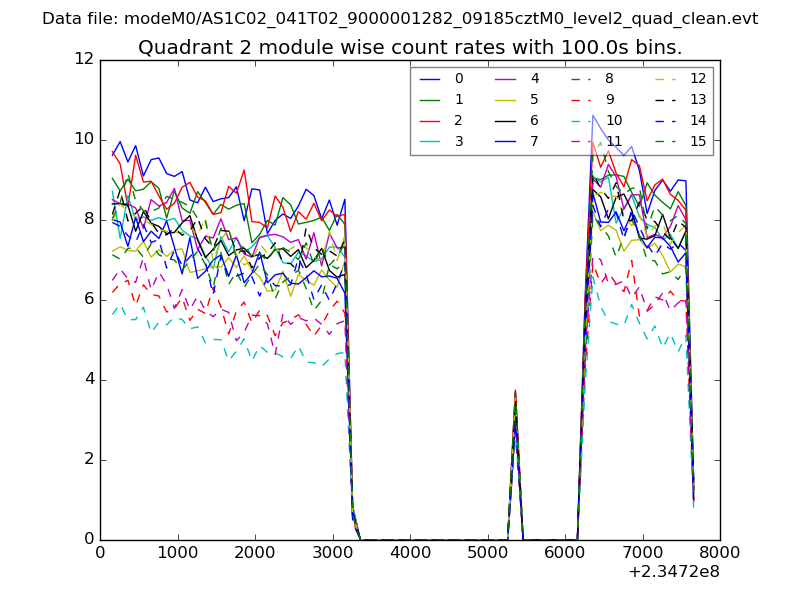
| Module-wise count rates for Quadrant B Data is divided into 100 sec bins |
 |
 |
| Module-wise count rates for Quadrant C Data is divided into 100 sec bins |
 |
 |
| Module-wise count rates for Quadrant D Data is divided into 100 sec bins |
 |
 |
| Parameter | Plot |
|---|---|
| CZT HV Monitor | 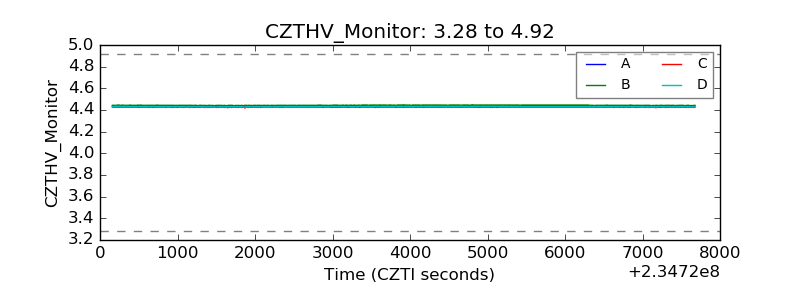 |
| D_VDD | 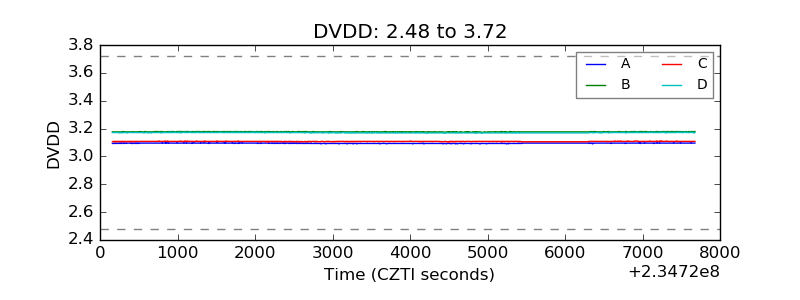 |
| Temperature 1 | 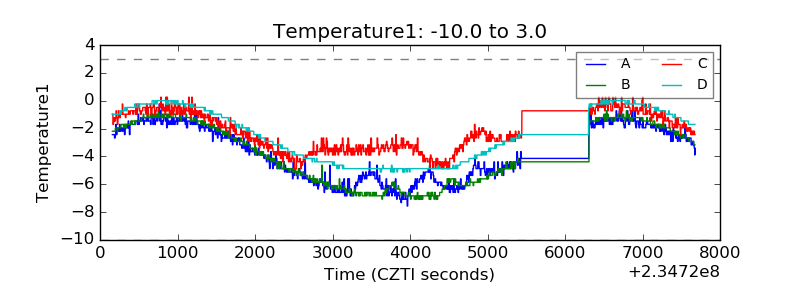 |
| Veto HV Monitor | 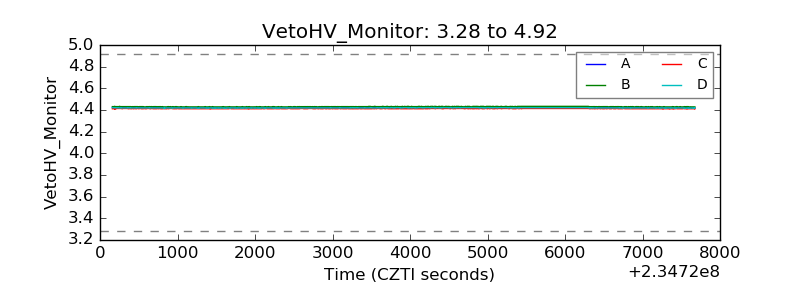 |
| Veto LLD | 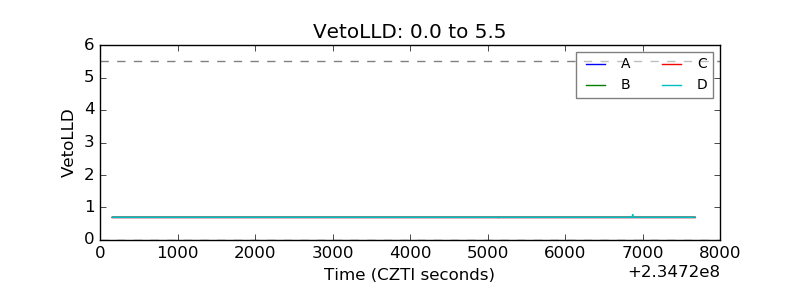 |
| Alpha Counter | 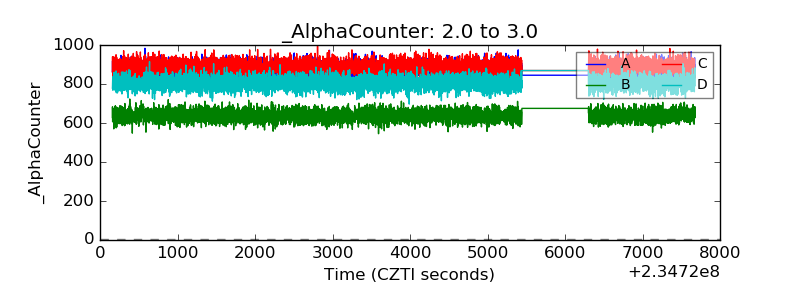 |
| _CPM_Rate | 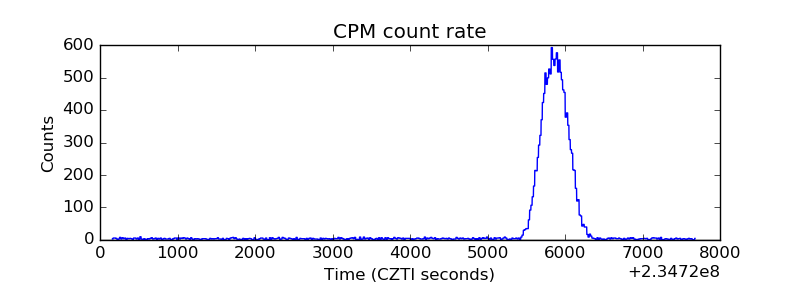 |
| CZT Counter | 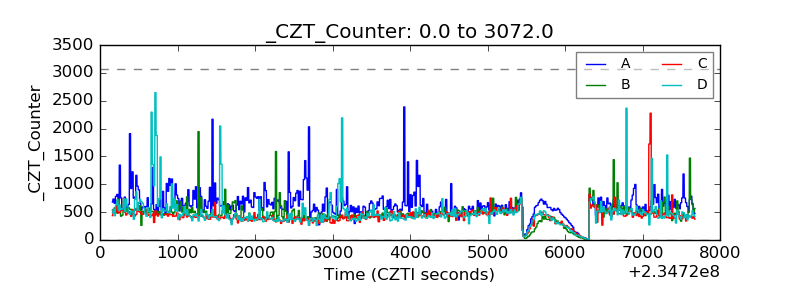 |
| +2.5 Volts monitor |  |
| +5 Volts monitor | 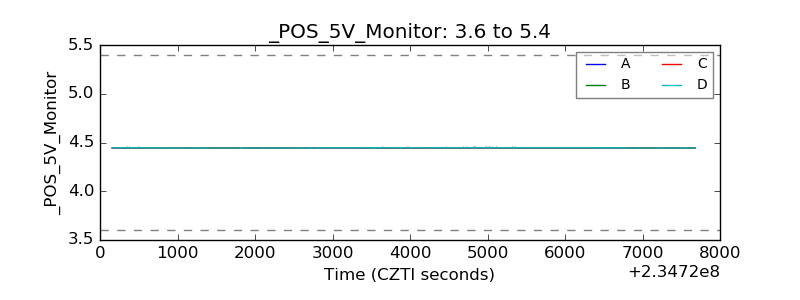 |
| _ROLL_ROT | 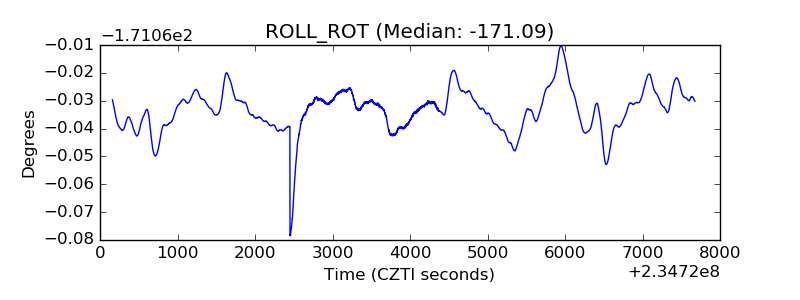 |
| _Roll_DEC | 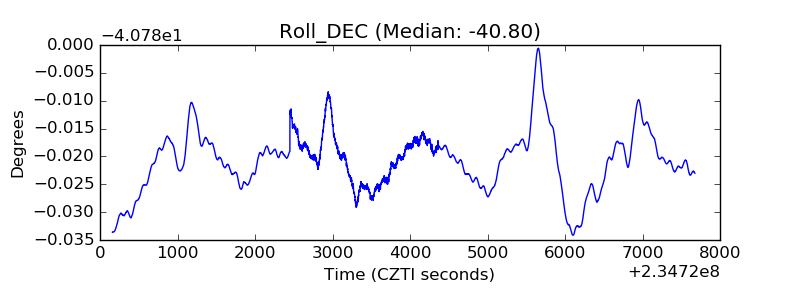 |
| _Roll_RA | 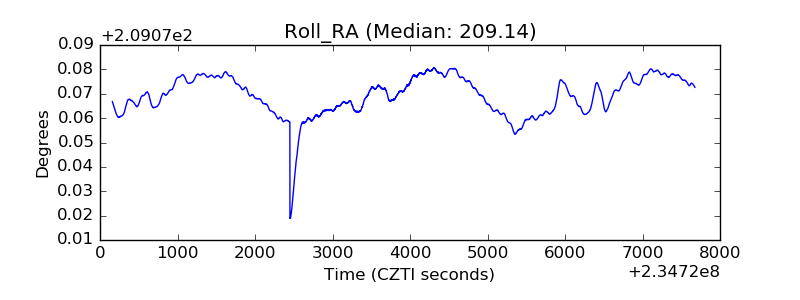 |
| Veto Counter | 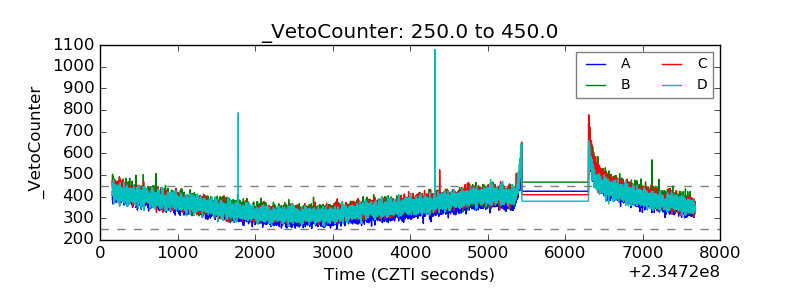 |