| Param | Original file | Final file |
|---|---|---|
| Filename | modeM0/AS1C02_041T02_9000001282_09188cztM0_level2.evt | modeM0/AS1C02_041T02_9000001282_09188cztM0_level2_quad_clean.evt |
| Size (bytes) | 464,284,800 | 86,685,120 |
| Size | 442.8 MB | 82.7 MB |
| Events in quadrant A | 4,049,758 | 553,372 |
| Events in quadrant B | 3,161,976 | 561,837 |
| Events in quadrant C | 2,839,057 | 543,907 |
| Events in quadrant D | 3,579,969 | 523,913 |
| Mode SS | |||
|---|---|---|---|
| Quadrant | BADHDUFLAG | Total packets | Discarded packets |
| A | 0 | 128 | 2 |
| B | 0 | 128 | 0 |
| C | 0 | 128 | 0 |
| D | 0 | 128 | 0 |
| Mode M0 | |||
|---|---|---|---|
| Quadrant | BADHDUFLAG | Total packets | Discarded packets |
| A | 0 | 16472 | 14 |
| B | 0 | 13510 | 13 |
| C | 0 | 12874 | 5 |
| D | 0 | 15043 | 9 |
| Mode M9 | |||
|---|---|---|---|
| Quadrant | BADHDUFLAG | Total packets | Discarded packets |
| A | 0 | 18 | 0 |
| B | 0 | 18 | 0 |
| C | 0 | 18 | 0 |
| D | 0 | 19 | 0 |
| Quadrant | Total seconds | Saturated seconds | Saturation percentage |
|---|---|---|---|
| A | 6340 | 68 | 1.072555% |
| B | 6337 | 23 | 0.362948% |
| C | 6341 | 8 | 0.126163% |
| D | 6340 | 162 | 2.555205% |
Noise dominated data is calculated using 1-second bins in cleaned event files. If a bin has >2000 counts, and if more than 50% of those come from <1% of pixels, then it is considered to be noise-dominated and hence unusable.
| Quadrant | # 1 sec bins | Bins with >0 counts | Bins with >2000 counts | High rate bins dominated by noise | Noise dominated (total time) | Noise dominated (detector-on time) | Marked lightcurve |
|---|---|---|---|---|---|---|---|
| A | 7513 | 6343 | 12 | 12 | 0.16% | 0.19% | 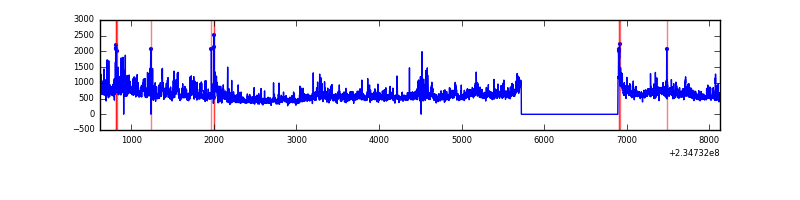 |
| B | 7513 | 6342 | 1 | 1 | 0.01% | 0.02% | 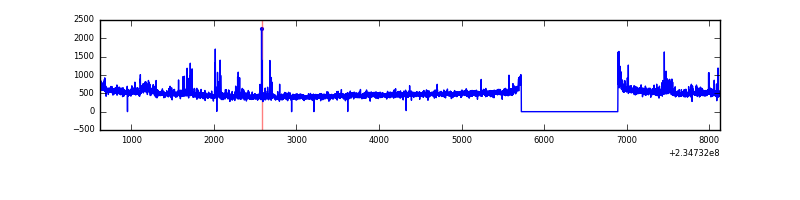 |
| C | 7513 | 6343 | 0 | 0 | 0.00% | 0.00% | 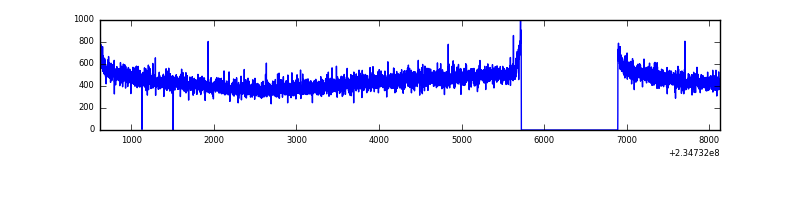 |
| D | 7513 | 6343 | 161 | 161 | 2.14% | 2.54% | 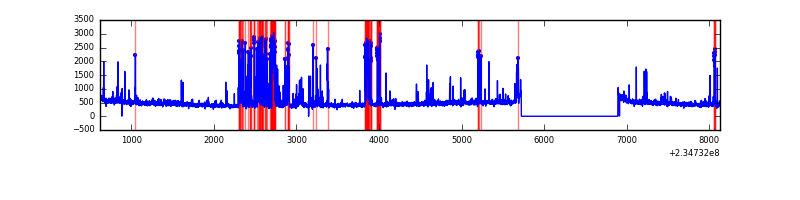 |
Top three noisy pixels from each quadrant. If the there are fewer than three noisy pixels in the level2.evt file, extra rows are filled as -1
| Pixel properties | Quadrant properties | ||||||
|---|---|---|---|---|---|---|---|
| Quadrant | DetID | PixID | Counts | Sigma | Mean | Median | Sigma |
| A | 8 | 5 | 900687 | 5838.58 | 755 | 739 | 154.1 |
| A | 1 | 162 | 116479 | 750.88 | 755 | 739 | 154.1 |
| A | 1 | 178 | 25562 | 161.04 | 755 | 739 | 154.1 |
| B | 8 | 234 | 45637 | 305.4 | 765 | 748 | 147.0 |
| B | 0 | 230 | 38437 | 256.42 | 765 | 748 | 147.0 |
| B | 0 | 246 | 22683 | 149.23 | 765 | 748 | 147.0 |
| C | 13 | 61 | 5511 | 28.25 | 725 | 728 | 169.3 |
| C | 8 | 222 | 4155 | 20.24 | 725 | 728 | 169.3 |
| C | 8 | 128 | 3612 | 17.03 | 725 | 728 | 169.3 |
| D | 1 | 52 | 626992 | 3564.9 | 716 | 693 | 175.7 |
| D | 7 | 71 | 68365 | 385.19 | 716 | 693 | 175.7 |
| D | 1 | 31 | 41831 | 234.16 | 716 | 693 | 175.7 |
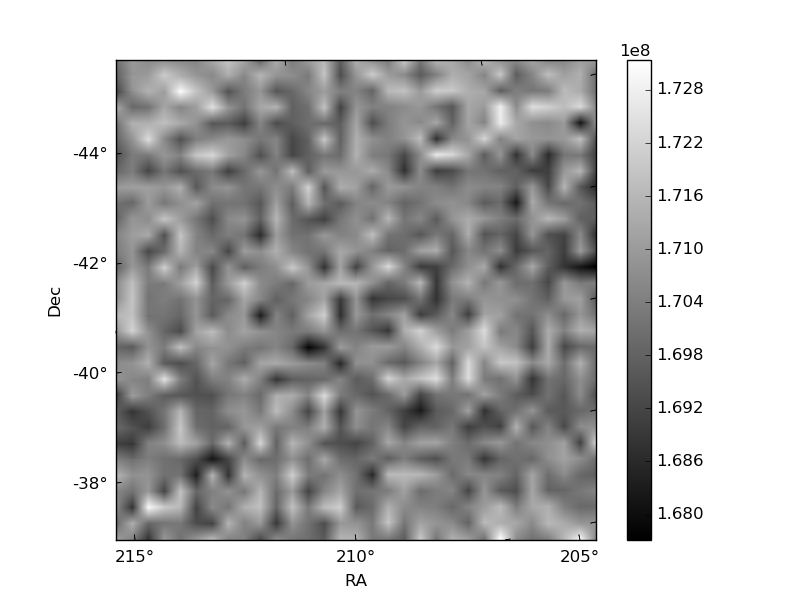
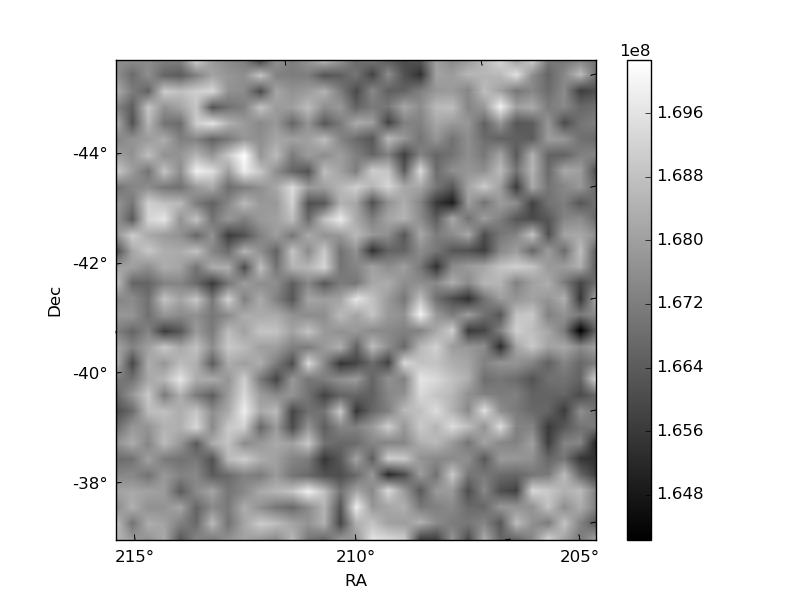
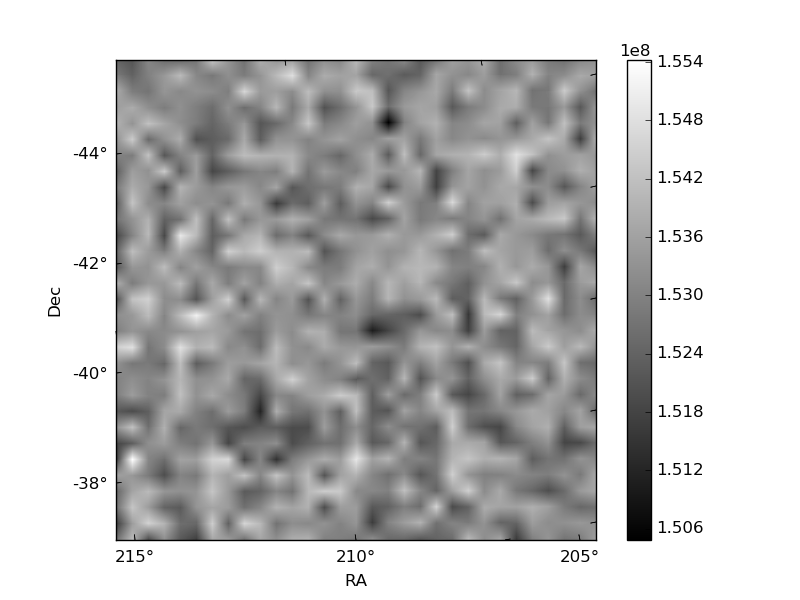
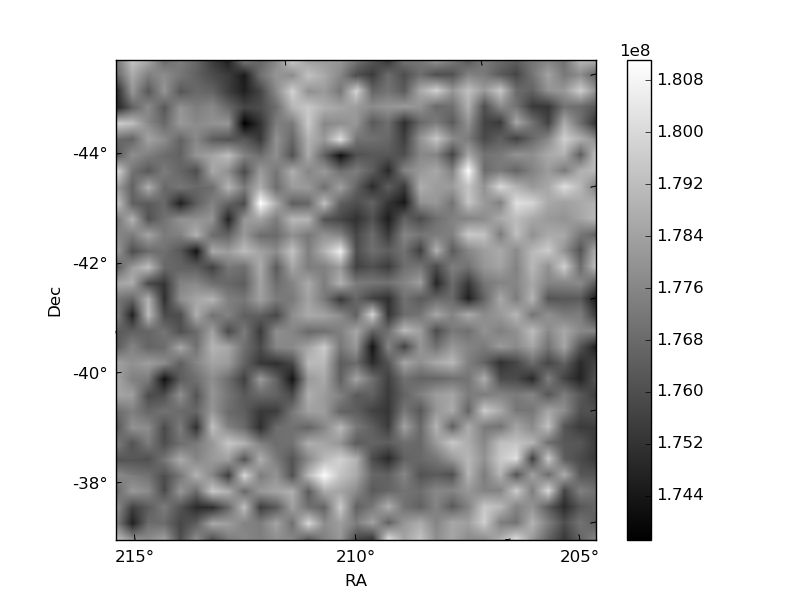
Histogram calculated using DETX and DETY for each event in the final _common_clean file
| Quadrant A |  |
 |
Quadrant B |
|---|---|---|---|
| Quadrant D |  |
 |
Quadrant C |
| Plot type | Count rate plots | Images |
|---|---|---|
| Comparison with Poisson distribution Blue bars denote a histogram of data divided into 1 sec bins. Red curve is a Poisson curve with rate = median count rate of data. |
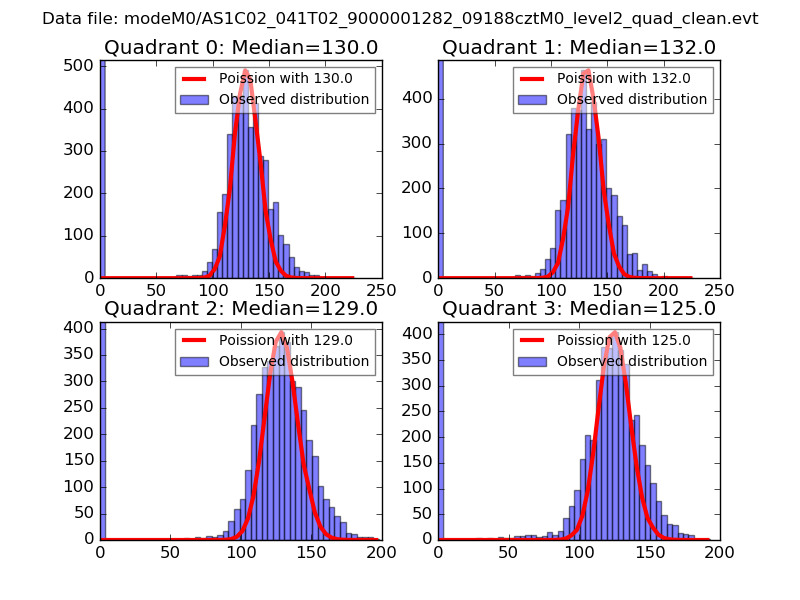 |
 |
| Quadrant-wise count rates Data is divided into 100 sec bins |
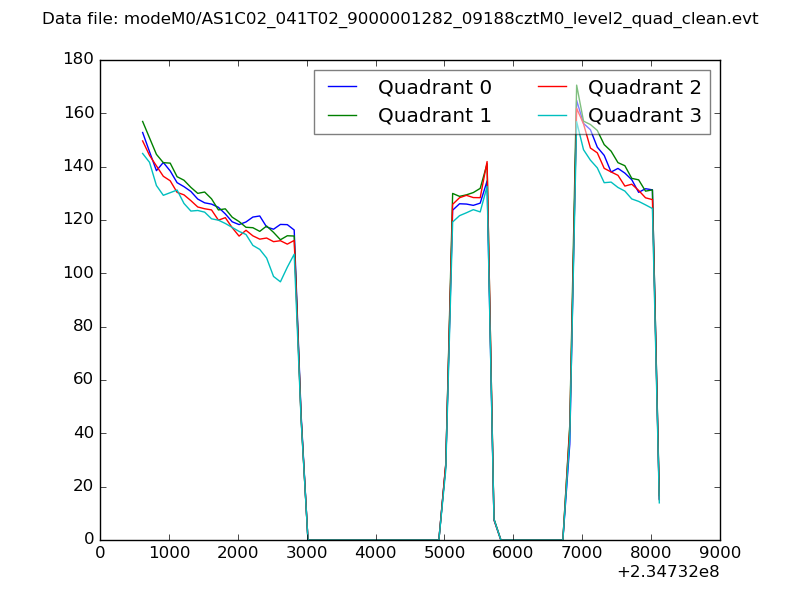 |
|
| Module-wise count rates for Quadrant A Data is divided into 100 sec bins |
 |
 |
| Module-wise count rates for Quadrant B Data is divided into 100 sec bins |
 |
 |
| Module-wise count rates for Quadrant C Data is divided into 100 sec bins |
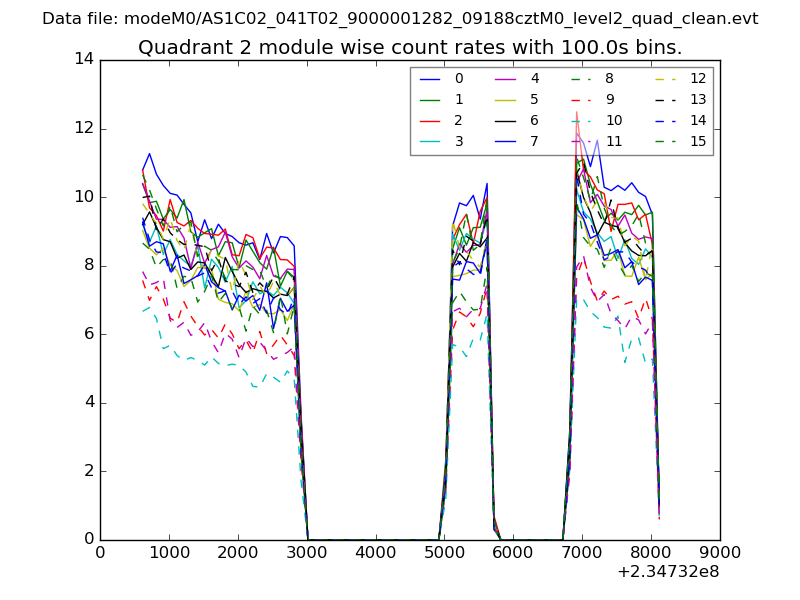 |
 |
| Module-wise count rates for Quadrant D Data is divided into 100 sec bins |
 |
 |
| Parameter | Plot |
|---|---|
| CZT HV Monitor | 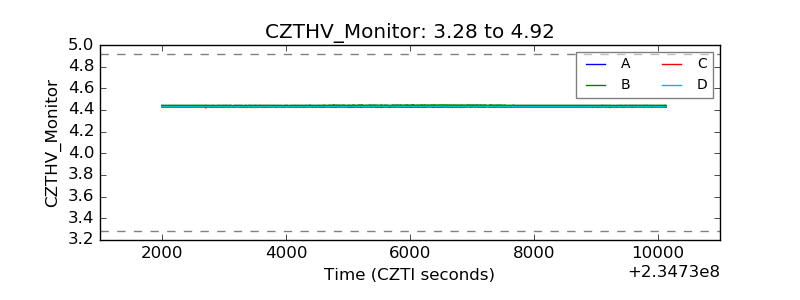 |
| D_VDD |  |
| Temperature 1 |  |
| Veto HV Monitor |  |
| Veto LLD |  |
| Alpha Counter | 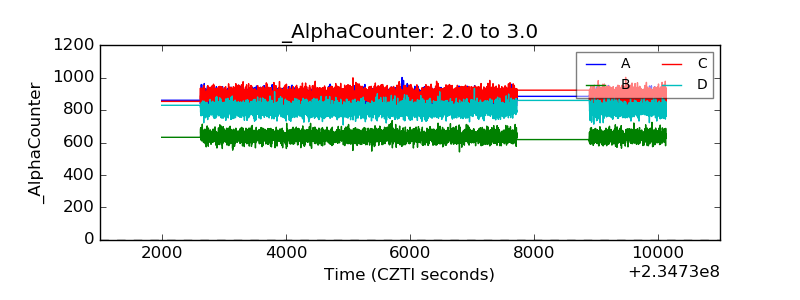 |
| _CPM_Rate | 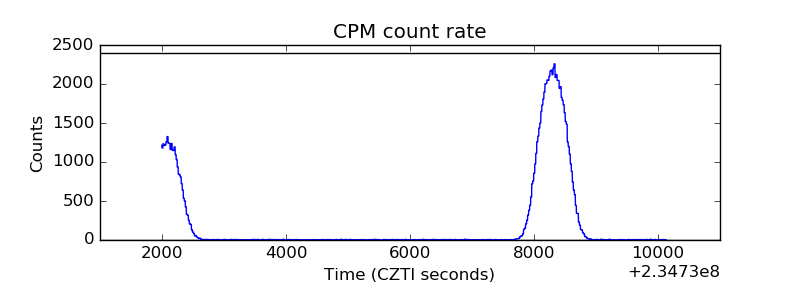 |
| CZT Counter |  |
| +2.5 Volts monitor |  |
| +5 Volts monitor |  |
| _ROLL_ROT |  |
| _Roll_DEC |  |
| _Roll_RA |  |
| Veto Counter |  |