| Param | Original file | Final file |
|---|---|---|
| Filename | modeM0/AS1C02_041T02_9000001282_09189cztM0_level2.evt | modeM0/AS1C02_041T02_9000001282_09189cztM0_level2_quad_clean.evt |
| Size (bytes) | 449,547,840 | 87,534,720 |
| Size | 428.7 MB | 83.5 MB |
| Events in quadrant A | 3,967,688 | 557,525 |
| Events in quadrant B | 3,188,499 | 575,451 |
| Events in quadrant C | 2,863,835 | 556,271 |
| Events in quadrant D | 3,174,549 | 529,924 |
| Mode SS | |||
|---|---|---|---|
| Quadrant | BADHDUFLAG | Total packets | Discarded packets |
| A | 0 | 124 | 0 |
| B | 0 | 124 | 0 |
| C | 0 | 124 | 0 |
| D | 0 | 124 | 0 |
| Mode M0 | |||
|---|---|---|---|
| Quadrant | BADHDUFLAG | Total packets | Discarded packets |
| A | 0 | 16021 | 2 |
| B | 0 | 13439 | 1 |
| C | 0 | 12621 | 1 |
| D | 0 | 13729 | 1 |
| Mode M9 | |||
|---|---|---|---|
| Quadrant | BADHDUFLAG | Total packets | Discarded packets |
| A | 0 | 18 | 0 |
| B | 0 | 18 | 0 |
| C | 0 | 18 | 0 |
| D | 0 | 19 | 0 |
| Quadrant | Total seconds | Saturated seconds | Saturation percentage |
|---|---|---|---|
| A | 6190 | 95 | 1.534733% |
| B | 6190 | 25 | 0.403877% |
| C | 6190 | 7 | 0.113086% |
| D | 6190 | 47 | 0.759289% |
Noise dominated data is calculated using 1-second bins in cleaned event files. If a bin has >2000 counts, and if more than 50% of those come from <1% of pixels, then it is considered to be noise-dominated and hence unusable.
| Quadrant | # 1 sec bins | Bins with >0 counts | Bins with >2000 counts | High rate bins dominated by noise | Noise dominated (total time) | Noise dominated (detector-on time) | Marked lightcurve |
|---|---|---|---|---|---|---|---|
| A | 7479 | 6189 | 29 | 29 | 0.39% | 0.47% | 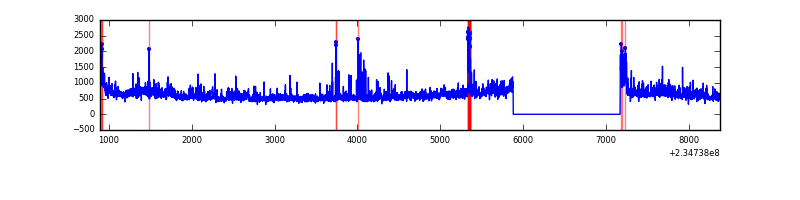 |
| B | 7479 | 6189 | 0 | 0 | 0.00% | 0.00% | 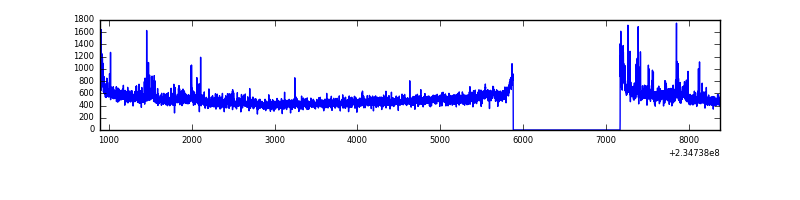 |
| C | 7479 | 6189 | 0 | 0 | 0.00% | 0.00% | 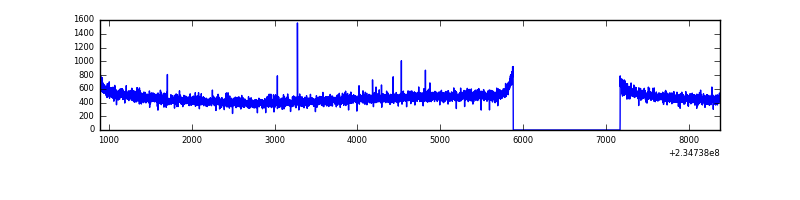 |
| D | 7479 | 6189 | 34 | 34 | 0.45% | 0.55% | 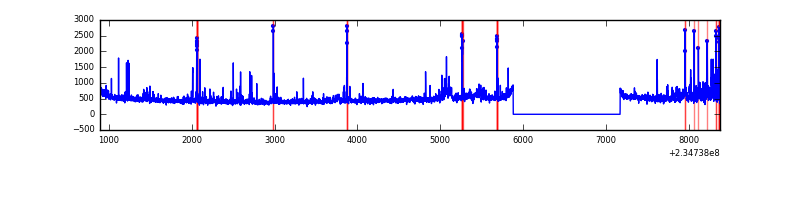 |
Top three noisy pixels from each quadrant. If the there are fewer than three noisy pixels in the level2.evt file, extra rows are filled as -1
| Pixel properties | Quadrant properties | ||||||
|---|---|---|---|---|---|---|---|
| Quadrant | DetID | PixID | Counts | Sigma | Mean | Median | Sigma |
| A | 8 | 5 | 799523 | 5248.07 | 749 | 734 | 152.2 |
| A | 1 | 162 | 101843 | 664.29 | 749 | 734 | 152.2 |
| A | 15 | 174 | 63126 | 409.92 | 749 | 734 | 152.2 |
| B | 8 | 234 | 56080 | 379.51 | 764 | 748 | 145.8 |
| B | 10 | 16 | 37376 | 251.22 | 764 | 748 | 145.8 |
| B | 0 | 246 | 26685 | 177.9 | 764 | 748 | 145.8 |
| C | 8 | 128 | 10237 | 56.06 | 728 | 733 | 169.5 |
| C | 8 | 222 | 7931 | 42.46 | 728 | 733 | 169.5 |
| C | 8 | 112 | 5867 | 30.28 | 728 | 733 | 169.5 |
| D | 1 | 52 | 203276 | 1151.7 | 718 | 695 | 175.9 |
| D | 9 | 64 | 67076 | 377.38 | 718 | 695 | 175.9 |
| D | 2 | 14 | 45748 | 256.13 | 718 | 695 | 175.9 |
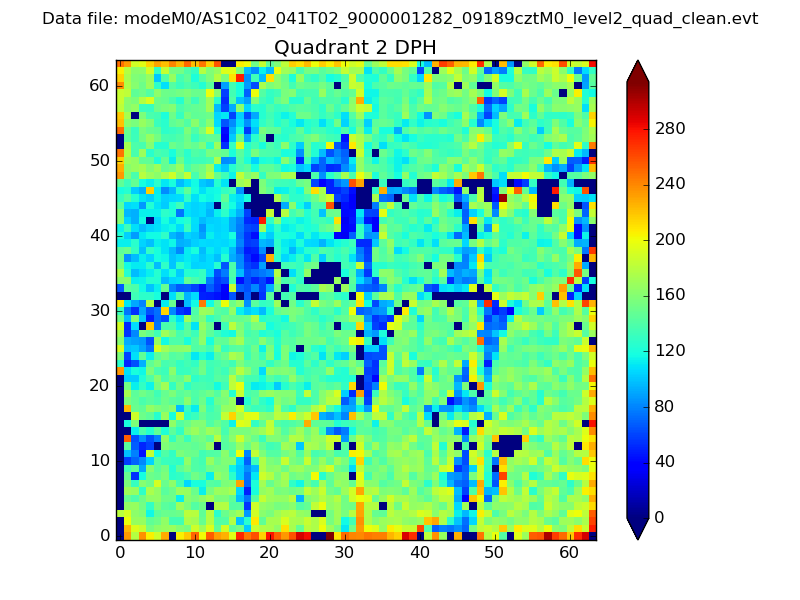
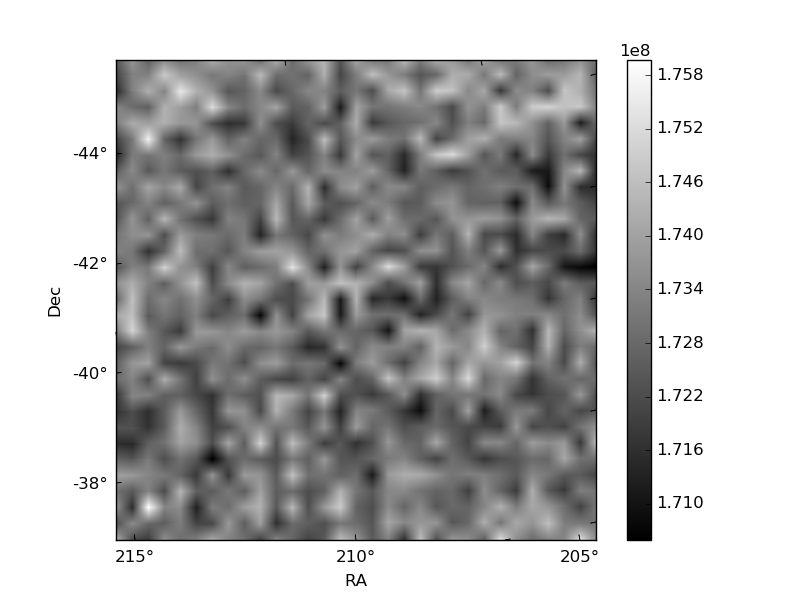
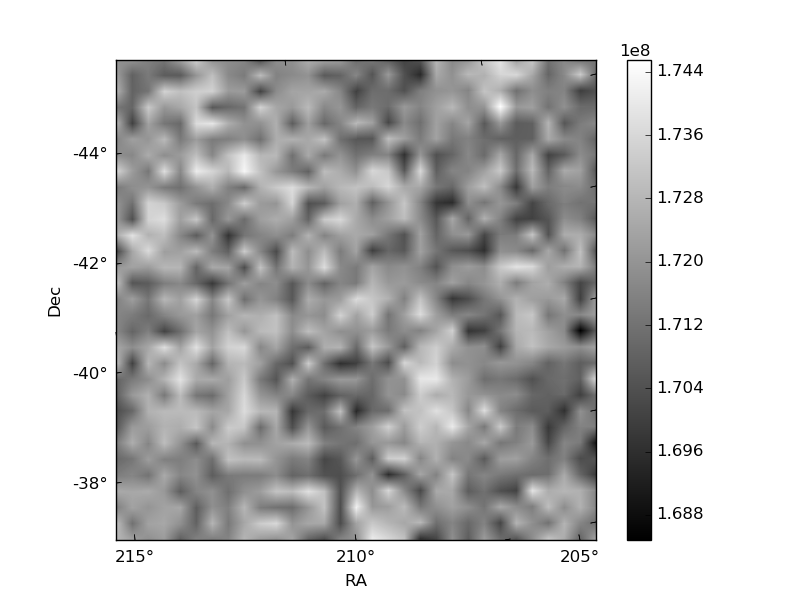
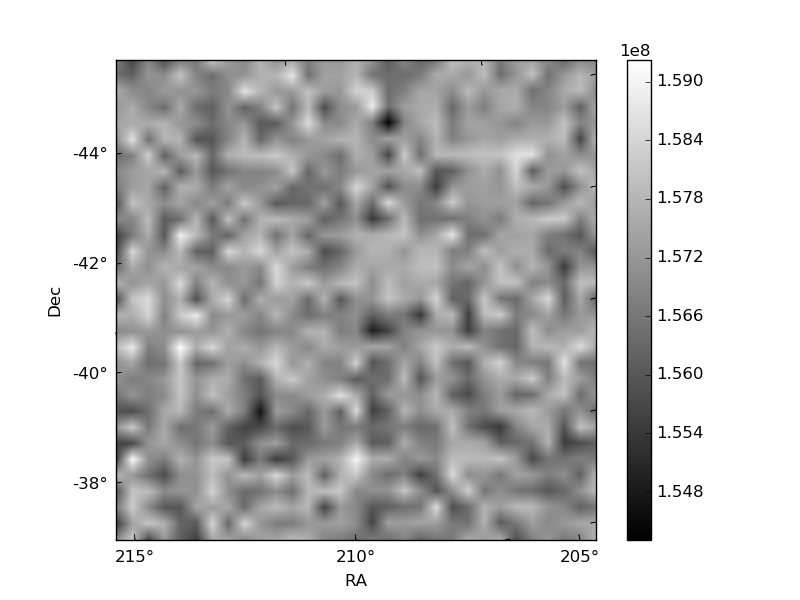
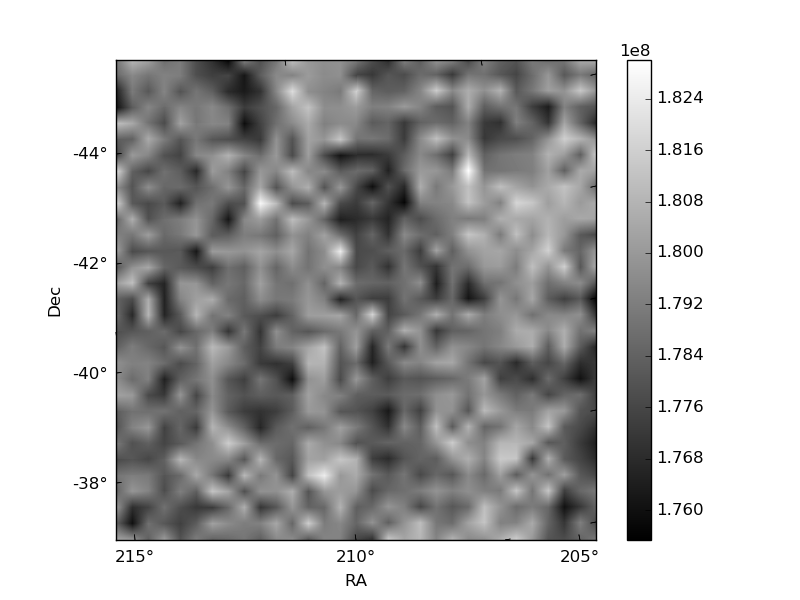
Histogram calculated using DETX and DETY for each event in the final _common_clean file
| Quadrant A | 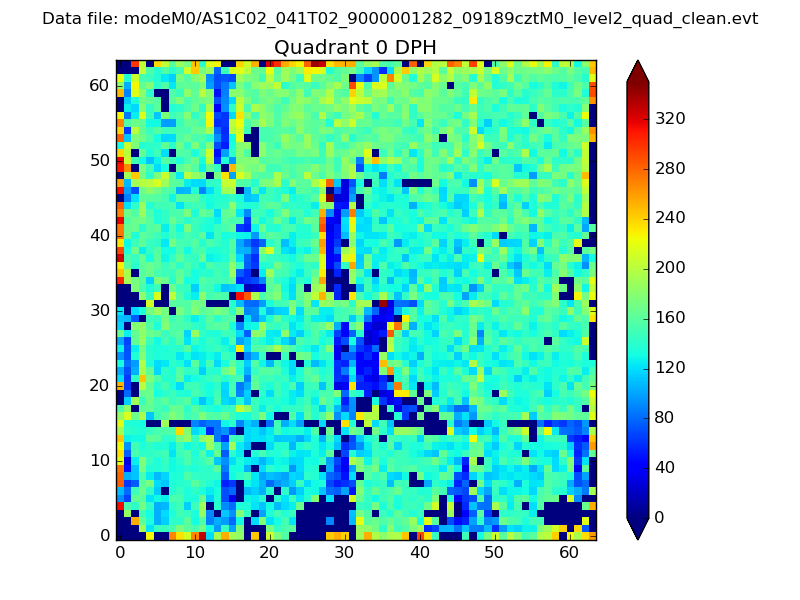 |
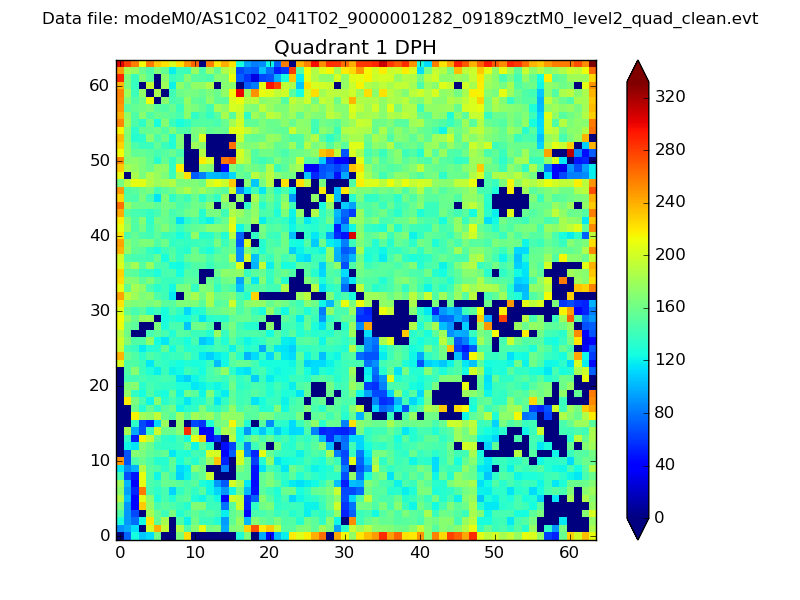 |
Quadrant B |
|---|---|---|---|
| Quadrant D | 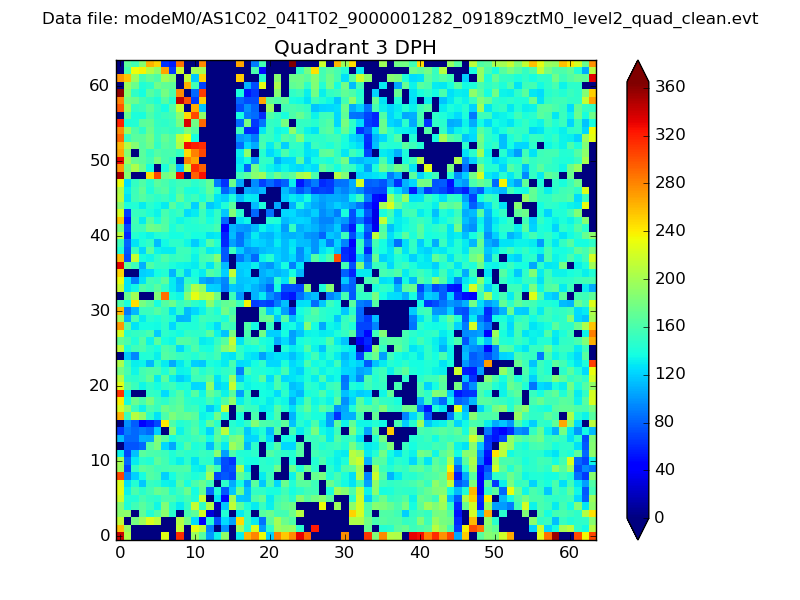 |
 |
Quadrant C |
| Plot type | Count rate plots | Images |
|---|---|---|
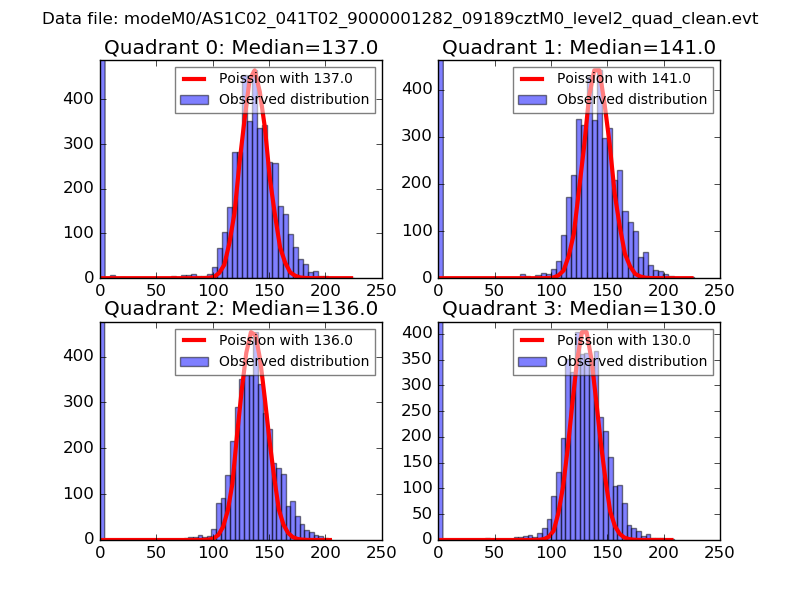
| Comparison with Poisson distribution Blue bars denote a histogram of data divided into 1 sec bins. Red curve is a Poisson curve with rate = median count rate of data. |
 |
 |
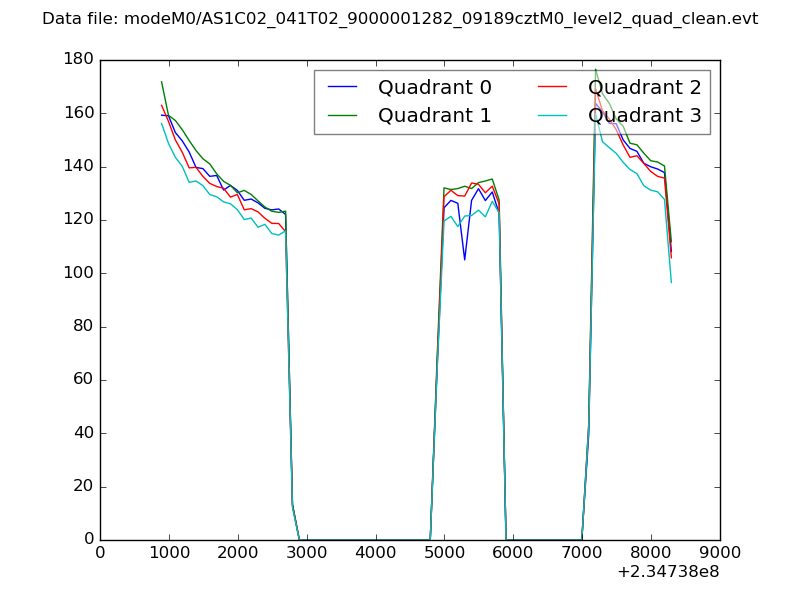
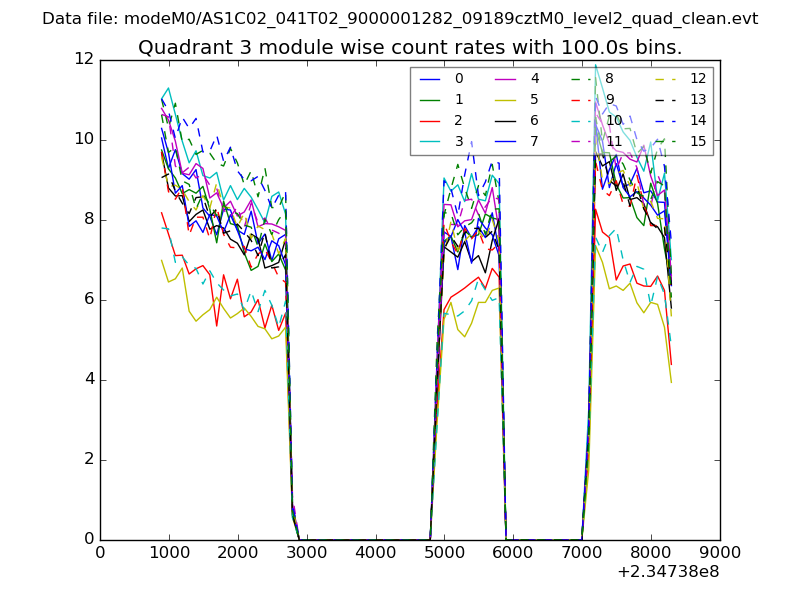
| Quadrant-wise count rates Data is divided into 100 sec bins |
 |
|
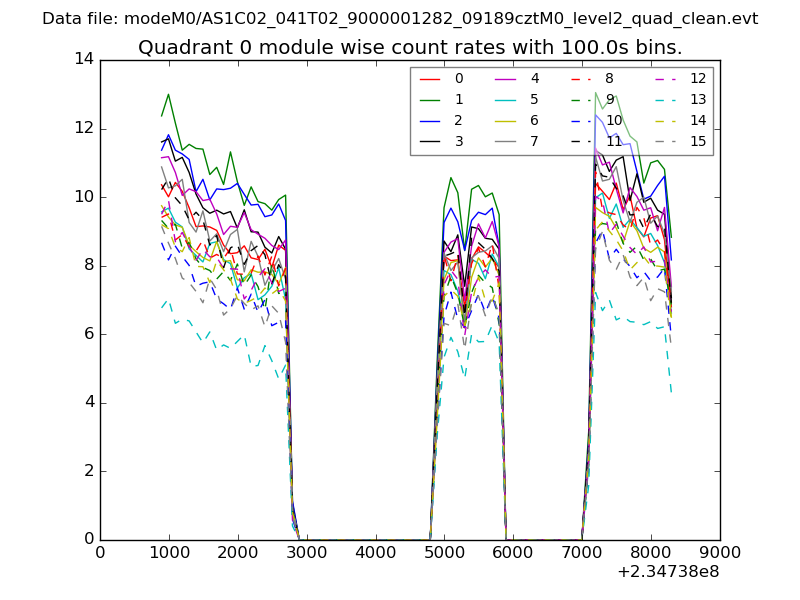
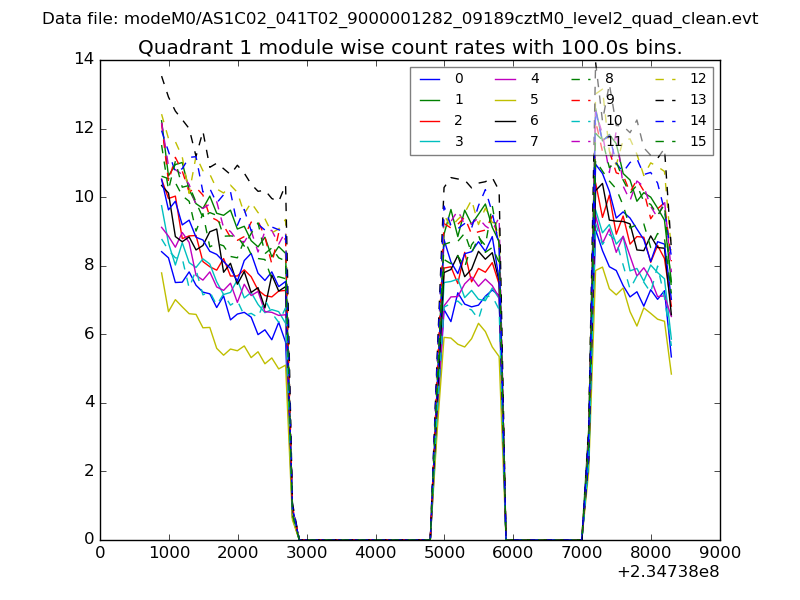
| Module-wise count rates for Quadrant A Data is divided into 100 sec bins |
 |
 |
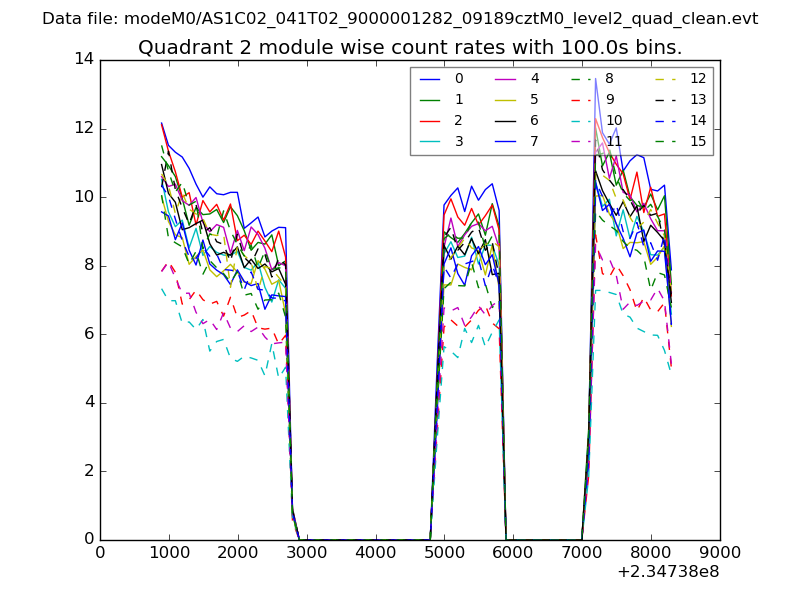
| Module-wise count rates for Quadrant B Data is divided into 100 sec bins |
 |
 |
| Module-wise count rates for Quadrant C Data is divided into 100 sec bins |
 |
 |
| Module-wise count rates for Quadrant D Data is divided into 100 sec bins |
 |
 |
| Parameter | Plot |
|---|---|
| CZT HV Monitor | 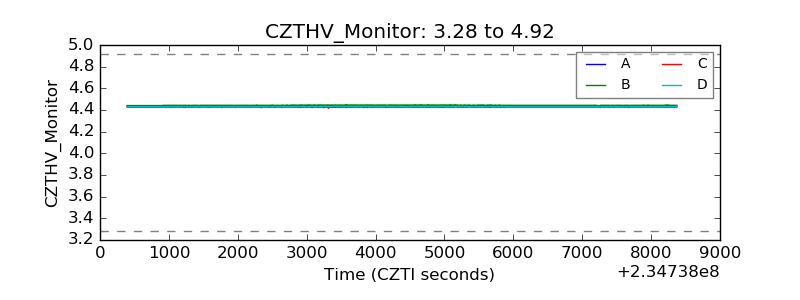 |
| D_VDD | 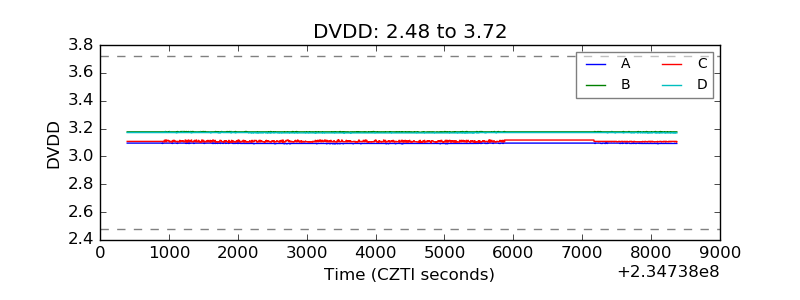 |
| Temperature 1 | 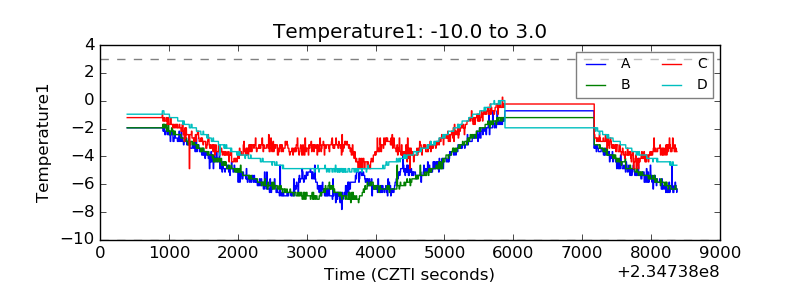 |
| Veto HV Monitor | 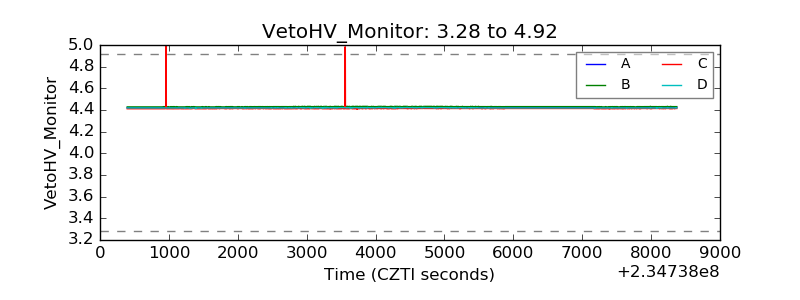 |
| Veto LLD |  |
| Alpha Counter | 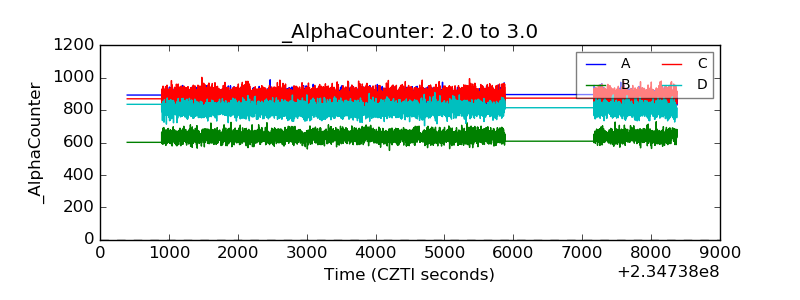 |
| _CPM_Rate | 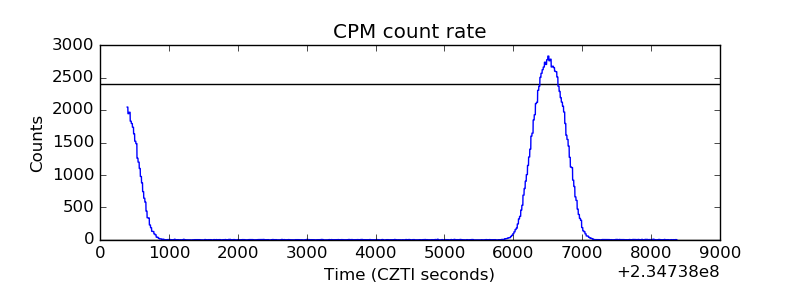 |
| CZT Counter | 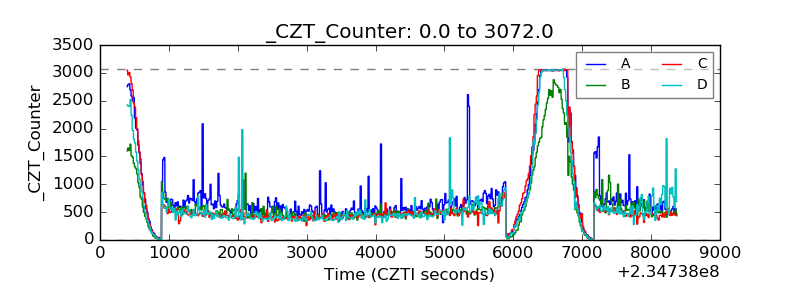 |
| +2.5 Volts monitor | 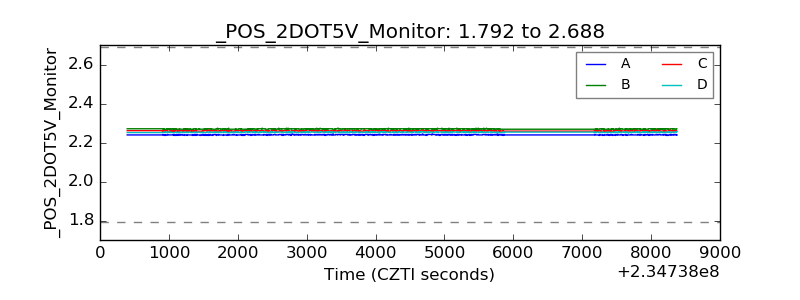 |
| +5 Volts monitor |  |
| _ROLL_ROT | 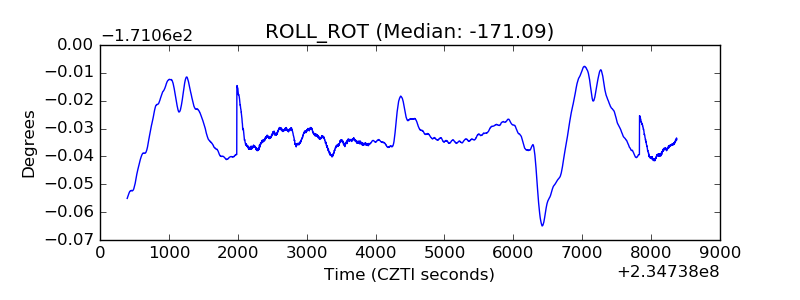 |
| _Roll_DEC | 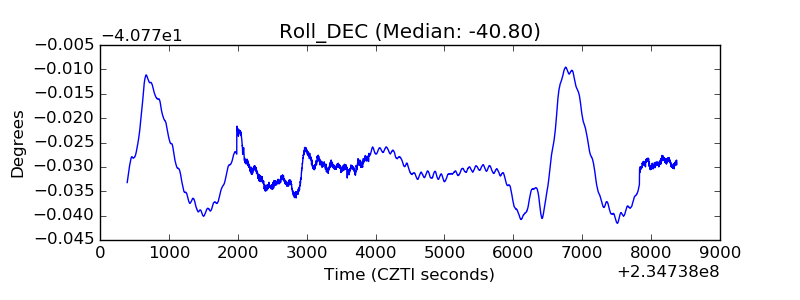 |
| _Roll_RA | 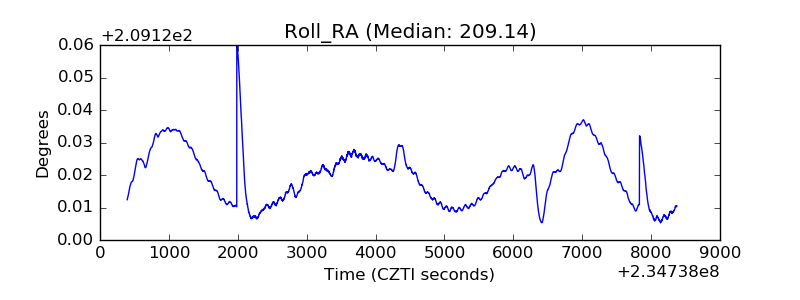 |
| Veto Counter |  |