| Param | Original file | Final file |
|---|---|---|
| Filename | modeM0/AS1C02_041T02_9000001282_09190cztM0_level2.evt | modeM0/AS1C02_041T02_9000001282_09190cztM0_level2_quad_clean.evt |
| Size (bytes) | 473,100,480 | 86,117,760 |
| Size | 451.2 MB | 82.1 MB |
| Events in quadrant A | 4,055,480 | 547,436 |
| Events in quadrant B | 3,176,615 | 564,502 |
| Events in quadrant C | 2,890,764 | 549,097 |
| Events in quadrant D | 3,788,685 | 518,568 |
| Mode SS | |||
|---|---|---|---|
| Quadrant | BADHDUFLAG | Total packets | Discarded packets |
| A | 0 | 124 | 0 |
| B | 0 | 124 | 0 |
| C | 0 | 124 | 0 |
| D | 0 | 124 | 0 |
| Mode M0 | |||
|---|---|---|---|
| Quadrant | BADHDUFLAG | Total packets | Discarded packets |
| A | 0 | 16300 | 3 |
| B | 0 | 13306 | 2 |
| C | 0 | 12538 | 4 |
| D | 0 | 15207 | 8 |
| Mode M9 | |||
|---|---|---|---|
| Quadrant | BADHDUFLAG | Total packets | Discarded packets |
| A | 0 | 18 | 0 |
| B | 0 | 18 | 0 |
| C | 0 | 18 | 0 |
| D | 0 | 19 | 0 |
| Quadrant | Total seconds | Saturated seconds | Saturation percentage |
|---|---|---|---|
| A | 6139 | 67 | 1.091383% |
| B | 6139 | 25 | 0.407232% |
| C | 6138 | 8 | 0.130336% |
| D | 6137 | 33 | 0.537722% |
Noise dominated data is calculated using 1-second bins in cleaned event files. If a bin has >2000 counts, and if more than 50% of those come from <1% of pixels, then it is considered to be noise-dominated and hence unusable.
| Quadrant | # 1 sec bins | Bins with >0 counts | Bins with >2000 counts | High rate bins dominated by noise | Noise dominated (total time) | Noise dominated (detector-on time) | Marked lightcurve |
|---|---|---|---|---|---|---|---|
| A | 7499 | 6139 | 8 | 8 | 0.11% | 0.13% |  |
| B | 7498 | 6138 | 0 | 0 | 0.00% | 0.00% | 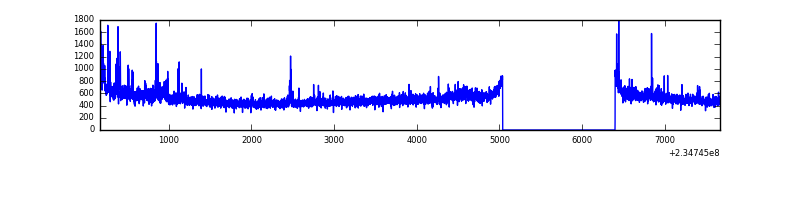 |
| C | 7498 | 6137 | 0 | 0 | 0.00% | 0.00% | 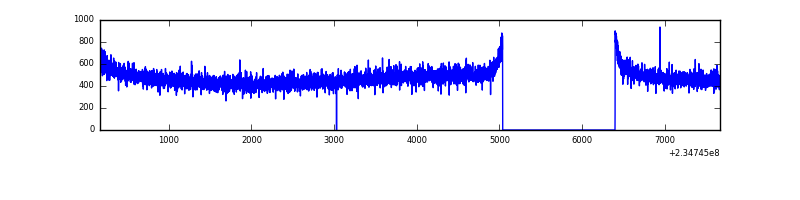 |
| D | 7498 | 6138 | 28 | 28 | 0.37% | 0.46% |  |
Top three noisy pixels from each quadrant. If the there are fewer than three noisy pixels in the level2.evt file, extra rows are filled as -1
| Pixel properties | Quadrant properties | ||||||
|---|---|---|---|---|---|---|---|
| Quadrant | DetID | PixID | Counts | Sigma | Mean | Median | Sigma |
| A | 8 | 5 | 845290 | 5560.52 | 759 | 745 | 151.9 |
| A | 1 | 162 | 124293 | 813.45 | 759 | 745 | 151.9 |
| A | 3 | 1 | 28410 | 182.15 | 759 | 745 | 151.9 |
| B | 8 | 234 | 42293 | 282.68 | 773 | 755 | 146.9 |
| B | 0 | 219 | 24063 | 158.62 | 773 | 755 | 146.9 |
| B | 0 | 245 | 21700 | 142.54 | 773 | 755 | 146.9 |
| C | 13 | 61 | 5650 | 28.77 | 740 | 746 | 170.5 |
| C | 8 | 222 | 5459 | 27.65 | 740 | 746 | 170.5 |
| C | 3 | 202 | 1879 | 6.65 | 740 | 746 | 170.5 |
| D | 1 | 20 | 418890 | 2339.48 | 730 | 706 | 178.8 |
| D | 1 | 52 | 256711 | 1432.19 | 730 | 706 | 178.8 |
| D | 12 | 227 | 120821 | 671.97 | 730 | 706 | 178.8 |
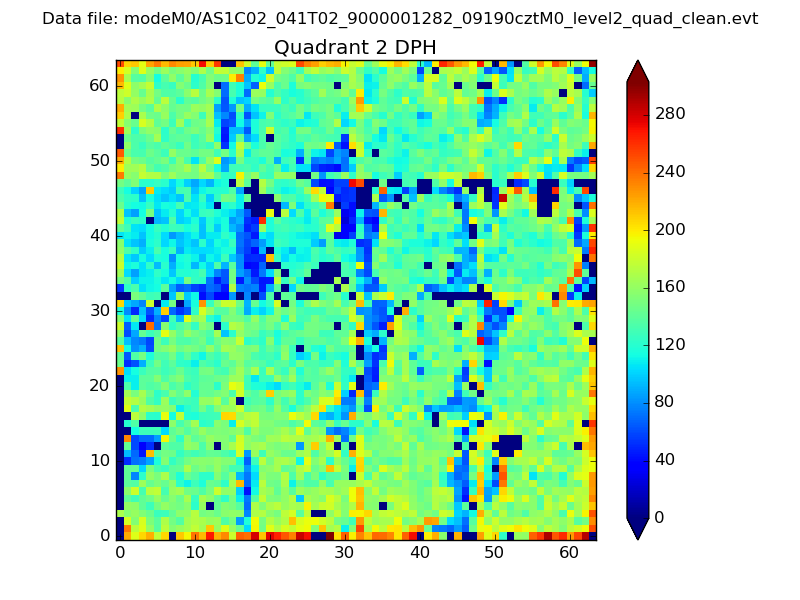
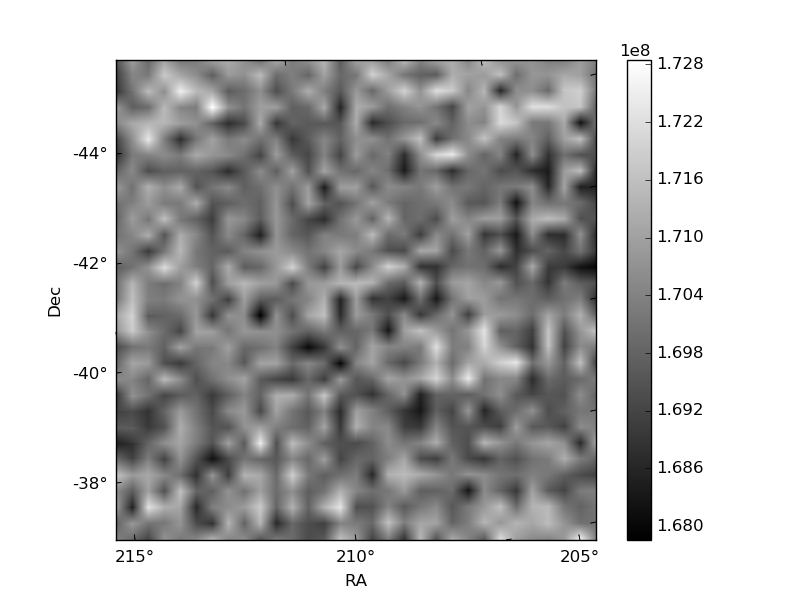
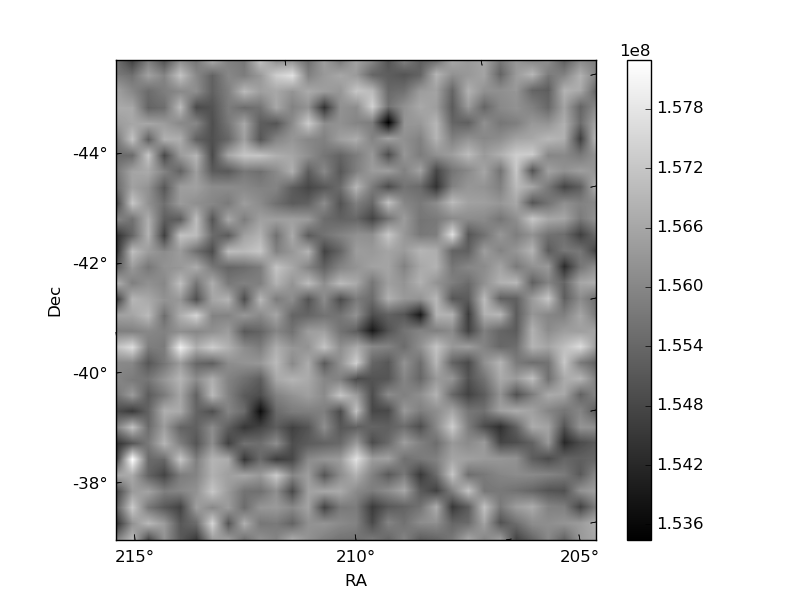
Histogram calculated using DETX and DETY for each event in the final _common_clean file
| Quadrant A | 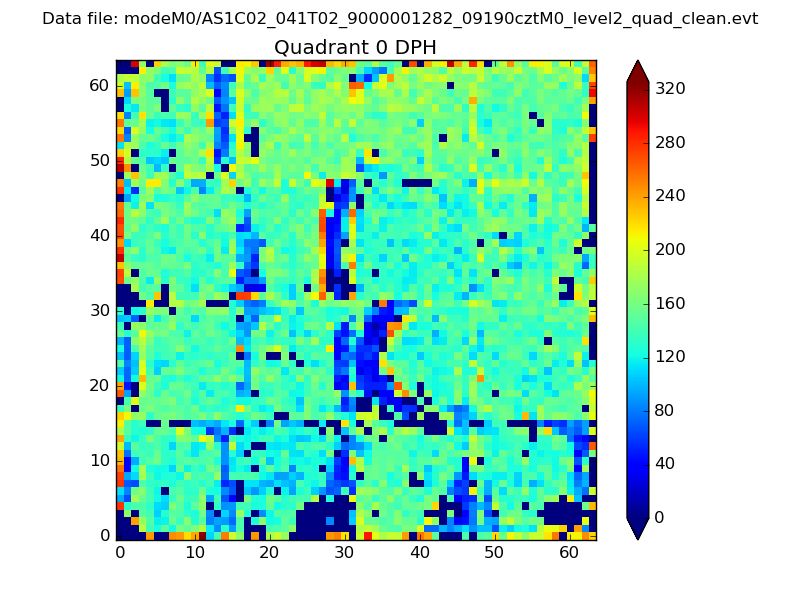 |
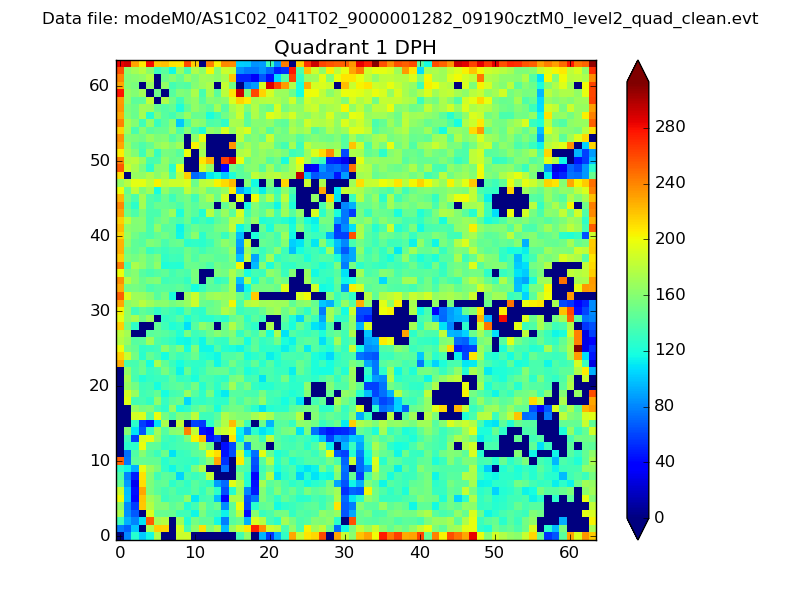 |
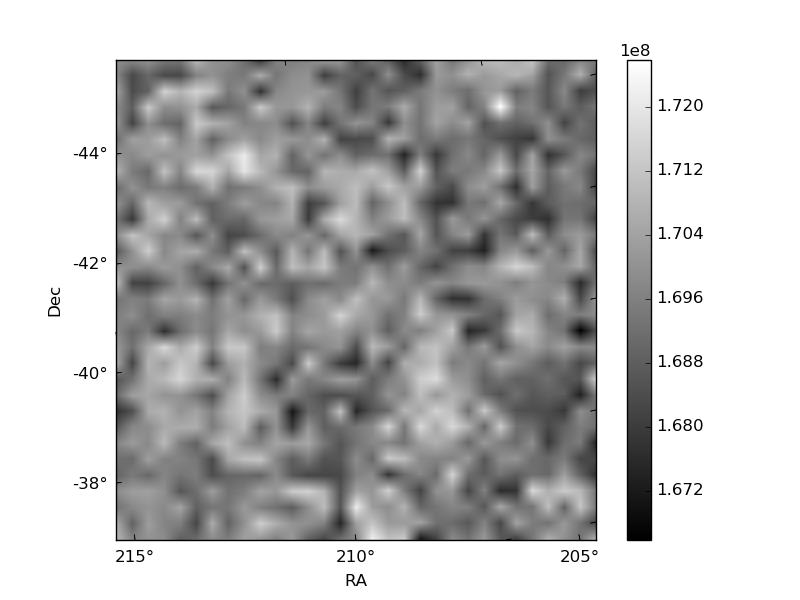
Quadrant B |
|---|---|---|---|
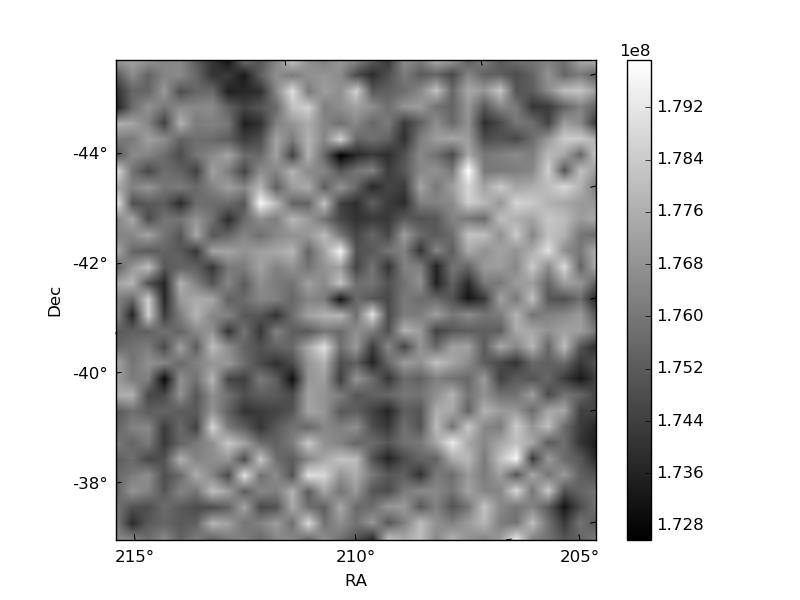
| Quadrant D | 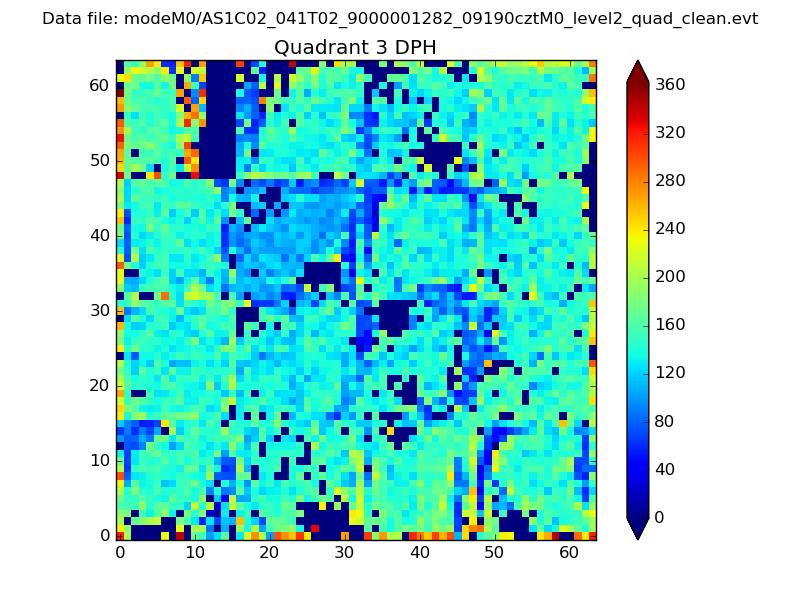 |
 |
Quadrant C |
| Plot type | Count rate plots | Images |
|---|---|---|
| Comparison with Poisson distribution Blue bars denote a histogram of data divided into 1 sec bins. Red curve is a Poisson curve with rate = median count rate of data. |
 |
 |
| Quadrant-wise count rates Data is divided into 100 sec bins |
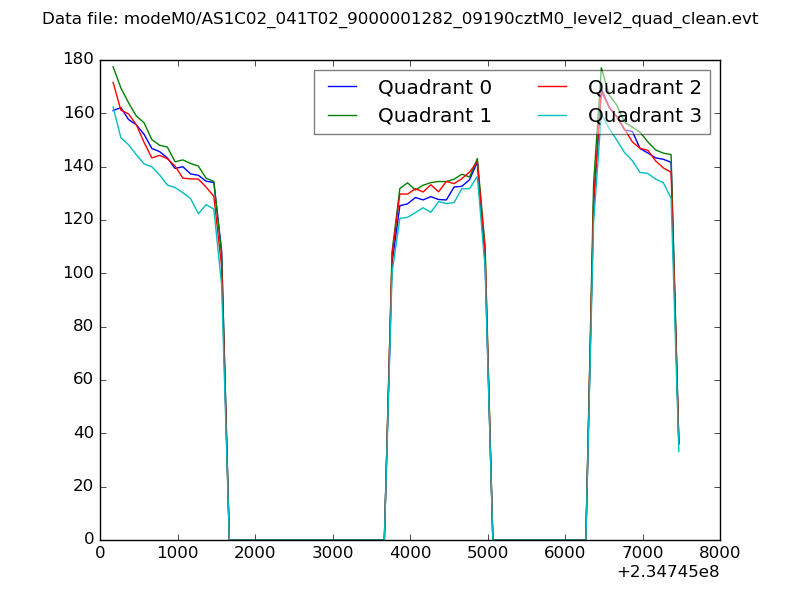 |
|
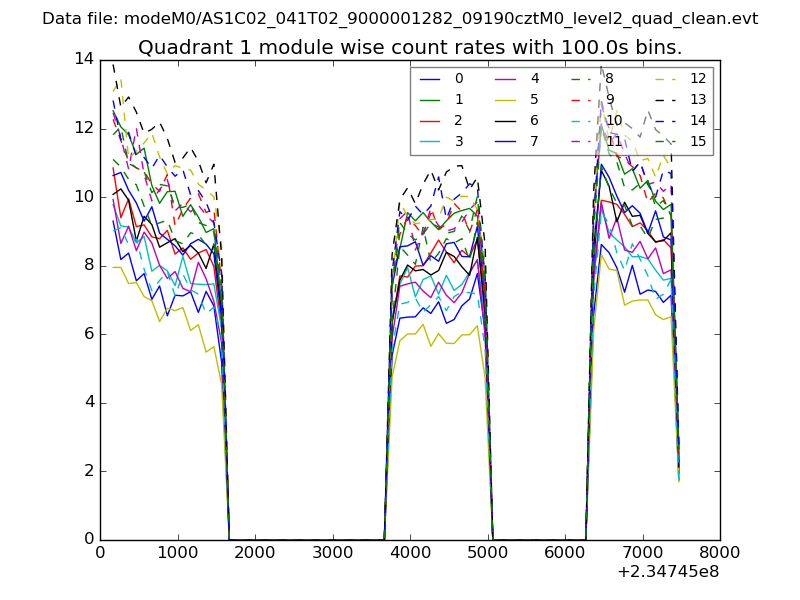
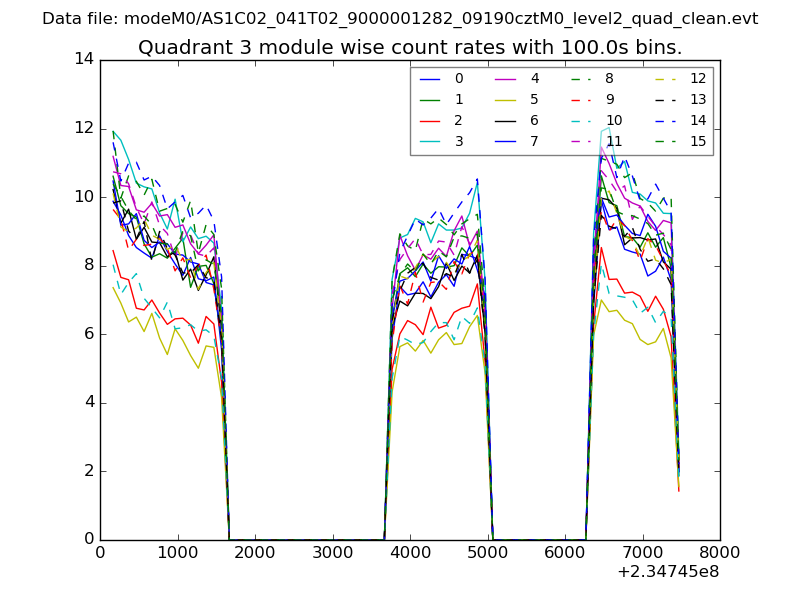
| Module-wise count rates for Quadrant A Data is divided into 100 sec bins |
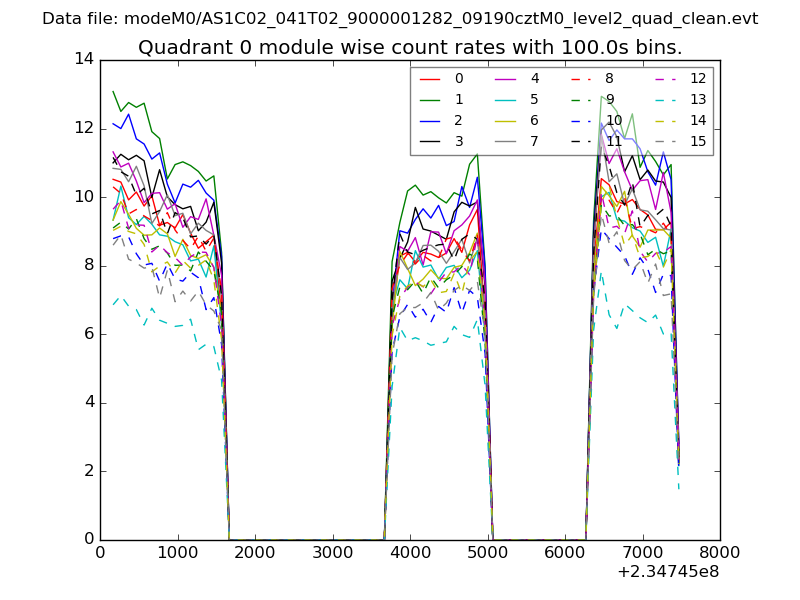 |
 |
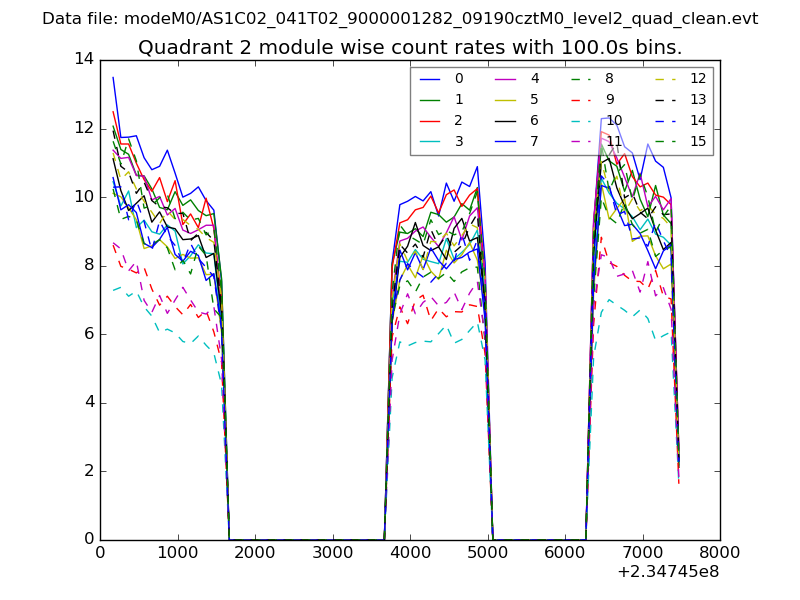
| Module-wise count rates for Quadrant B Data is divided into 100 sec bins |
 |
 |
| Module-wise count rates for Quadrant C Data is divided into 100 sec bins |
 |
 |
| Module-wise count rates for Quadrant D Data is divided into 100 sec bins |
 |
 |
| Parameter | Plot |
|---|---|
| CZT HV Monitor | 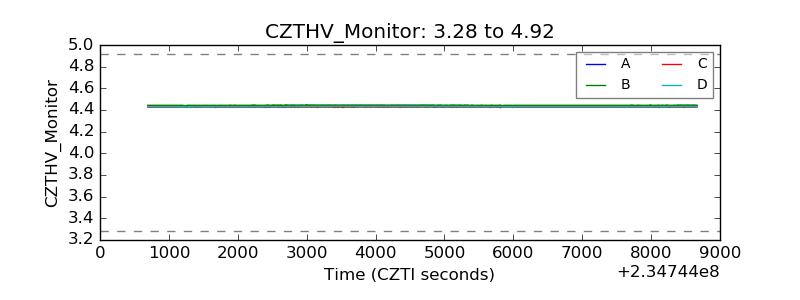 |
| D_VDD |  |
| Temperature 1 | 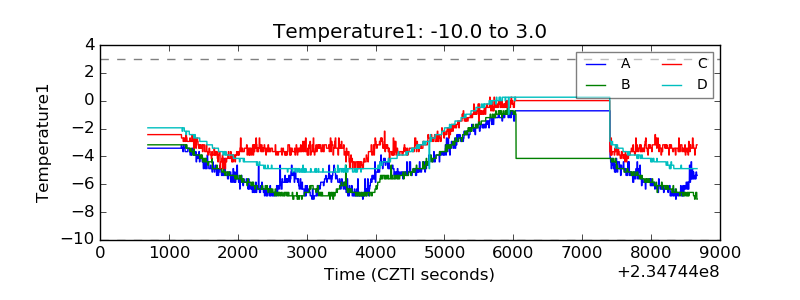 |
| Veto HV Monitor | 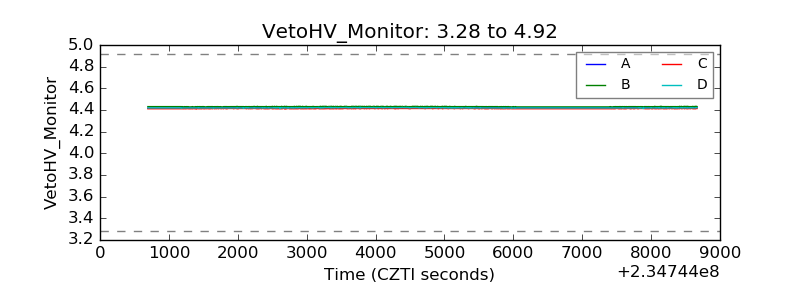 |
| Veto LLD | 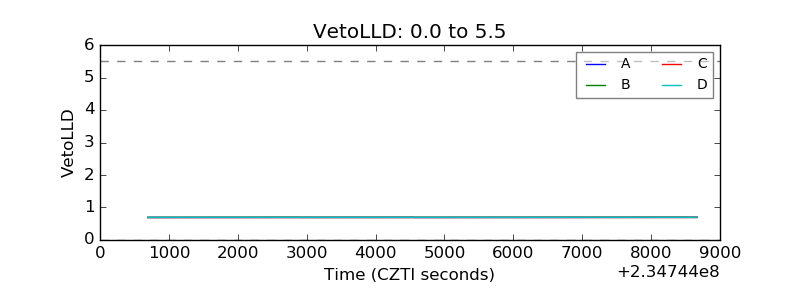 |
| Alpha Counter | 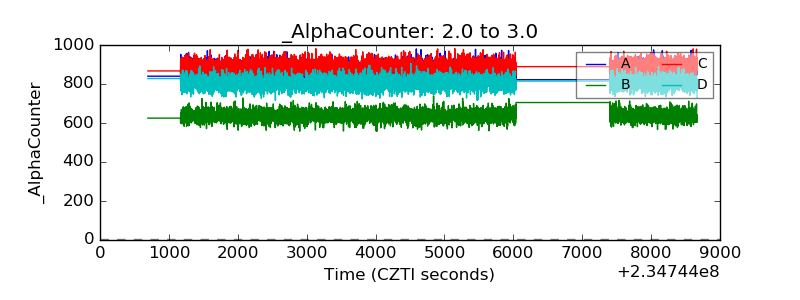 |
| _CPM_Rate | 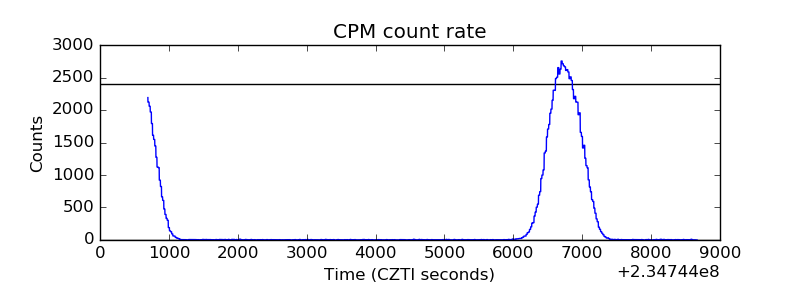 |
| CZT Counter | 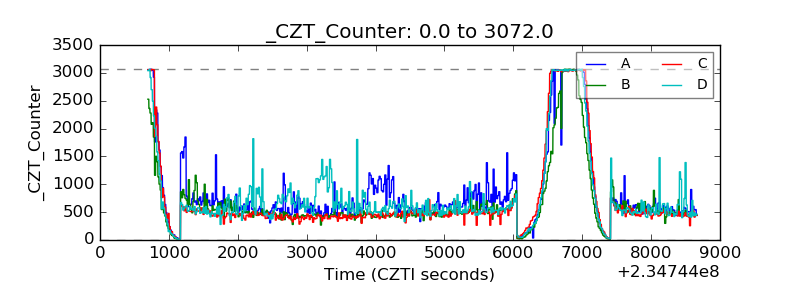 |
| +2.5 Volts monitor |  |
| +5 Volts monitor |  |
| _ROLL_ROT | 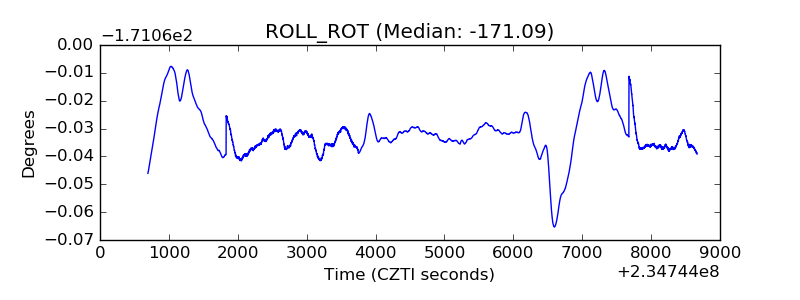 |
| _Roll_DEC | 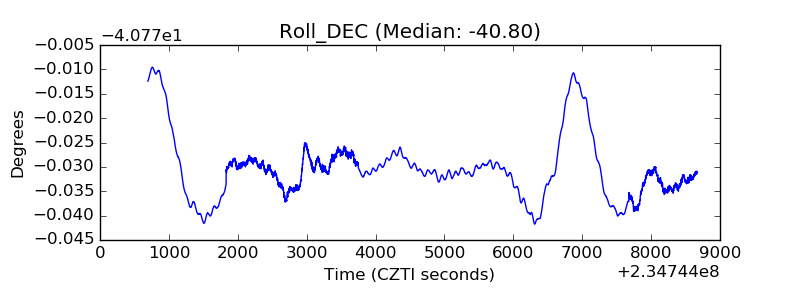 |
| _Roll_RA | 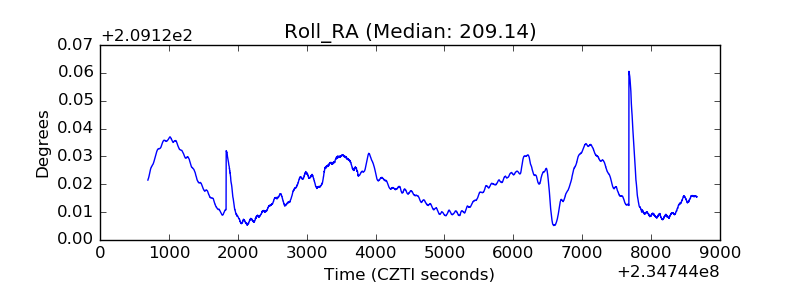 |
| Veto Counter | 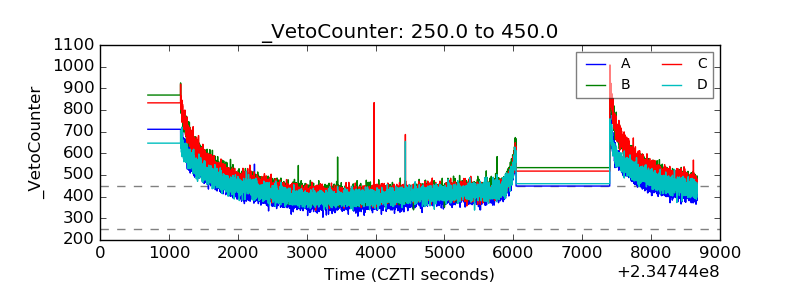 |