| Param | Original file | Final file |
|---|---|---|
| Filename | modeM0/AS1C02_041T02_9000001282_09191cztM0_level2.evt | modeM0/AS1C02_041T02_9000001282_09191cztM0_level2_quad_clean.evt |
| Size (bytes) | 447,840,000 | 78,768,000 |
| Size | 427.1 MB | 75.1 MB |
| Events in quadrant A | 3,517,567 | 492,616 |
| Events in quadrant B | 3,138,977 | 507,626 |
| Events in quadrant C | 2,915,492 | 494,298 |
| Events in quadrant D | 3,575,813 | 464,012 |
| Mode SS | |||
|---|---|---|---|
| Quadrant | BADHDUFLAG | Total packets | Discarded packets |
| A | 0 | 122 | 0 |
| B | 0 | 122 | 0 |
| C | 0 | 122 | 0 |
| D | 0 | 122 | 0 |
| Mode M0 | |||
|---|---|---|---|
| Quadrant | BADHDUFLAG | Total packets | Discarded packets |
| A | 0 | 14379 | 5 |
| B | 0 | 13108 | 2 |
| C | 0 | 12532 | 2 |
| D | 0 | 14717 | 2 |
| Mode M9 | |||
|---|---|---|---|
| Quadrant | BADHDUFLAG | Total packets | Discarded packets |
| A | 0 | 19 | 0 |
| B | 0 | 19 | 0 |
| C | 0 | 19 | 0 |
| D | 0 | 20 | 0 |
| Quadrant | Total seconds | Saturated seconds | Saturation percentage |
|---|---|---|---|
| A | 6118 | 51 | 0.833606% |
| B | 6119 | 47 | 0.768099% |
| C | 6119 | 17 | 0.277823% |
| D | 6119 | 103 | 1.683282% |
Noise dominated data is calculated using 1-second bins in cleaned event files. If a bin has >2000 counts, and if more than 50% of those come from <1% of pixels, then it is considered to be noise-dominated and hence unusable.
| Quadrant | # 1 sec bins | Bins with >0 counts | Bins with >2000 counts | High rate bins dominated by noise | Noise dominated (total time) | Noise dominated (detector-on time) | Marked lightcurve |
|---|---|---|---|---|---|---|---|
| A | 7494 | 6118 | 13 | 13 | 0.17% | 0.21% |  |
| B | 7494 | 6119 | 2 | 2 | 0.03% | 0.03% |  |
| C | 7494 | 6120 | 0 | 0 | 0.00% | 0.00% |  |
| D | 7494 | 6120 | 91 | 91 | 1.21% | 1.49% |  |
Top three noisy pixels from each quadrant. If the there are fewer than three noisy pixels in the level2.evt file, extra rows are filled as -1
| Pixel properties | Quadrant properties | ||||||
|---|---|---|---|---|---|---|---|
| Quadrant | DetID | PixID | Counts | Sigma | Mean | Median | Sigma |
| A | 8 | 5 | 348764 | 2267.77 | 763 | 751 | 153.5 |
| A | 1 | 162 | 99814 | 645.53 | 763 | 751 | 153.5 |
| A | 1 | 178 | 21772 | 136.98 | 763 | 751 | 153.5 |
| B | 8 | 234 | 38277 | 258.14 | 776 | 759 | 145.3 |
| B | 0 | 245 | 21795 | 144.74 | 776 | 759 | 145.3 |
| B | 12 | 111 | 15261 | 99.78 | 776 | 759 | 145.3 |
| C | 13 | 61 | 5828 | 29.6 | 746 | 751 | 171.5 |
| C | 8 | 222 | 2985 | 13.02 | 746 | 751 | 171.5 |
| C | 3 | 202 | 1820 | 6.23 | 746 | 751 | 171.5 |
| D | 1 | 52 | 327264 | 1819.09 | 735 | 714 | 179.5 |
| D | 7 | 71 | 137565 | 762.35 | 735 | 714 | 179.5 |
| D | 9 | 64 | 95029 | 525.39 | 735 | 714 | 179.5 |
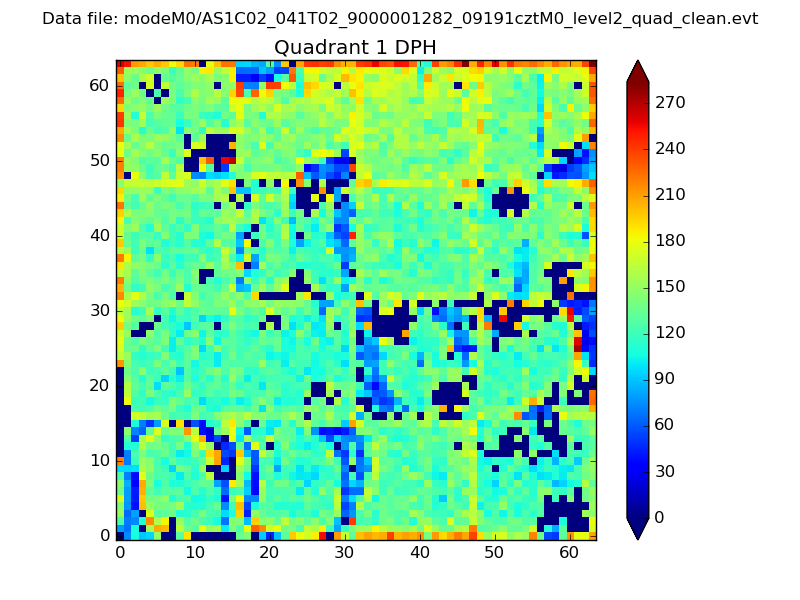
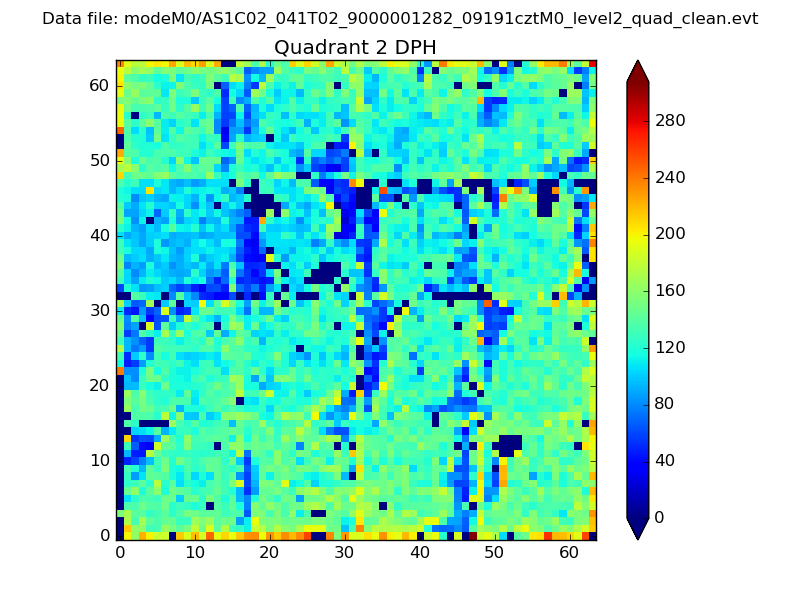
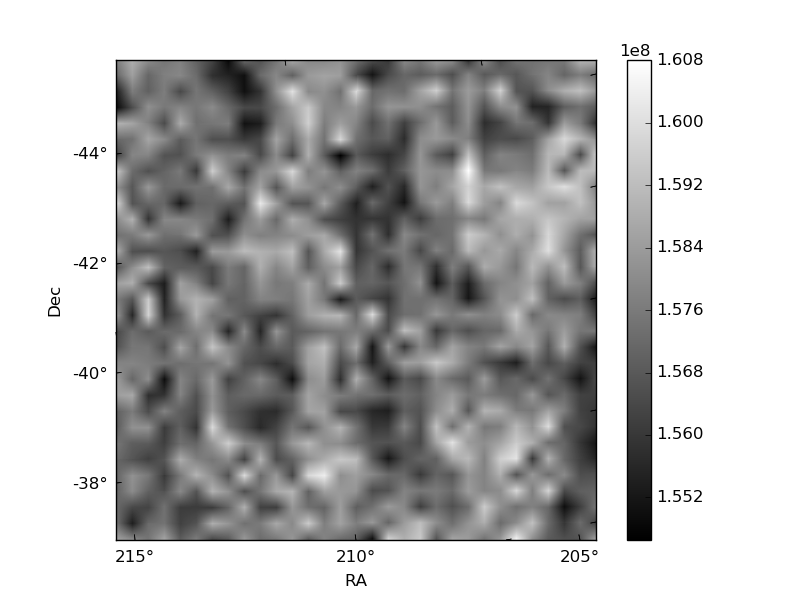
Histogram calculated using DETX and DETY for each event in the final _common_clean file
| Quadrant A |  |
 |
Quadrant B |
|---|---|---|---|
| Quadrant D | 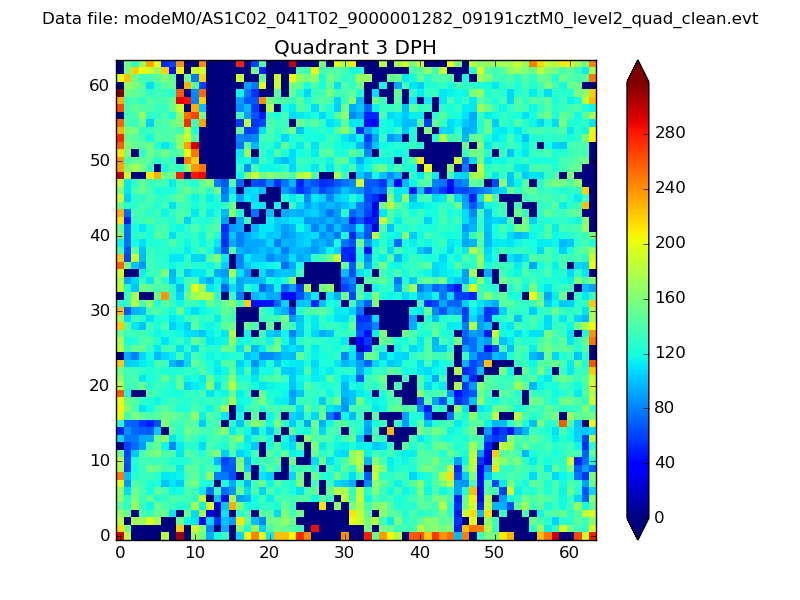 |
 |
Quadrant C |
| Plot type | Count rate plots | Images |
|---|---|---|
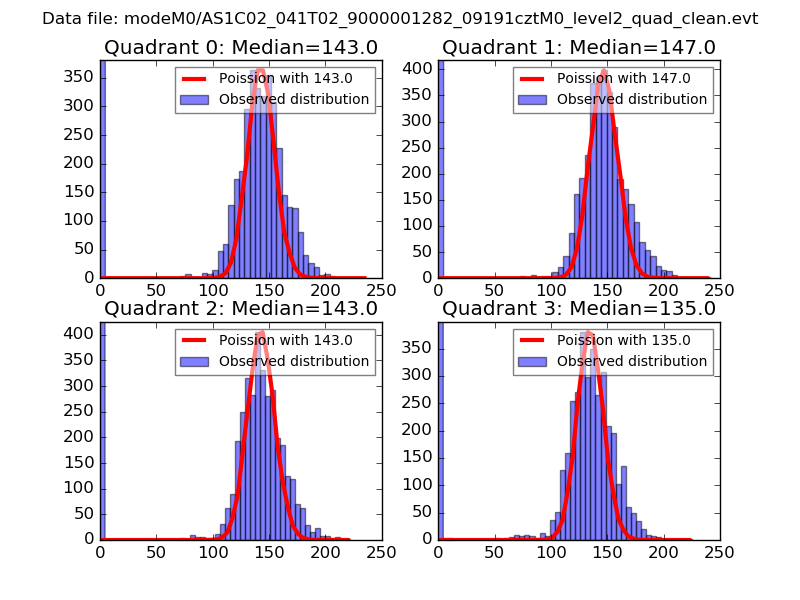
| Comparison with Poisson distribution Blue bars denote a histogram of data divided into 1 sec bins. Red curve is a Poisson curve with rate = median count rate of data. |
 |
 |
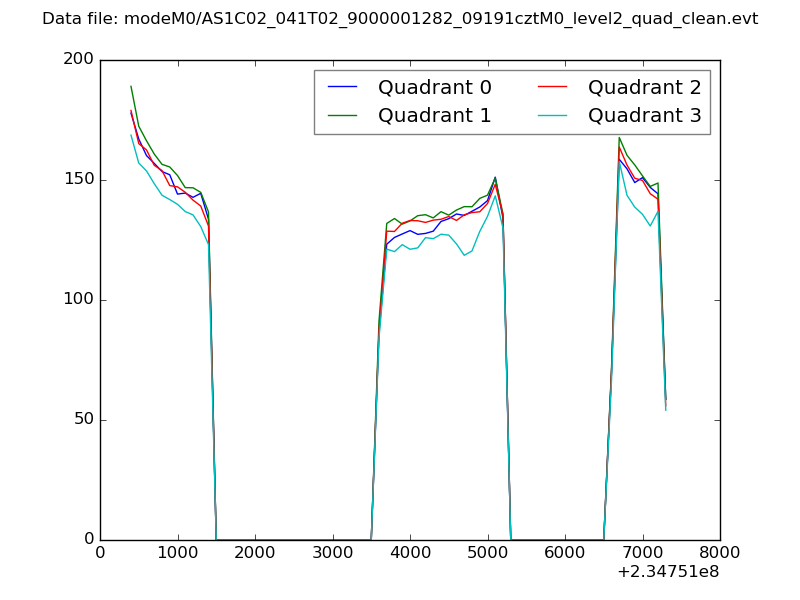
| Quadrant-wise count rates Data is divided into 100 sec bins |
 |
|
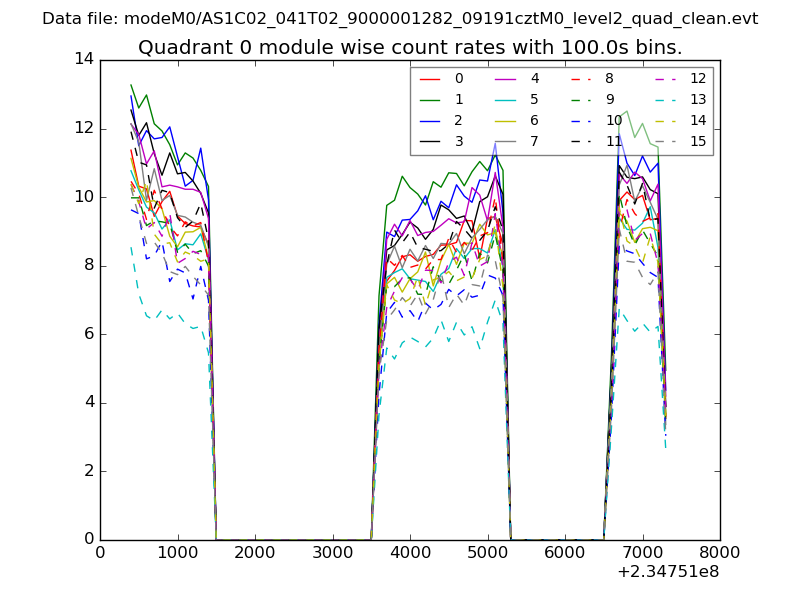
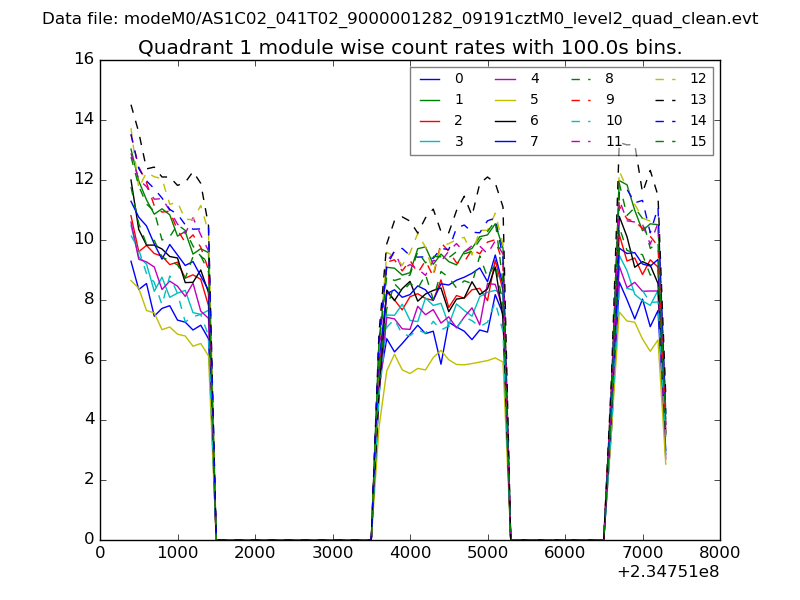
| Module-wise count rates for Quadrant A Data is divided into 100 sec bins |
 |
 |
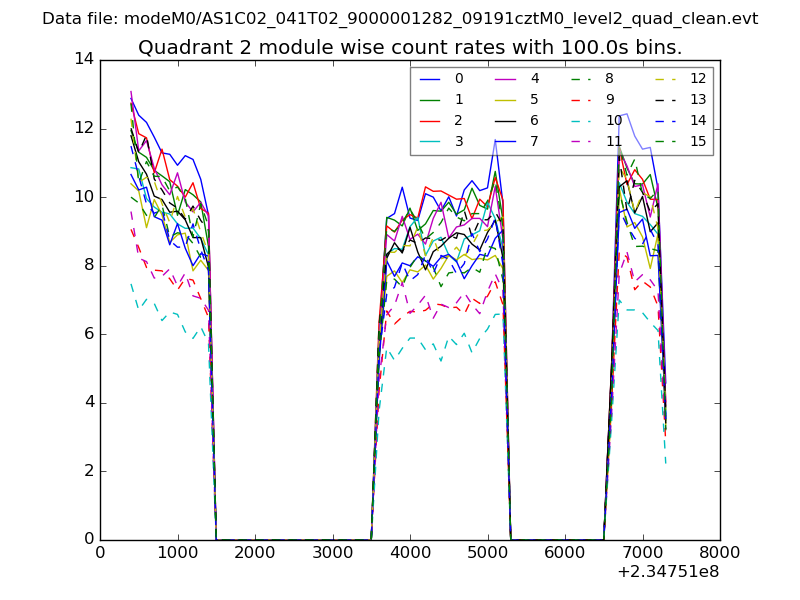
| Module-wise count rates for Quadrant B Data is divided into 100 sec bins |
 |
 |
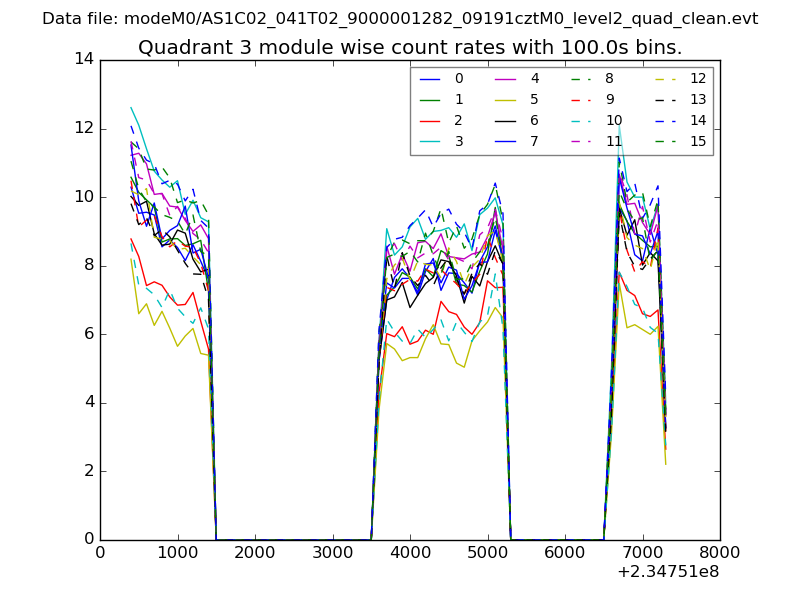
| Module-wise count rates for Quadrant C Data is divided into 100 sec bins |
 |
 |
| Module-wise count rates for Quadrant D Data is divided into 100 sec bins |
 |
 |
| Parameter | Plot |
|---|---|
| CZT HV Monitor | 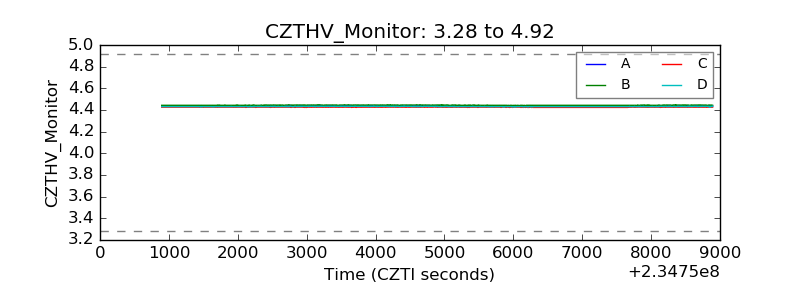 |
| D_VDD | 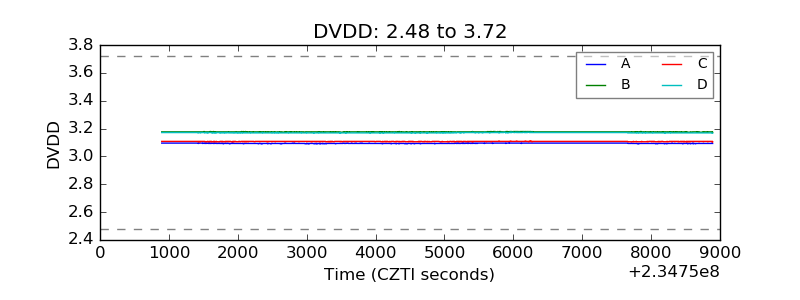 |
| Temperature 1 | 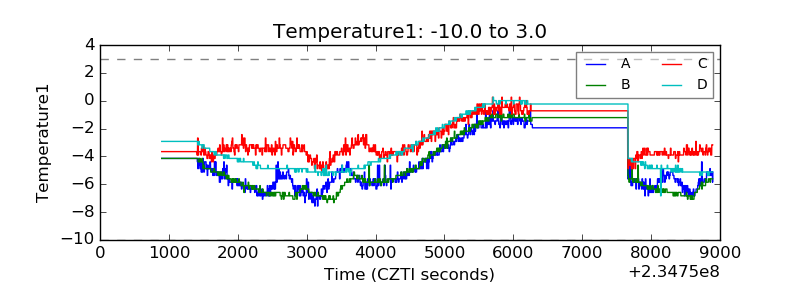 |
| Veto HV Monitor | 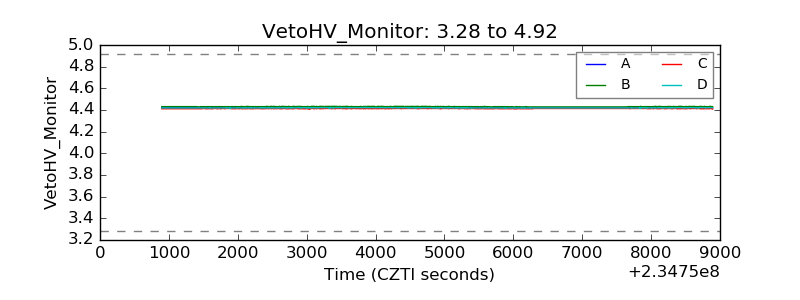 |
| Veto LLD | 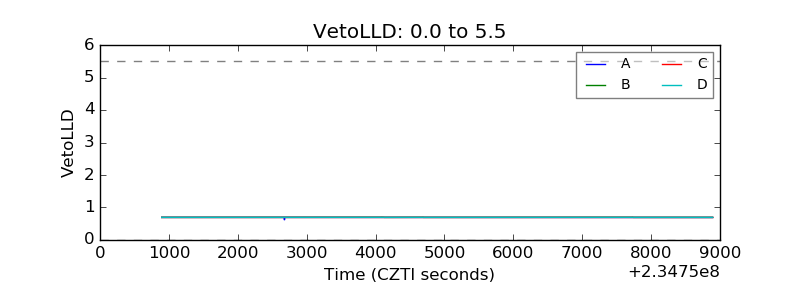 |
| Alpha Counter | 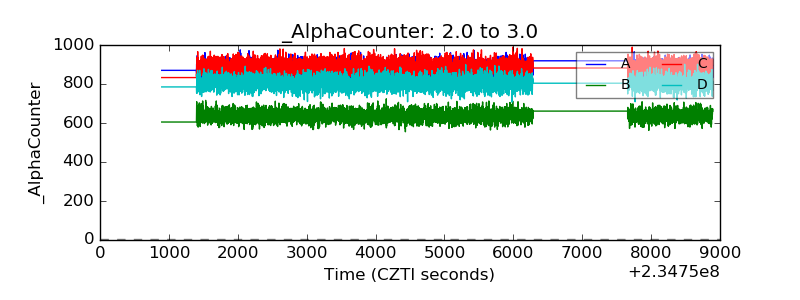 |
| _CPM_Rate | 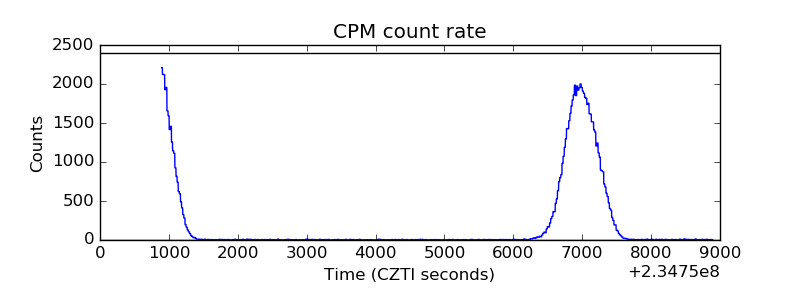 |
| CZT Counter | 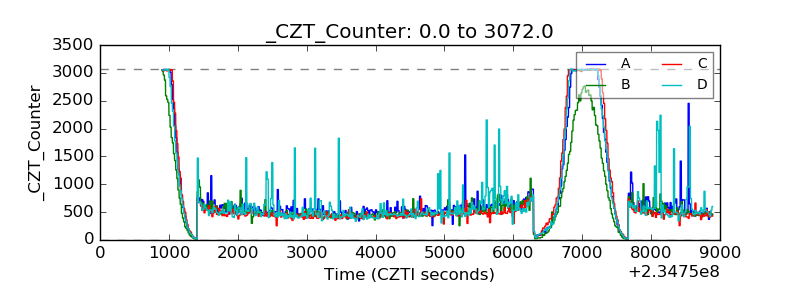 |
| +2.5 Volts monitor |  |
| +5 Volts monitor |  |
| _ROLL_ROT | 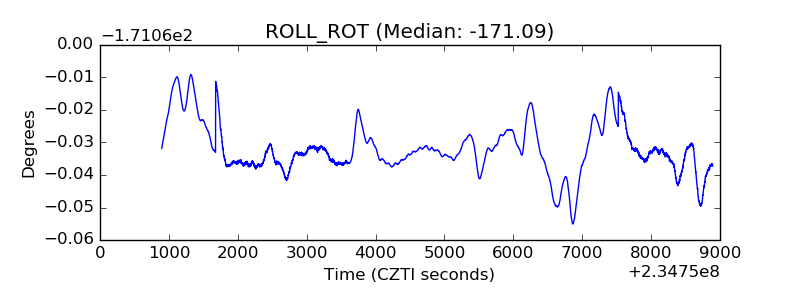 |
| _Roll_DEC | 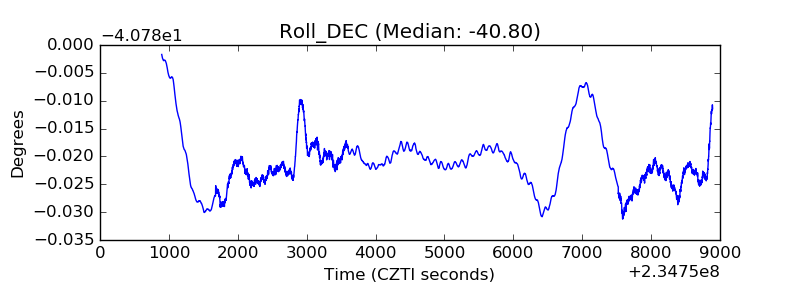 |
| _Roll_RA | 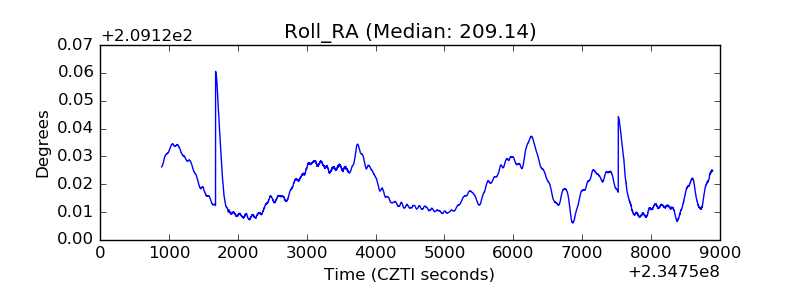 |
| Veto Counter | 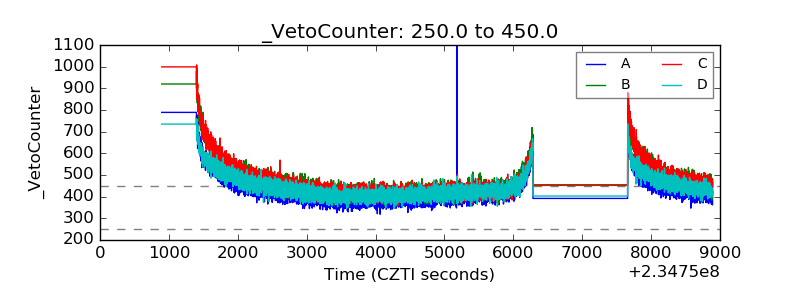 |