| Param | Original file | Final file |
|---|---|---|
| Filename | modeM0/AS1C02_041T02_9000001282_09192cztM0_level2.evt | modeM0/AS1C02_041T02_9000001282_09192cztM0_level2_quad_clean.evt |
| Size (bytes) | 303,071,040 | 49,098,240 |
| Size | 289.0 MB | 46.8 MB |
| Events in quadrant A | 2,411,245 | 294,445 |
| Events in quadrant B | 2,114,950 | 304,924 |
| Events in quadrant C | 1,985,545 | 299,498 |
| Events in quadrant D | 2,372,213 | 283,605 |
| Mode SS | |||
|---|---|---|---|
| Quadrant | BADHDUFLAG | Total packets | Discarded packets |
| A | 0 | 86 | 0 |
| B | 0 | 86 | 0 |
| C | 0 | 86 | 0 |
| D | 0 | 86 | 0 |
| Mode M0 | |||
|---|---|---|---|
| Quadrant | BADHDUFLAG | Total packets | Discarded packets |
| A | 0 | 9927 | 1 |
| B | 0 | 8962 | 1 |
| C | 0 | 8702 | 1 |
| D | 0 | 9885 | 1 |
| Mode M9 | |||
|---|---|---|---|
| Quadrant | BADHDUFLAG | Total packets | Discarded packets |
| A | 0 | 4 | 0 |
| B | 0 | 4 | 0 |
| C | 0 | 4 | 0 |
| D | 0 | 5 | 0 |
| Quadrant | Total seconds | Saturated seconds | Saturation percentage |
|---|---|---|---|
| A | 4319 | 25 | 0.578838% |
| B | 4319 | 7 | 0.162075% |
| C | 4319 | 4 | 0.092614% |
| D | 4319 | 48 | 1.111368% |
Noise dominated data is calculated using 1-second bins in cleaned event files. If a bin has >2000 counts, and if more than 50% of those come from <1% of pixels, then it is considered to be noise-dominated and hence unusable.
| Quadrant | # 1 sec bins | Bins with >0 counts | Bins with >2000 counts | High rate bins dominated by noise | Noise dominated (total time) | Noise dominated (detector-on time) | Marked lightcurve |
|---|---|---|---|---|---|---|---|
| A | 4319 | 4319 | 15 | 15 | 0.35% | 0.35% | 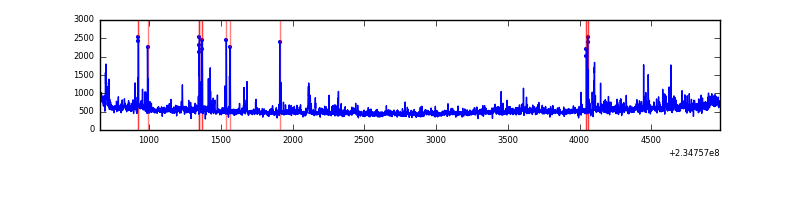 |
| B | 4319 | 4319 | 0 | 0 | 0.00% | 0.00% | 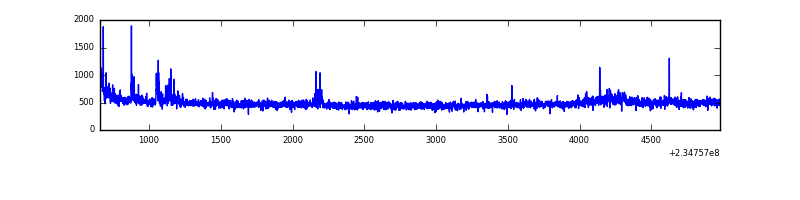 |
| C | 4319 | 4319 | 0 | 0 | 0.00% | 0.00% | 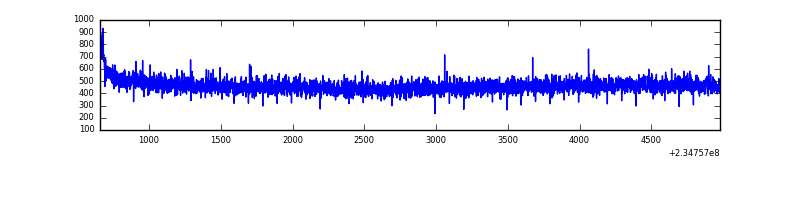 |
| D | 4319 | 4319 | 59 | 59 | 1.37% | 1.37% | 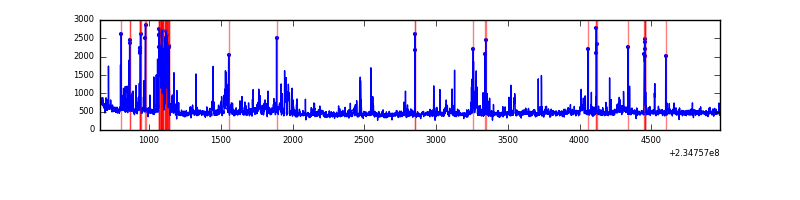 |
Top three noisy pixels from each quadrant. If the there are fewer than three noisy pixels in the level2.evt file, extra rows are filled as -1
| Pixel properties | Quadrant properties | ||||||
|---|---|---|---|---|---|---|---|
| Quadrant | DetID | PixID | Counts | Sigma | Mean | Median | Sigma |
| A | 8 | 5 | 250262 | 2359.7 | 518 | 509 | 105.8 |
| A | 1 | 162 | 67743 | 635.24 | 518 | 509 | 105.8 |
| A | 15 | 223 | 18230 | 167.43 | 518 | 509 | 105.8 |
| B | 0 | 187 | 22143 | 218.15 | 523 | 512 | 99.2 |
| B | 0 | 197 | 17705 | 173.39 | 523 | 512 | 99.2 |
| B | 8 | 234 | 14919 | 145.29 | 523 | 512 | 99.2 |
| C | 13 | 61 | 3917 | 28.84 | 508 | 512 | 118.1 |
| C | 8 | 222 | 2284 | 15.01 | 508 | 512 | 118.1 |
| C | 14 | 67 | 1300 | 6.67 | 508 | 512 | 118.1 |
| D | 1 | 52 | 235872 | 1757.27 | 498 | 488 | 133.9 |
| D | 7 | 71 | 108823 | 808.78 | 498 | 488 | 133.9 |
| D | 12 | 233 | 40033 | 295.22 | 498 | 488 | 133.9 |
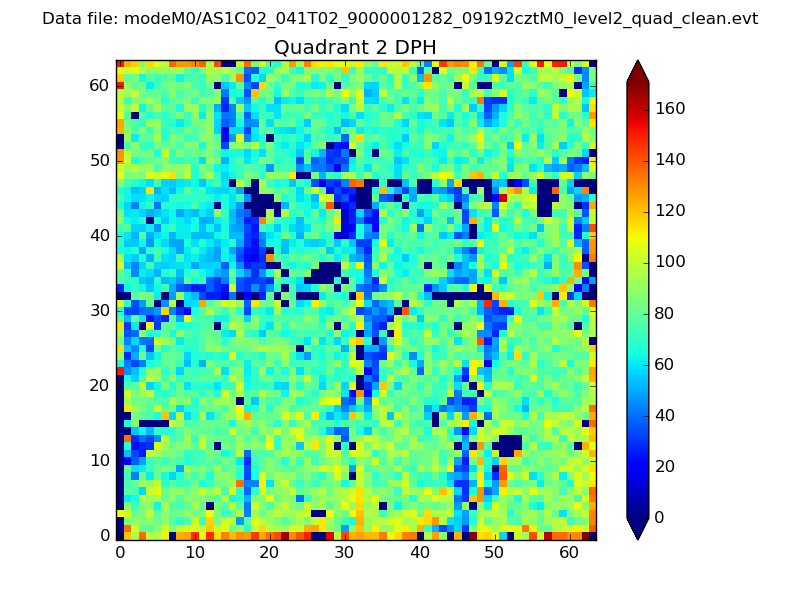
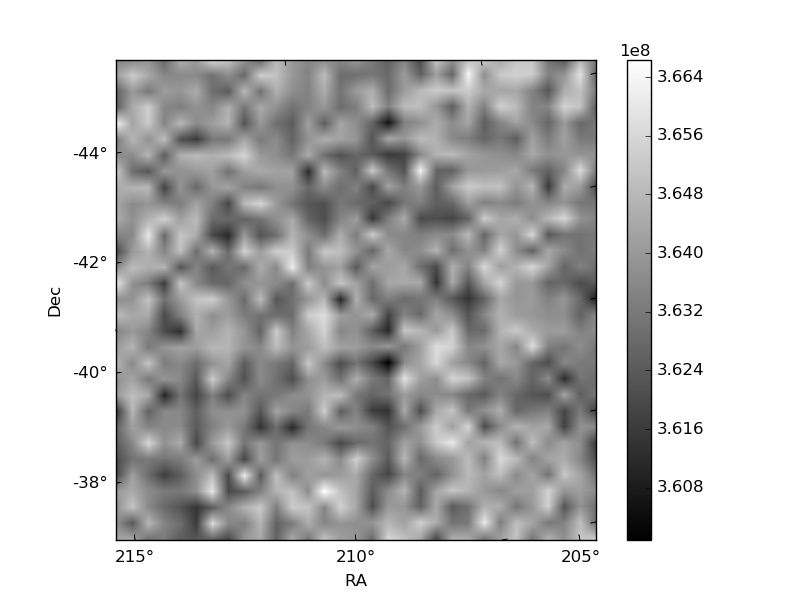
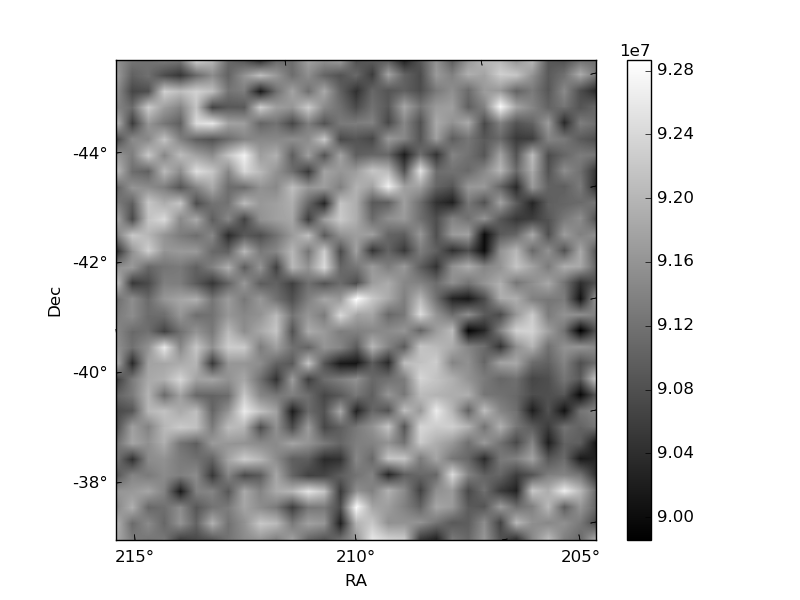
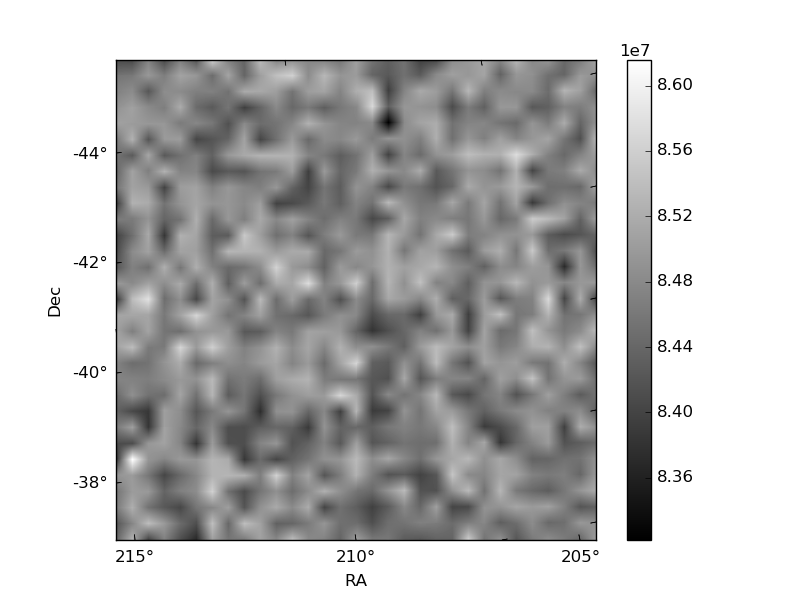
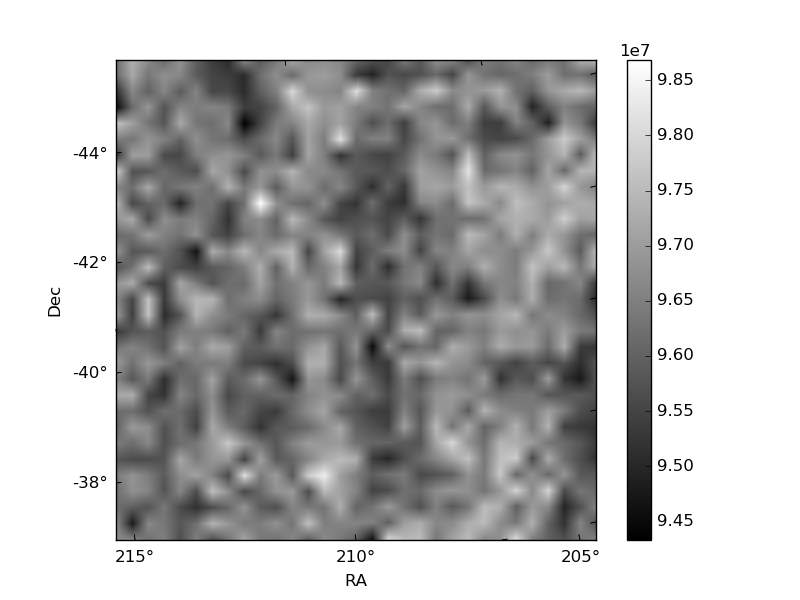
Histogram calculated using DETX and DETY for each event in the final _common_clean file
| Quadrant A | 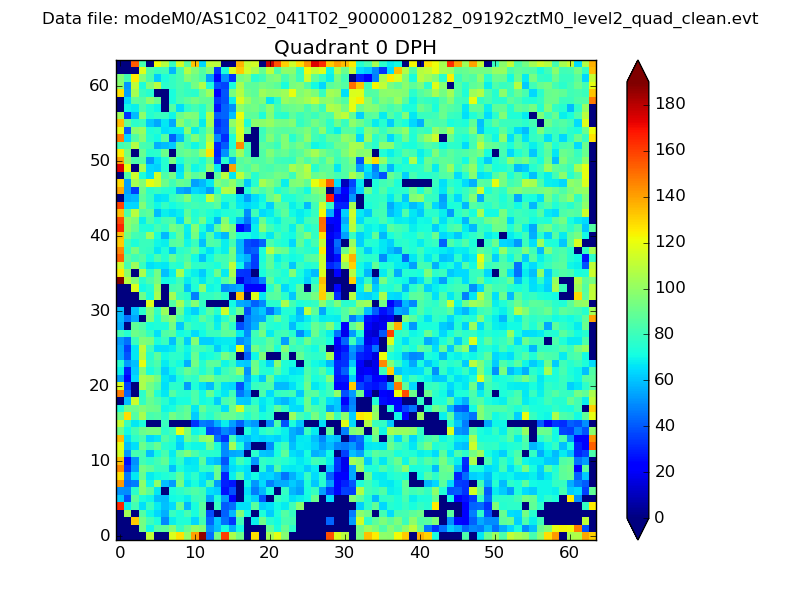 |
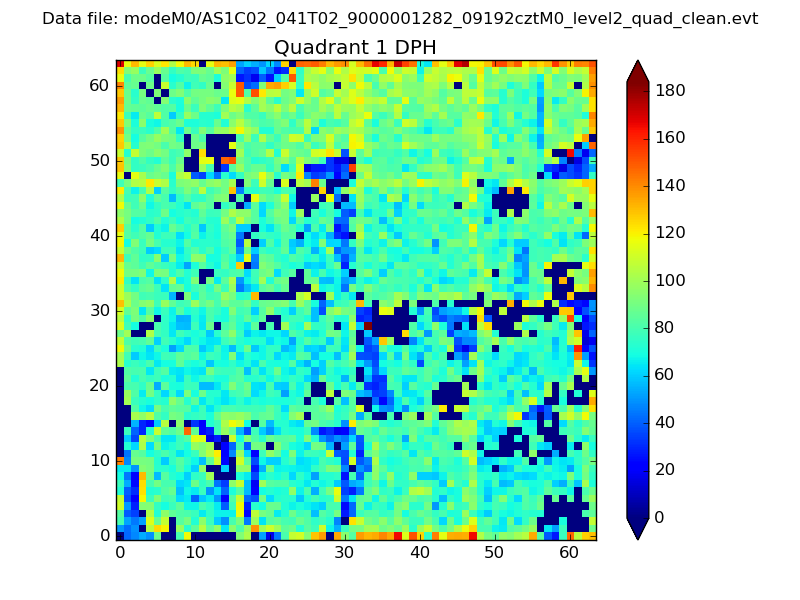 |
Quadrant B |
|---|---|---|---|
| Quadrant D | 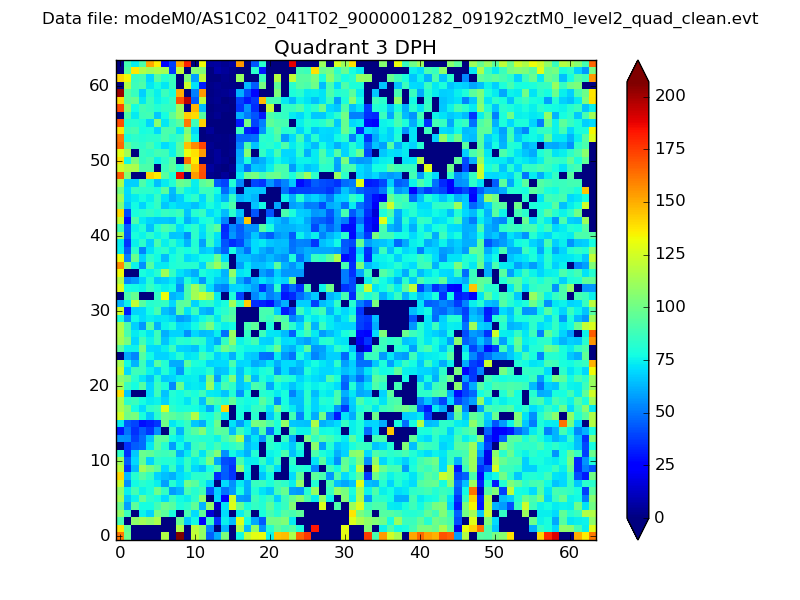 |
 |
Quadrant C |
| Plot type | Count rate plots | Images |
|---|---|---|
| Comparison with Poisson distribution Blue bars denote a histogram of data divided into 1 sec bins. Red curve is a Poisson curve with rate = median count rate of data. |
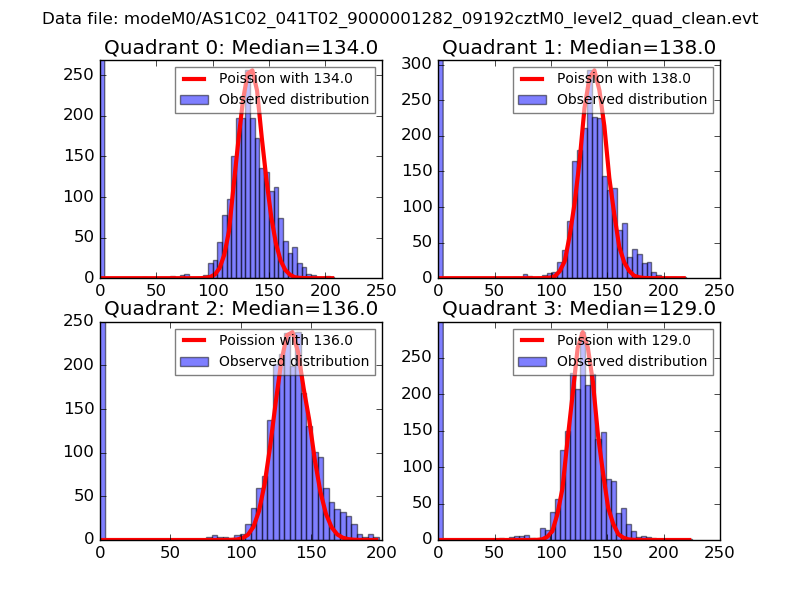 |
 |
| Quadrant-wise count rates Data is divided into 100 sec bins |
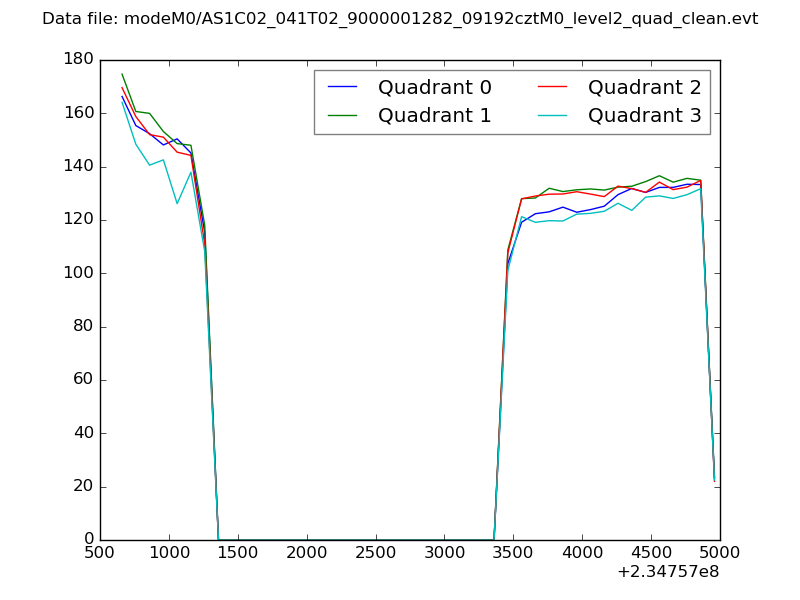 |
|
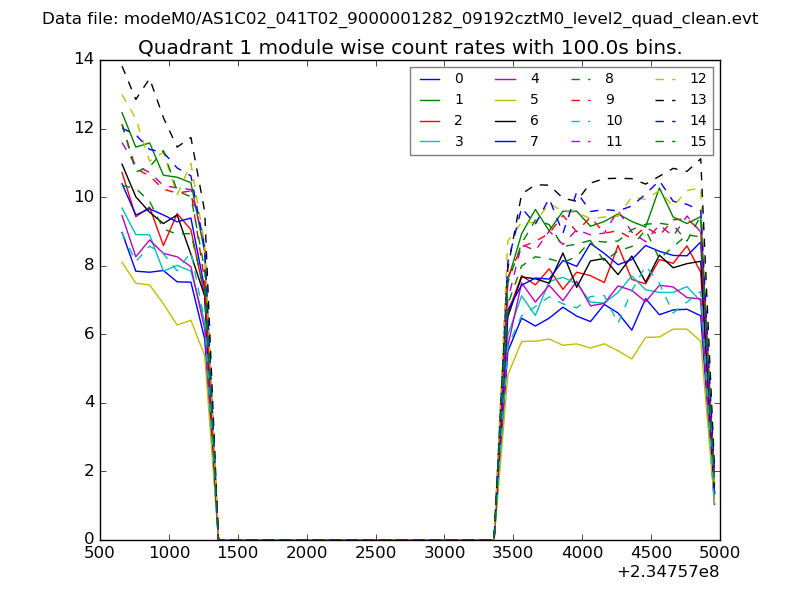
| Module-wise count rates for Quadrant A Data is divided into 100 sec bins |
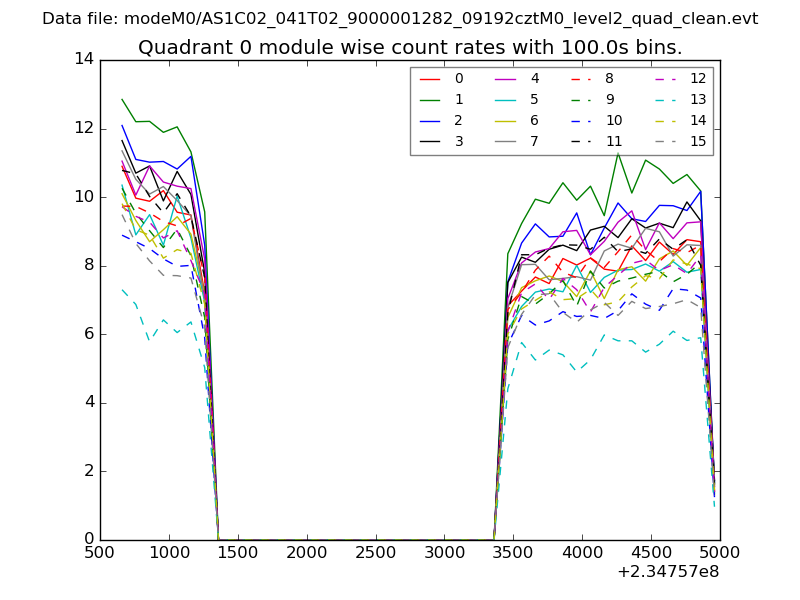 |
 |
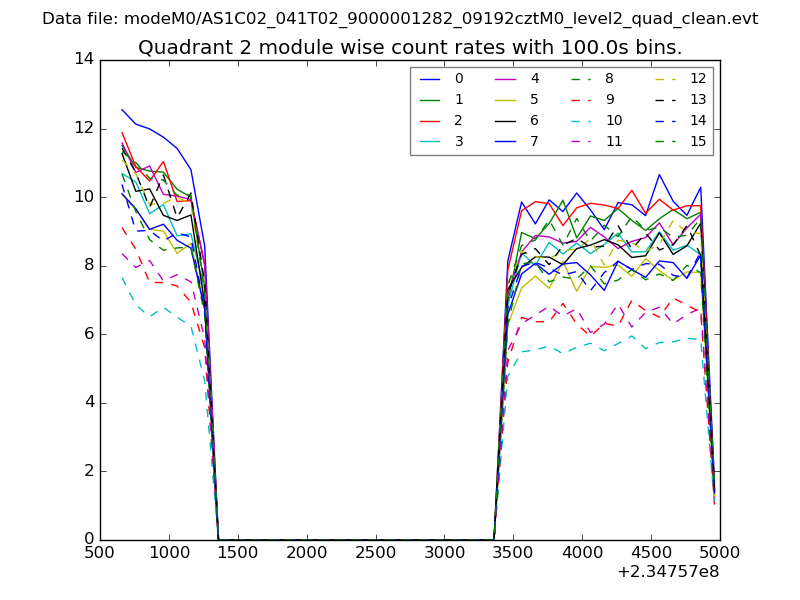
| Module-wise count rates for Quadrant B Data is divided into 100 sec bins |
 |
 |
| Module-wise count rates for Quadrant C Data is divided into 100 sec bins |
 |
 |
| Module-wise count rates for Quadrant D Data is divided into 100 sec bins |
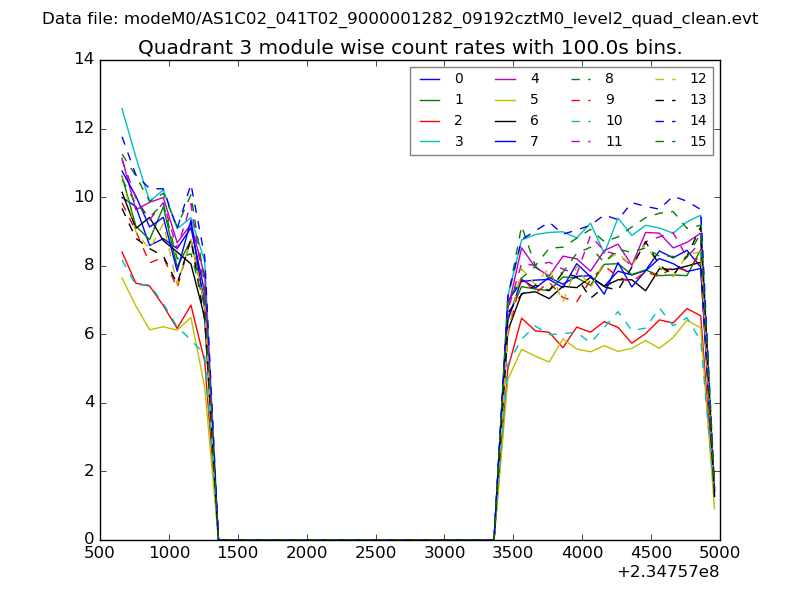 |
 |
| Parameter | Plot |
|---|---|
| CZT HV Monitor | 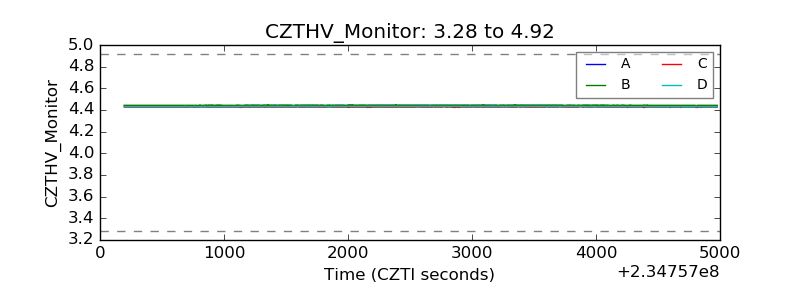 |
| D_VDD | 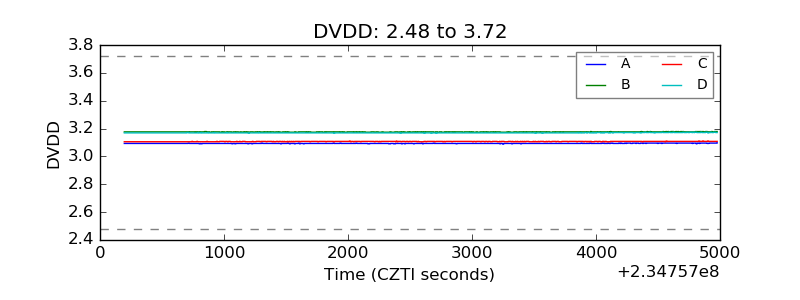 |
| Temperature 1 | 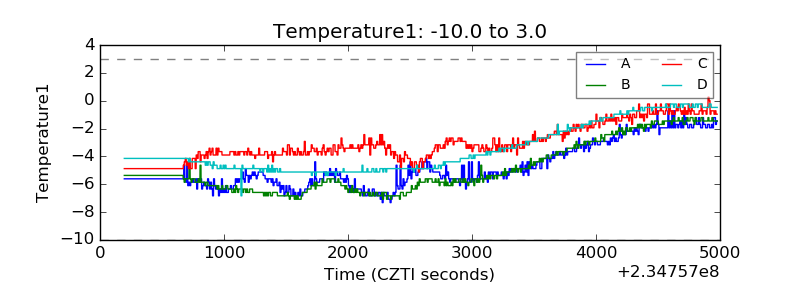 |
| Veto HV Monitor | 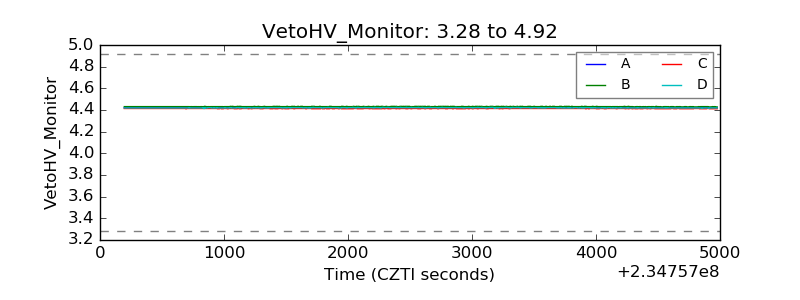 |
| Veto LLD |  |
| Alpha Counter | 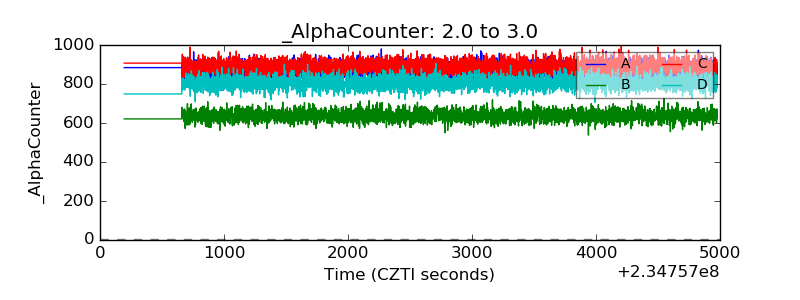 |
| _CPM_Rate | 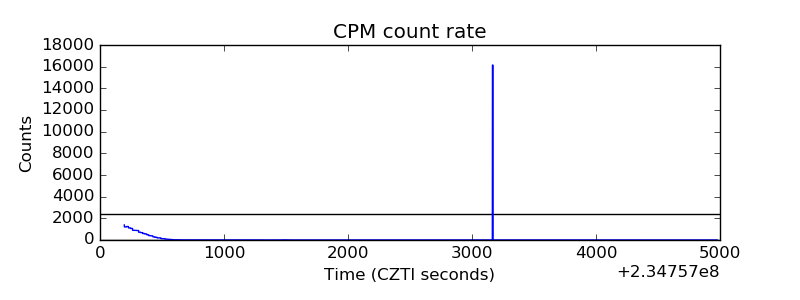 |
| CZT Counter | 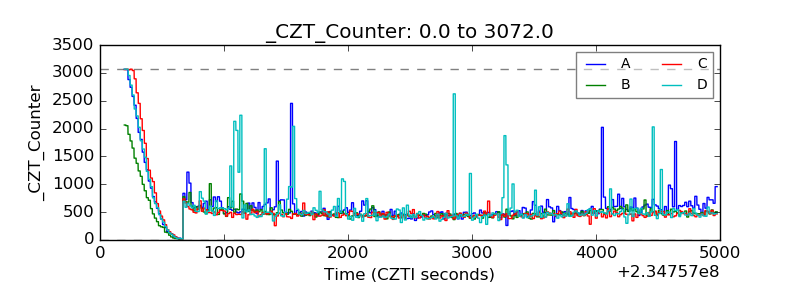 |
| +2.5 Volts monitor |  |
| +5 Volts monitor |  |
| _ROLL_ROT | 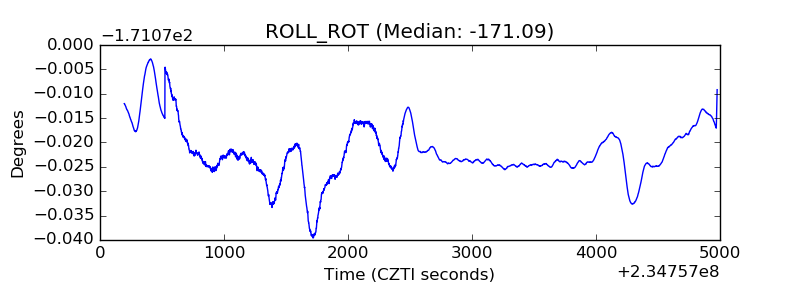 |
| _Roll_DEC | 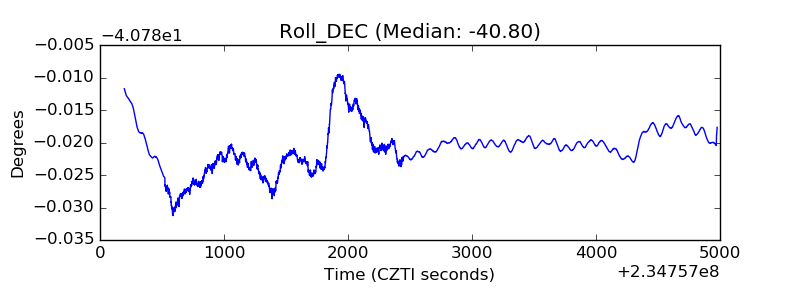 |
| _Roll_RA | 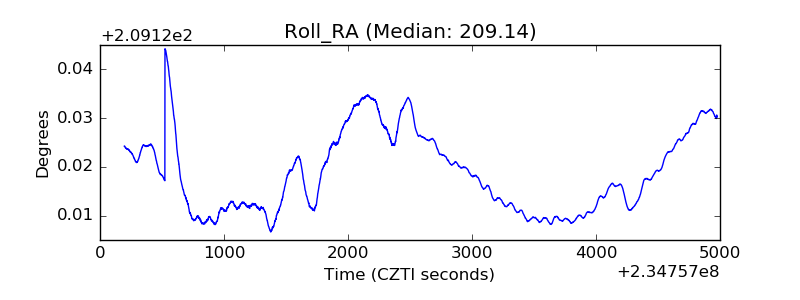 |
| Veto Counter | 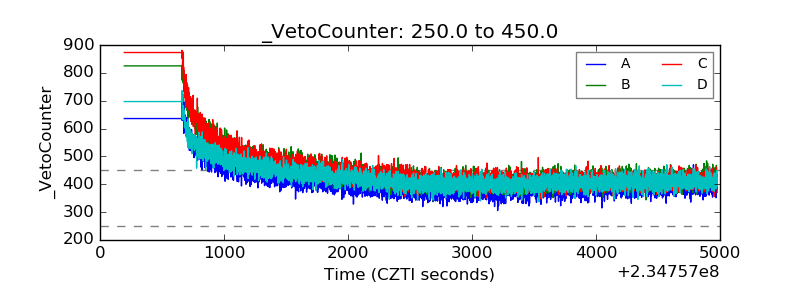 |