| Param | Original file | Final file |
|---|---|---|
| Filename | modeM0/AS1C02_042T02_9000001284cztM0_level2.fits | modeM0/AS1C02_042T02_9000001284cztM0_level2_quad_clean.evt |
| Size (bytes) | 27,512,640 | 39,862,080 |
| Size | 26.2 MB | 38.0 MB |
| Events in quadrant A | 161,440 | 257,534 |
| Events in quadrant B | 156,150 | 258,943 |
| Events in quadrant C | 159,104 | 245,263 |
| Events in quadrant D | 139,314 | 227,423 |
| Mode M9 | |||
|---|---|---|---|
| Quadrant | BADHDUFLAG | Total packets | Discarded packets |
| A | 0 | 129 | 0 |
| B | 0 | 129 | 0 |
| C | 0 | 129 | 0 |
| D | 0 | 129 | 0 |
| Mode SS | |||
|---|---|---|---|
| Quadrant | BADHDUFLAG | Total packets | Discarded packets |
| A | 0 | 58 | 0 |
| B | 0 | 62 | 0 |
| C | 0 | 62 | 0 |
| D | 0 | 60 | 0 |
| Mode M0 | |||
|---|---|---|---|
| Quadrant | BADHDUFLAG | Total packets | Discarded packets |
| A | 0 | 6582 | 0 |
| B | 0 | 6221 | 0 |
| C | 0 | 6392 | 0 |
| D | 0 | 6408 | 0 |
| Quadrant | Total seconds | Saturated seconds | Saturation percentage |
|---|---|---|---|
| A | 3046 | 5 | 0.164150% |
| B | 3054 | 0 | 0.000000% |
| C | 3056 | 3 | 0.098168% |
| D | 3056 | 6 | 0.196335% |
Noise dominated data is calculated using 1-second bins in cleaned event files. If a bin has >2000 counts, and if more than 50% of those come from <1% of pixels, then it is considered to be noise-dominated and hence unusable.
| Quadrant | # 1 sec bins | Bins with >0 counts | Bins with >2000 counts | High rate bins dominated by noise | Noise dominated (total time) | Noise dominated (detector-on time) | Marked lightcurve |
|---|---|---|---|---|---|---|---|
| A | 3096 | 3070 | 0 | 0 | 0.00% | 0.00% |  |
| B | 3095 | 3085 | 0 | 0 | 0.00% | 0.00% | 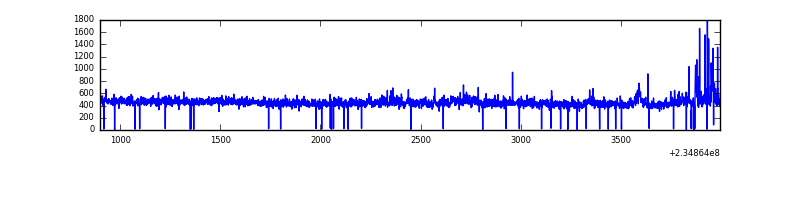 |
| C | 3096 | 3086 | 0 | 0 | 0.00% | 0.00% |  |
| D | 3096 | 3086 | 0 | 0 | 0.00% | 0.00% |  |
Top three noisy pixels from each quadrant. If the there are fewer than three noisy pixels in the level2.evt file, extra rows are filled as -1
| Pixel properties | Quadrant properties | ||||||
|---|---|---|---|---|---|---|---|
| Quadrant | DetID | PixID | Counts | Sigma | Mean | Median | Sigma |
| A | 14 | 188 | 178 | 11.34 | 41 | 39 | 12.3 |
| A | 0 | 29 | 138 | 8.08 | 41 | 39 | 12.3 |
| A | 7 | 110 | 136 | 7.91 | 41 | 39 | 12.3 |
| B | 2 | 9 | 152 | 10.77 | 41 | 39 | 10.5 |
| B | 3 | 17 | 123 | 8.0 | 41 | 39 | 10.5 |
| B | 5 | 128 | 117 | 7.43 | 41 | 39 | 10.5 |
| C | 3 | 202 | 133 | 7.32 | 41 | 39 | 12.8 |
| C | 12 | 250 | 131 | 7.16 | 41 | 39 | 12.8 |
| C | 1 | 80 | 122 | 6.46 | 41 | 39 | 12.8 |
| D | 1 | 19 | 119 | 6.74 | 39 | 36 | 12.3 |
| D | 3 | 31 | 116 | 6.49 | 39 | 36 | 12.3 |
| D | 4 | 246 | 115 | 6.41 | 39 | 36 | 12.3 |
Histogram calculated using DETX and DETY for each event in the final _common_clean file
| Quadrant A | 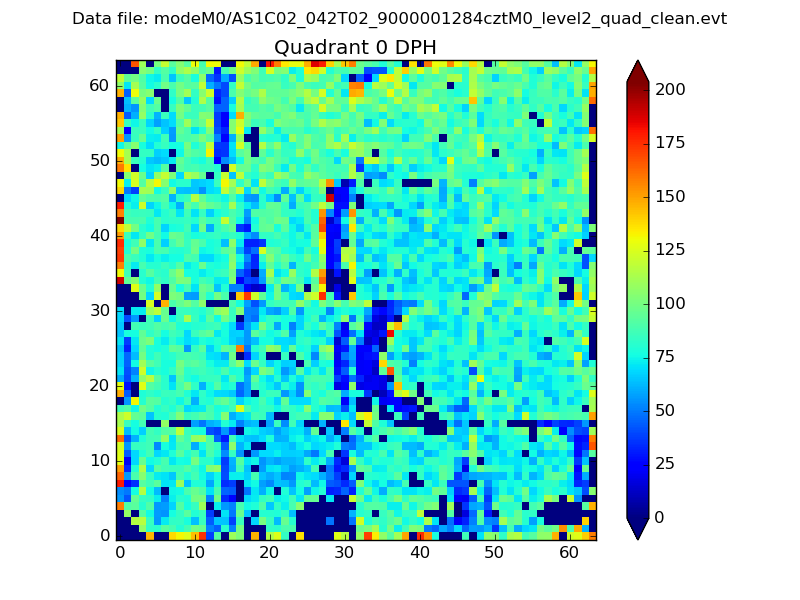 |
 |
Quadrant B |
|---|---|---|---|
| Quadrant D | 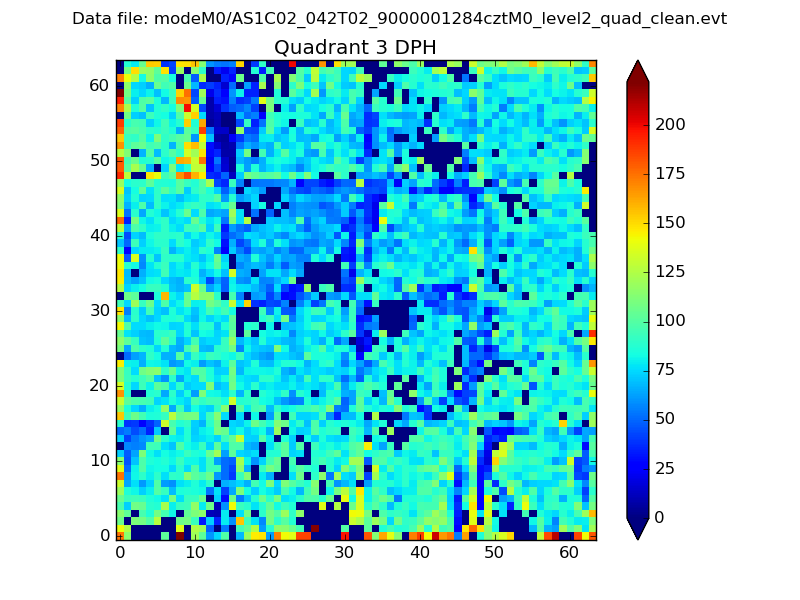 |
 |
Quadrant C |
| Plot type | Count rate plots | Images |
|---|---|---|
| Comparison with Poisson distribution Blue bars denote a histogram of data divided into 1 sec bins. Red curve is a Poisson curve with rate = median count rate of data. |
 |
 |
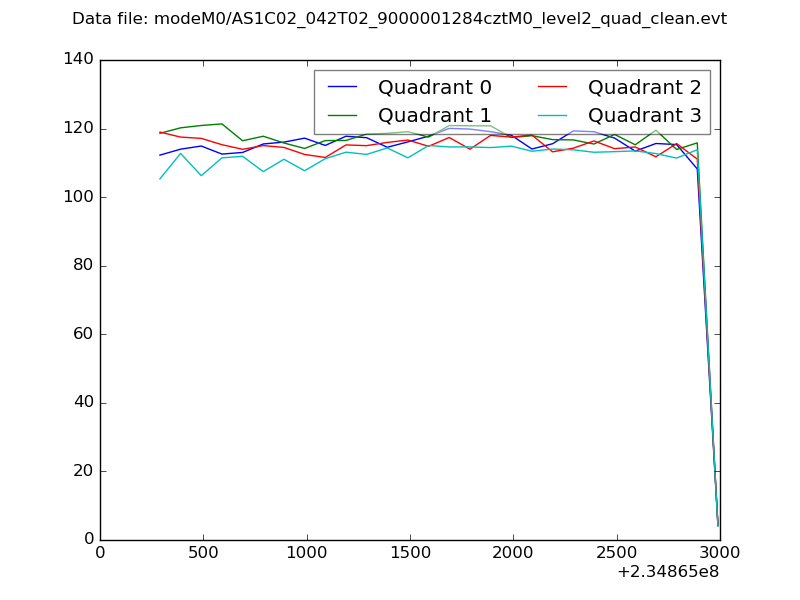
| Quadrant-wise count rates Data is divided into 100 sec bins |
 |
|
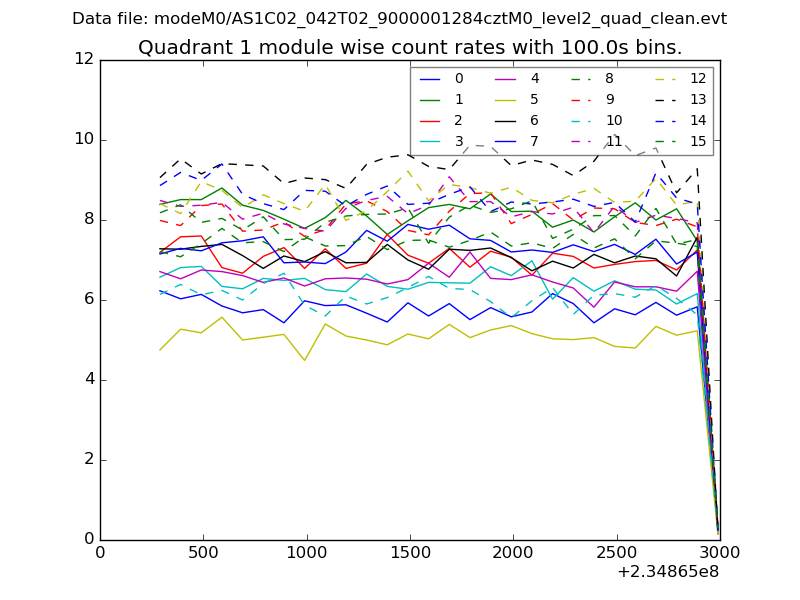
| Module-wise count rates for Quadrant A Data is divided into 100 sec bins |
 |
 |
| Module-wise count rates for Quadrant B Data is divided into 100 sec bins |
 |
 |
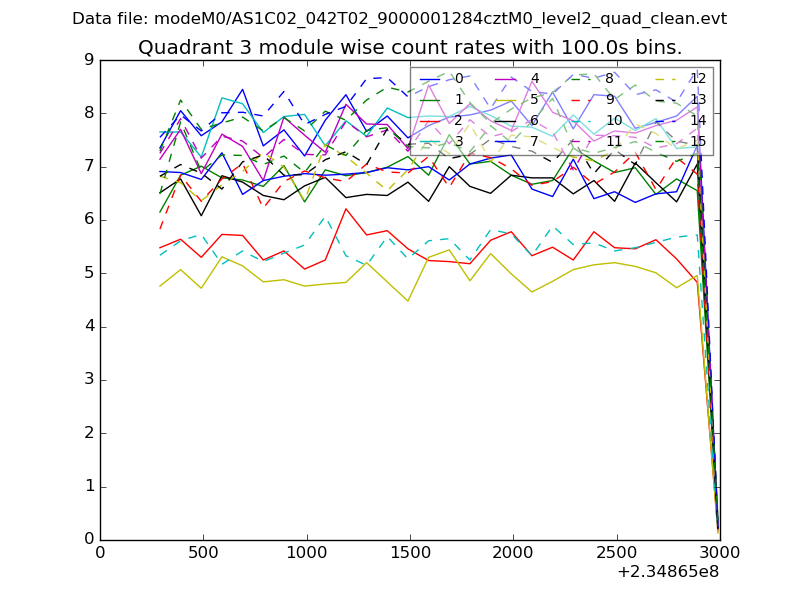
| Module-wise count rates for Quadrant C Data is divided into 100 sec bins |
 |
 |
| Module-wise count rates for Quadrant D Data is divided into 100 sec bins |
 |
 |
| Parameter | Plot |
|---|---|
| CZT HV Monitor | 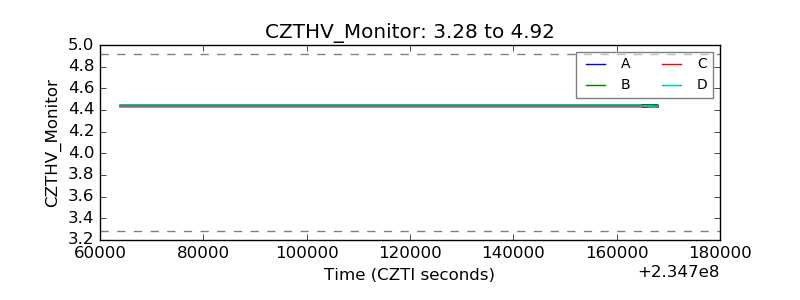 |
| D_VDD | 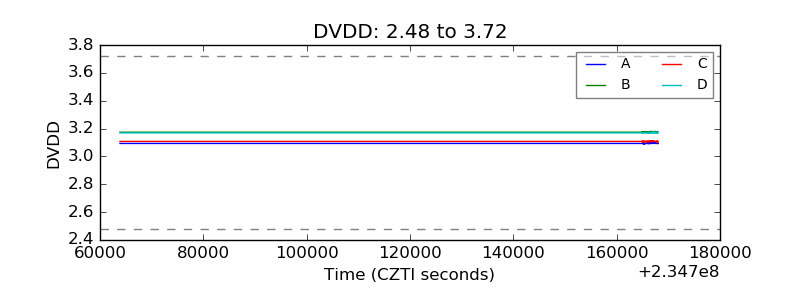 |
| Temperature 1 |  |
| Veto HV Monitor |  |
| Veto LLD | 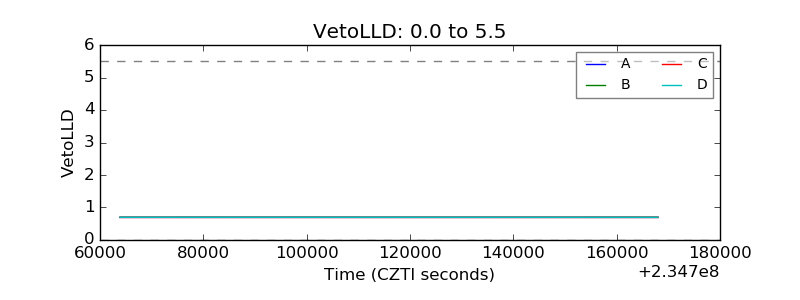 |
| Alpha Counter |  |
| _CPM_Rate | 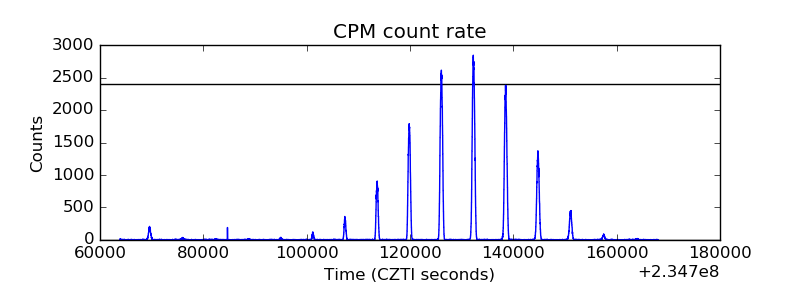 |
| CZT Counter |  |
| +2.5 Volts monitor | 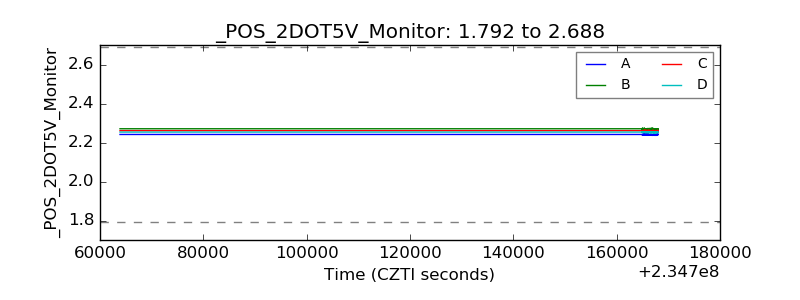 |
| +5 Volts monitor |  |
| _ROLL_ROT |  |
| _Roll_DEC |  |
| _Roll_RA |  |
| Veto Counter |  |