| Param | Original file | Final file |
|---|---|---|
| Filename | modeM0/AS1C02_042T02_9000001284_09193cztM0_level2.evt | modeM0/AS1C02_042T02_9000001284_09193cztM0_level2_quad_clean.evt |
| Size (bytes) | 499,697,280 | 68,192,640 |
| Size | 476.5 MB | 65.0 MB |
| Events in quadrant A | 3,900,273 | 405,162 |
| Events in quadrant B | 3,359,530 | 411,700 |
| Events in quadrant C | 3,181,647 | 404,363 |
| Events in quadrant D | 4,235,943 | 375,236 |
| Mode M9 | |||
|---|---|---|---|
| Quadrant | BADHDUFLAG | Total packets | Discarded packets |
| A | 0 | 10 | 0 |
| B | 0 | 10 | 0 |
| C | 0 | 10 | 0 |
| D | 0 | 10 | 0 |
| Mode SS | |||
|---|---|---|---|
| Quadrant | BADHDUFLAG | Total packets | Discarded packets |
| A | 0 | 136 | 0 |
| B | 0 | 136 | 0 |
| C | 0 | 136 | 0 |
| D | 0 | 136 | 0 |
| Mode M0 | |||
|---|---|---|---|
| Quadrant | BADHDUFLAG | Total packets | Discarded packets |
| A | 0 | 15666 | 4 |
| B | 0 | 14129 | 2 |
| C | 0 | 13877 | 2 |
| D | 0 | 17150 | 2 |
| Quadrant | Total seconds | Saturated seconds | Saturation percentage |
|---|---|---|---|
| A | 6716 | 131 | 1.950566% |
| B | 6716 | 125 | 1.861227% |
| C | 6716 | 73 | 1.086957% |
| D | 6716 | 317 | 4.720071% |
Noise dominated data is calculated using 1-second bins in cleaned event files. If a bin has >2000 counts, and if more than 50% of those come from <1% of pixels, then it is considered to be noise-dominated and hence unusable.
| Quadrant | # 1 sec bins | Bins with >0 counts | Bins with >2000 counts | High rate bins dominated by noise | Noise dominated (total time) | Noise dominated (detector-on time) | Marked lightcurve |
|---|---|---|---|---|---|---|---|
| A | 7703 | 6717 | 18 | 18 | 0.23% | 0.27% | 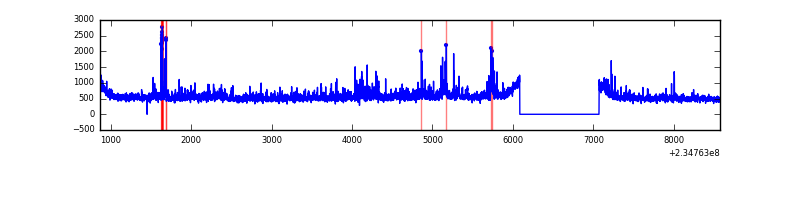 |
| B | 7703 | 6716 | 0 | 0 | 0.00% | 0.00% |  |
| C | 7703 | 6717 | 0 | 0 | 0.00% | 0.00% | 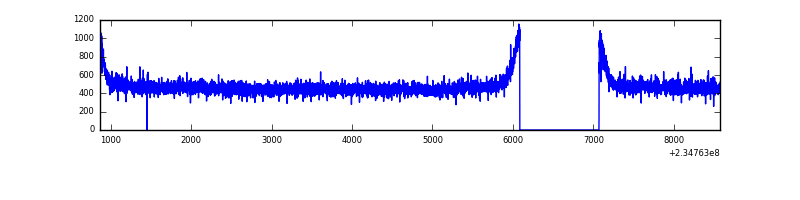 |
| D | 7703 | 6717 | 208 | 208 | 2.70% | 3.10% | 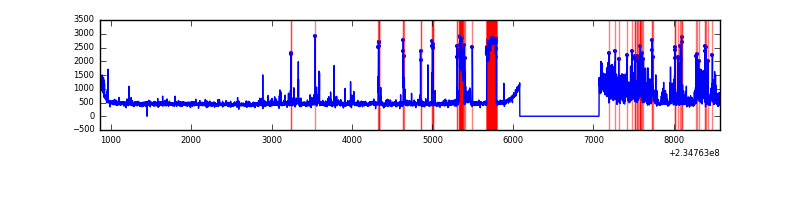 |
Top three noisy pixels from each quadrant. If the there are fewer than three noisy pixels in the level2.evt file, extra rows are filled as -1
| Pixel properties | Quadrant properties | ||||||
|---|---|---|---|---|---|---|---|
| Quadrant | DetID | PixID | Counts | Sigma | Mean | Median | Sigma |
| A | 8 | 5 | 461182 | 2701.97 | 833 | 815 | 170.4 |
| A | 1 | 162 | 116404 | 678.41 | 833 | 815 | 170.4 |
| A | 15 | 174 | 47367 | 273.22 | 833 | 815 | 170.4 |
| B | 8 | 234 | 25268 | 151.74 | 841 | 820 | 161.1 |
| B | 12 | 111 | 17425 | 103.06 | 841 | 820 | 161.1 |
| B | 11 | 111 | 14093 | 82.38 | 841 | 820 | 161.1 |
| C | 13 | 61 | 6251 | 28.59 | 814 | 819 | 190.0 |
| C | 8 | 222 | 3491 | 14.06 | 814 | 819 | 190.0 |
| C | 3 | 202 | 2040 | 6.43 | 814 | 819 | 190.0 |
| D | 1 | 52 | 659590 | 3140.86 | 788 | 769 | 209.8 |
| D | 7 | 71 | 494408 | 2353.37 | 788 | 769 | 209.8 |
| D | 2 | 14 | 37332 | 174.31 | 788 | 769 | 209.8 |
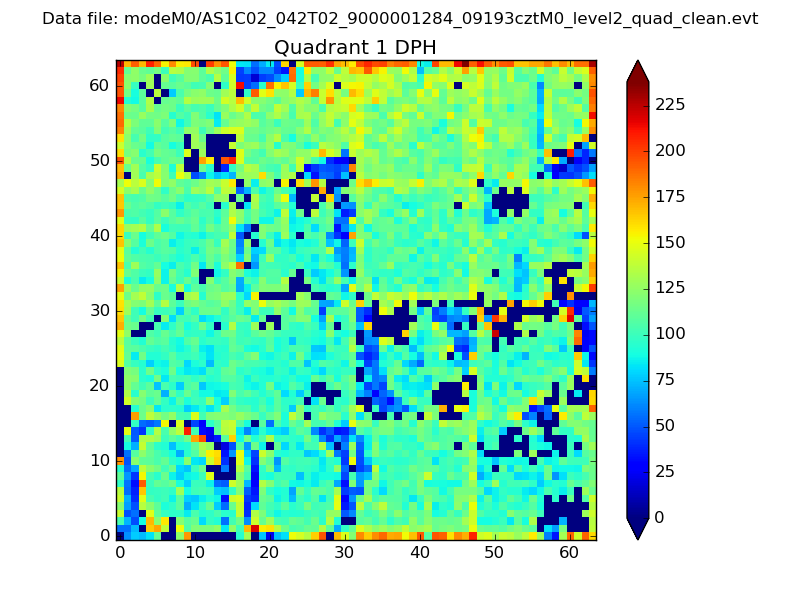
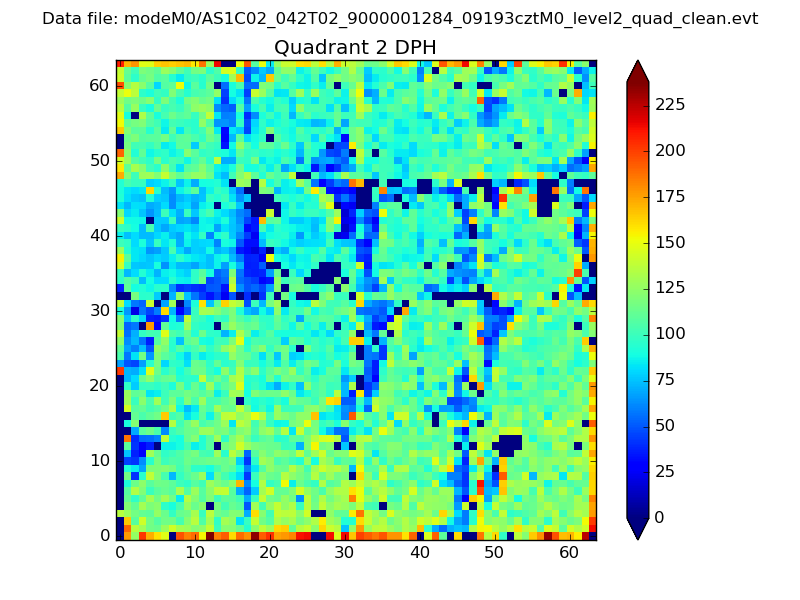
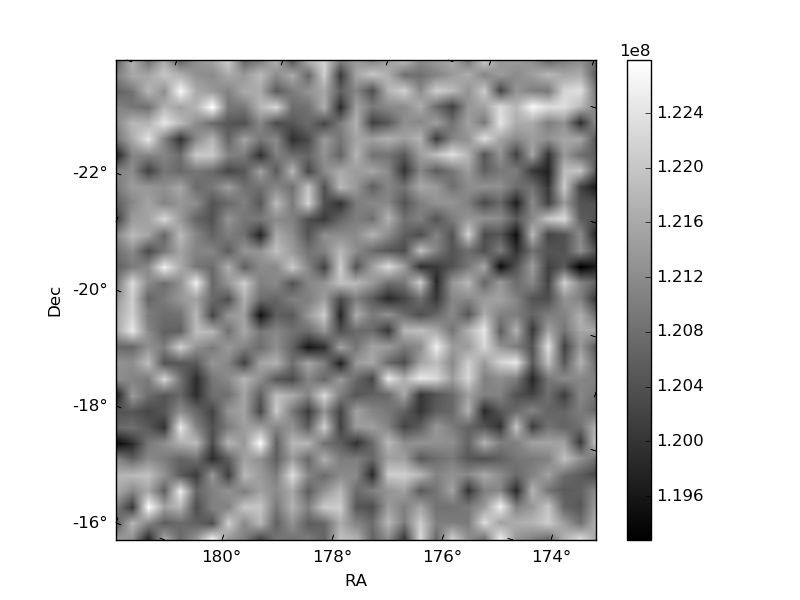
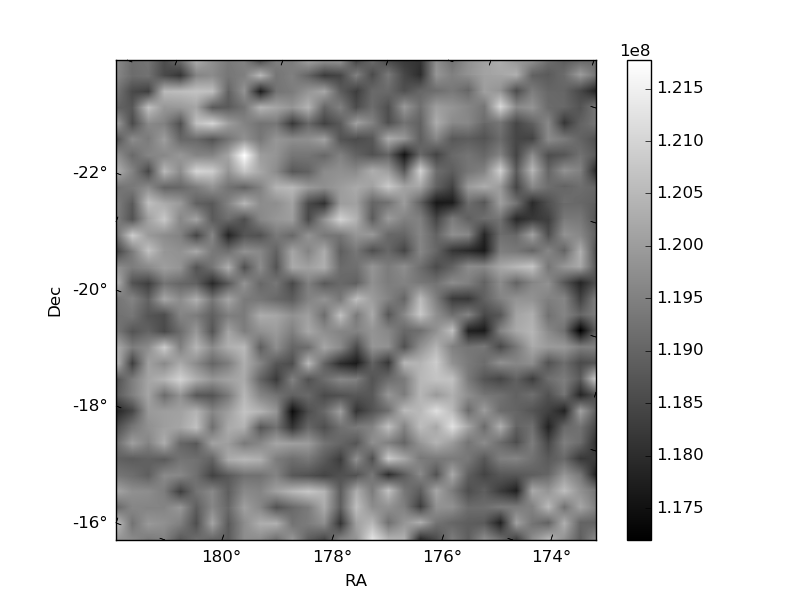
Histogram calculated using DETX and DETY for each event in the final _common_clean file
| Quadrant A |  |
 |
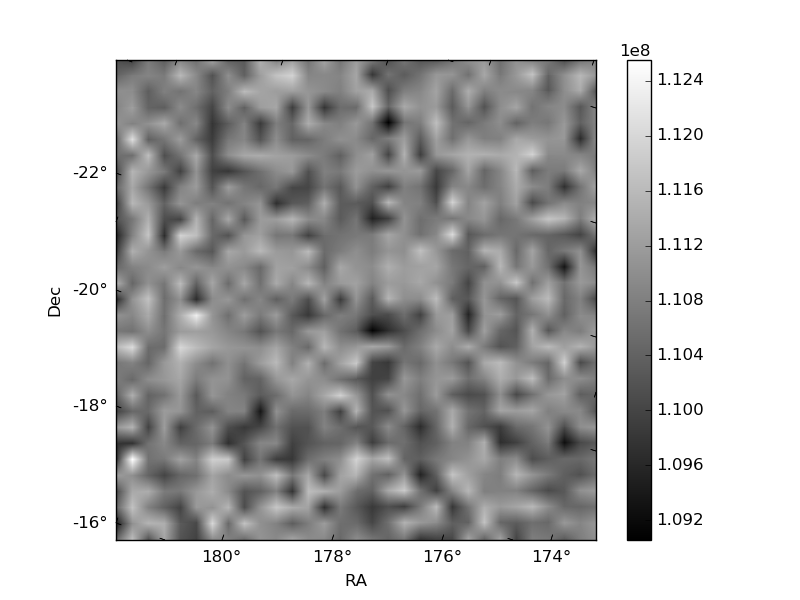
Quadrant B |
|---|---|---|---|
| Quadrant D | 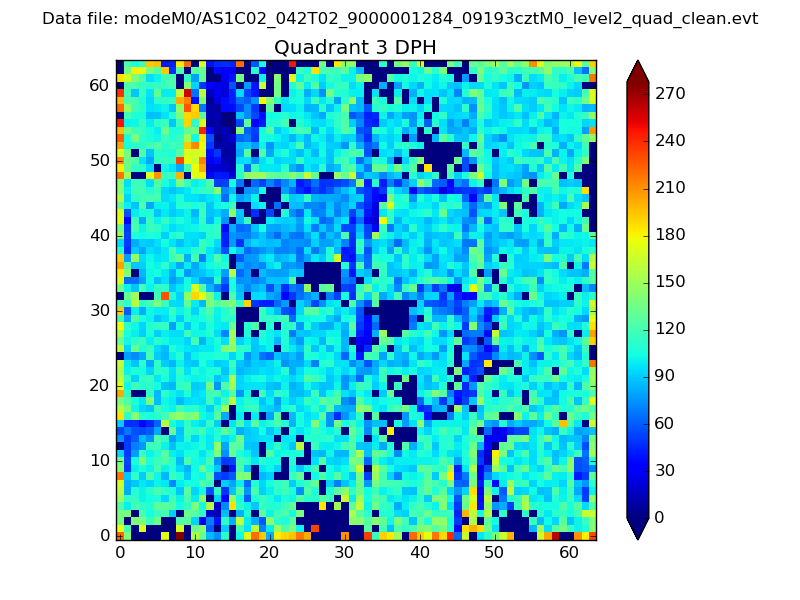 |
 |
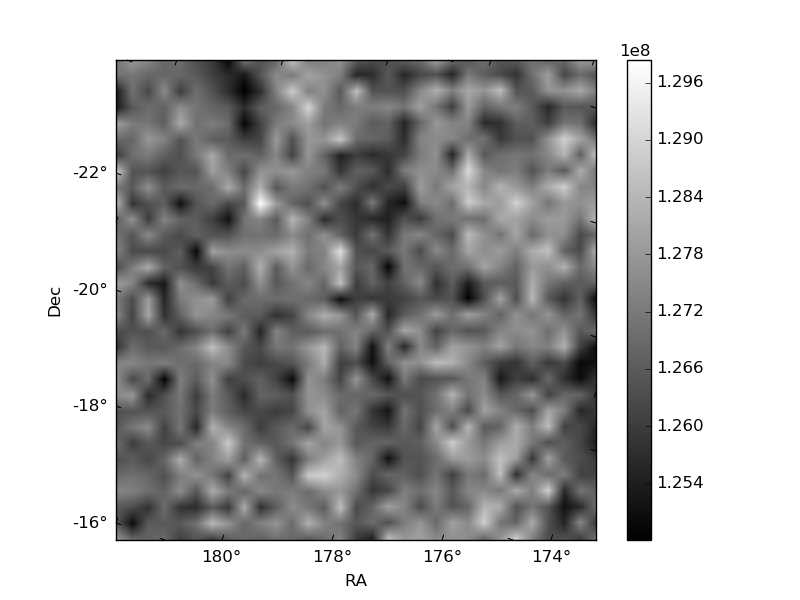
Quadrant C |
| Plot type | Count rate plots | Images |
|---|---|---|
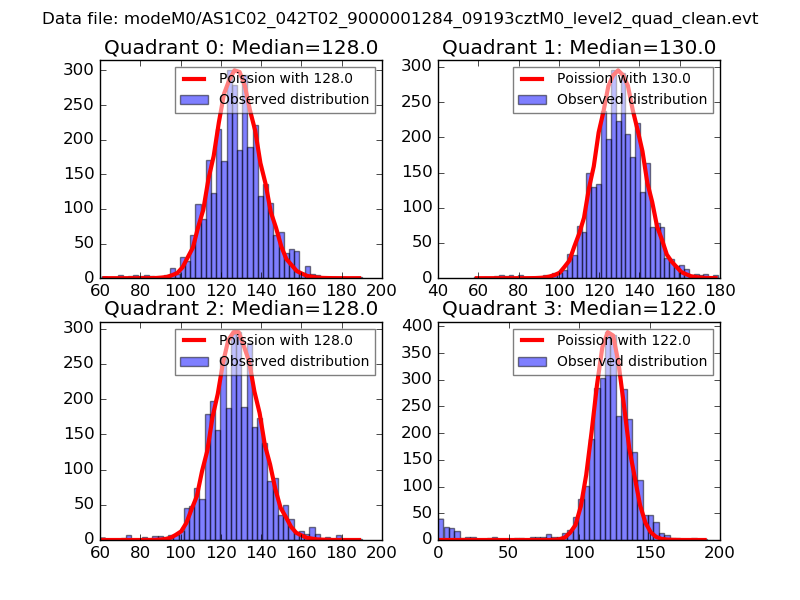
| Comparison with Poisson distribution Blue bars denote a histogram of data divided into 1 sec bins. Red curve is a Poisson curve with rate = median count rate of data. |
 |
 |
| Quadrant-wise count rates Data is divided into 100 sec bins |
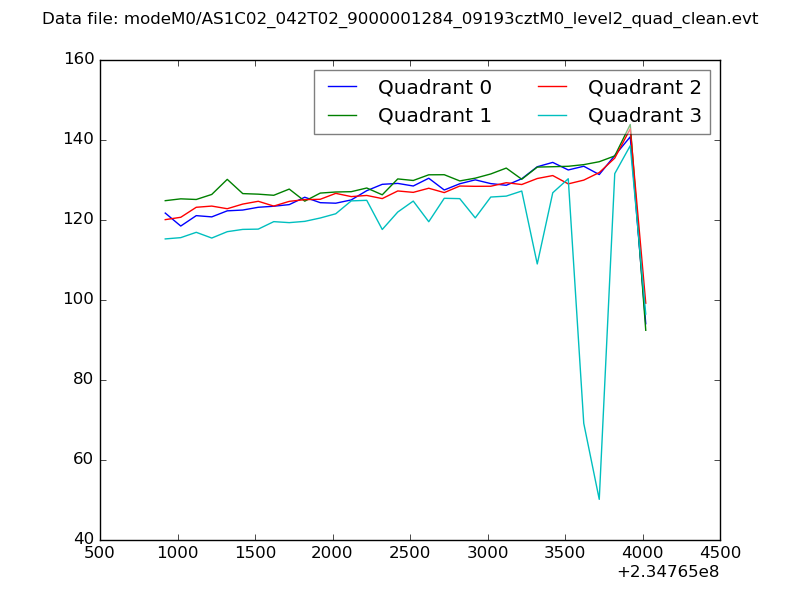 |
|
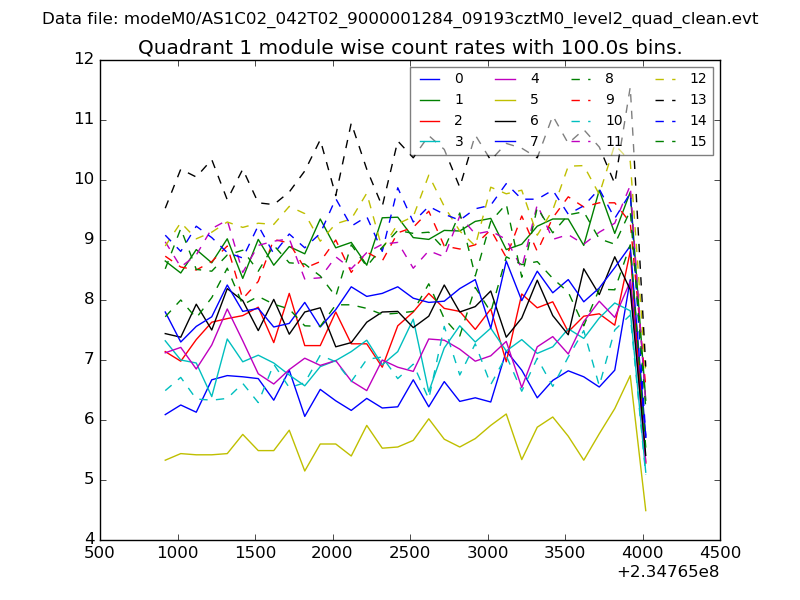
| Module-wise count rates for Quadrant A Data is divided into 100 sec bins |
 |
 |
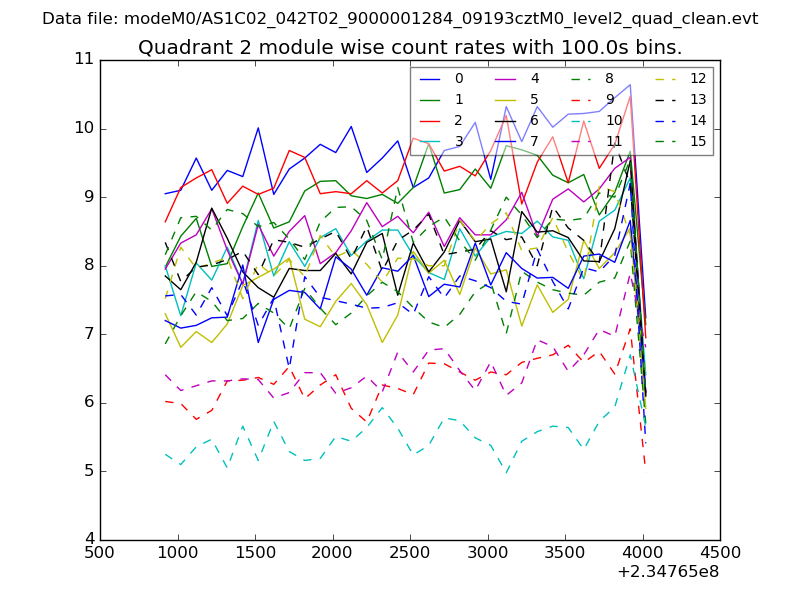
| Module-wise count rates for Quadrant B Data is divided into 100 sec bins |
 |
 |
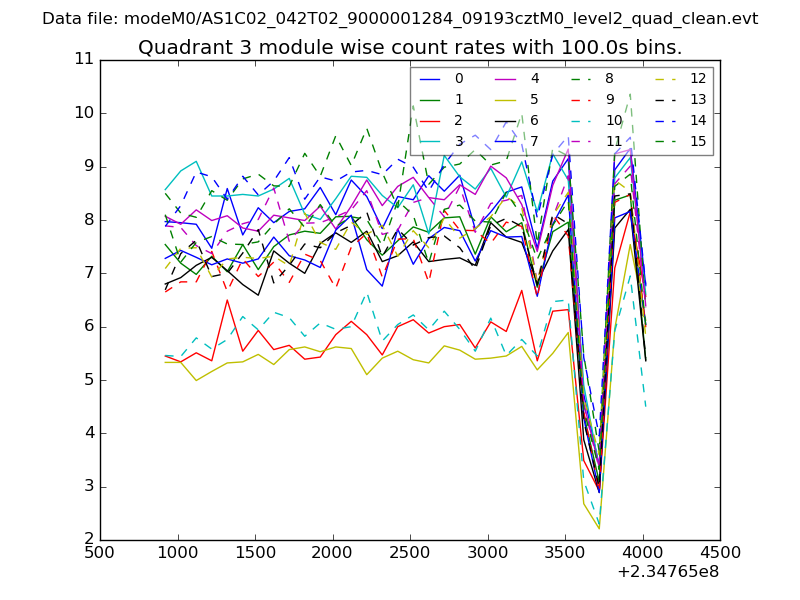
| Module-wise count rates for Quadrant C Data is divided into 100 sec bins |
 |
 |
| Module-wise count rates for Quadrant D Data is divided into 100 sec bins |
 |
 |
| Parameter | Plot |
|---|---|
| CZT HV Monitor | 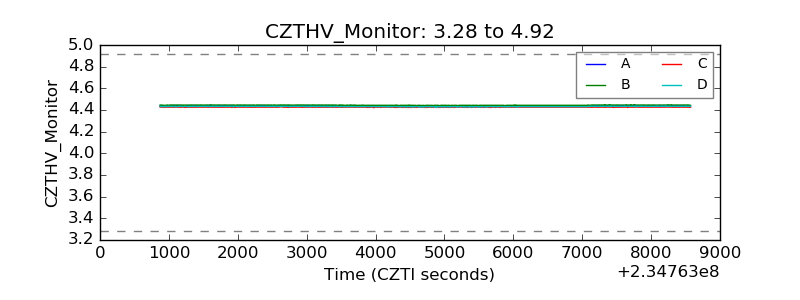 |
| D_VDD | 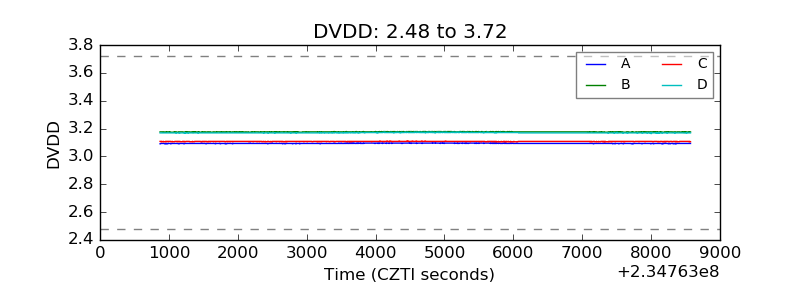 |
| Temperature 1 | 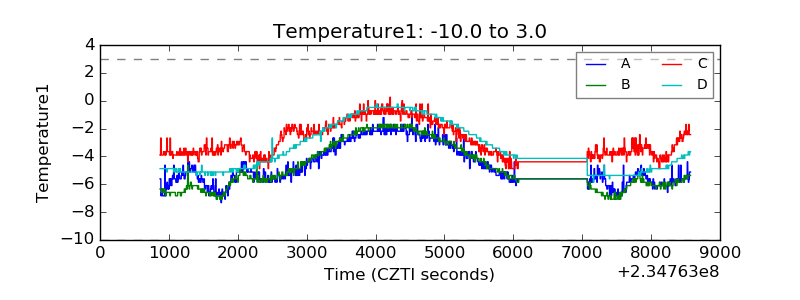 |
| Veto HV Monitor |  |
| Veto LLD | 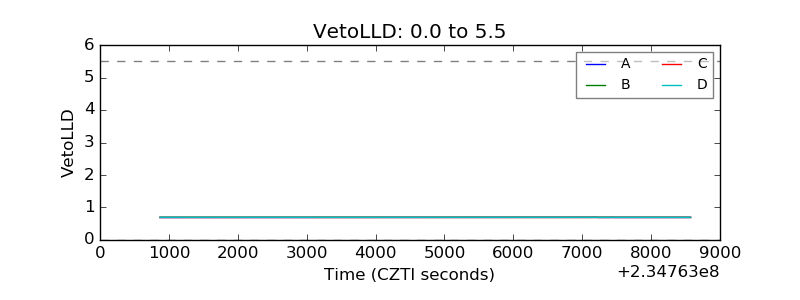 |
| Alpha Counter | 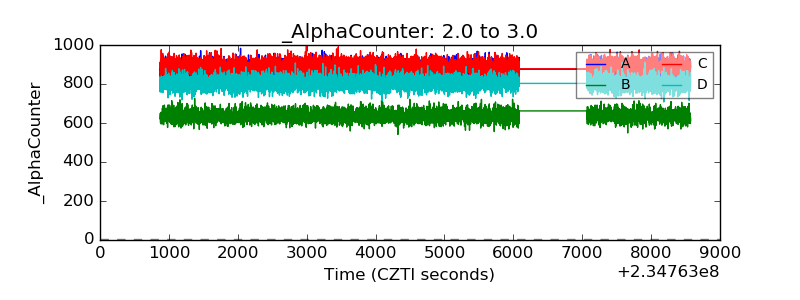 |
| _CPM_Rate | 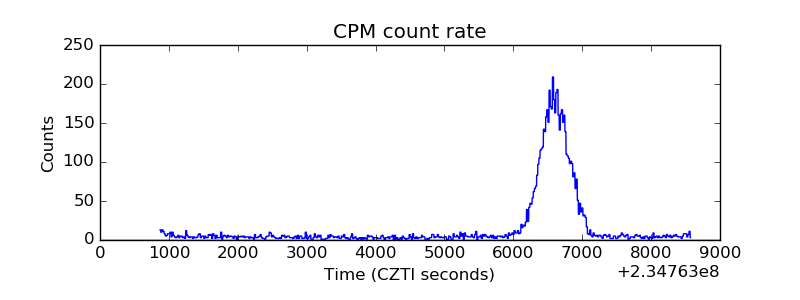 |
| CZT Counter | 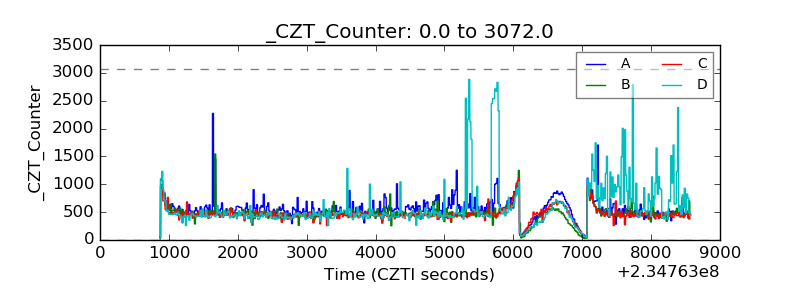 |
| +2.5 Volts monitor |  |
| +5 Volts monitor |  |
| _ROLL_ROT | 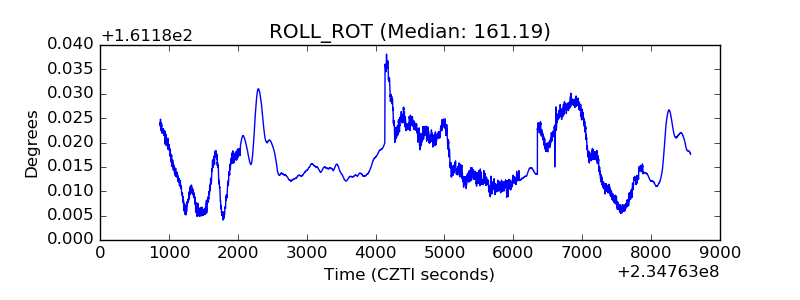 |
| _Roll_DEC | 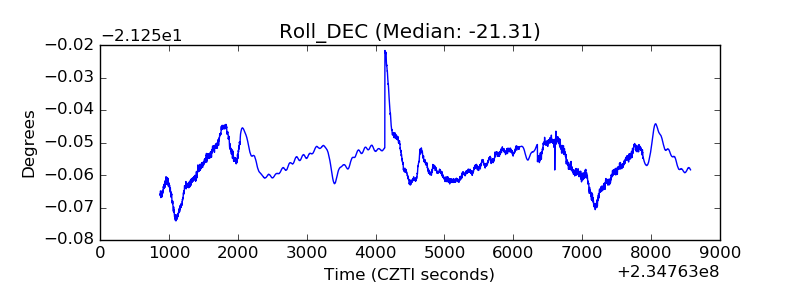 |
| _Roll_RA | 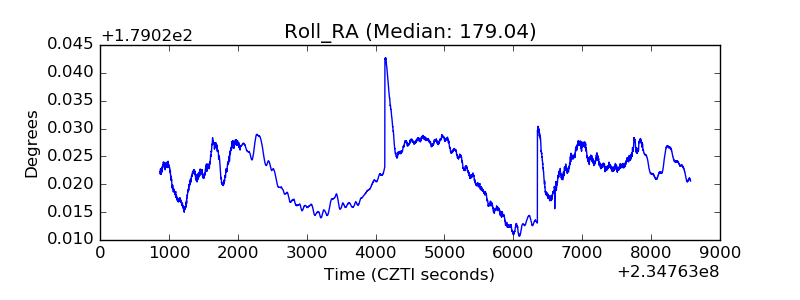 |
| Veto Counter | 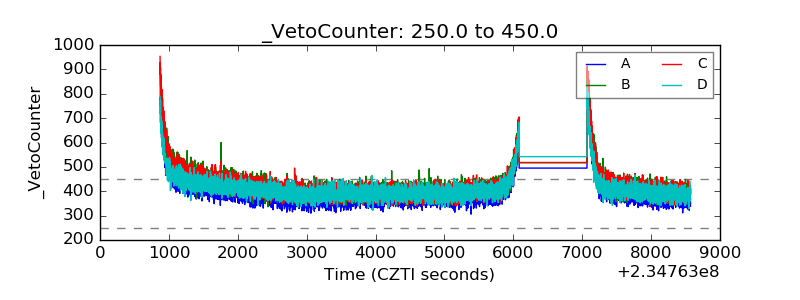 |