| Param | Original file | Final file |
|---|---|---|
| Filename | modeM0/AS1C02_042T02_9000001284_09194cztM0_level2.evt | modeM0/AS1C02_042T02_9000001284_09194cztM0_level2_quad_clean.evt |
| Size (bytes) | 535,334,400 | 76,080,960 |
| Size | 510.5 MB | 72.6 MB |
| Events in quadrant A | 3,945,208 | 454,307 |
| Events in quadrant B | 3,540,439 | 461,446 |
| Events in quadrant C | 3,368,210 | 454,593 |
| Events in quadrant D | 4,871,830 | 433,993 |
| Mode M9 | |||
|---|---|---|---|
| Quadrant | BADHDUFLAG | Total packets | Discarded packets |
| A | 0 | 7 | 0 |
| B | 0 | 7 | 0 |
| C | 0 | 7 | 0 |
| D | 0 | 8 | 0 |
| Mode SS | |||
|---|---|---|---|
| Quadrant | BADHDUFLAG | Total packets | Discarded packets |
| A | 0 | 146 | 0 |
| B | 0 | 146 | 0 |
| C | 0 | 146 | 0 |
| D | 0 | 146 | 0 |
| Mode M0 | |||
|---|---|---|---|
| Quadrant | BADHDUFLAG | Total packets | Discarded packets |
| A | 0 | 15990 | 5 |
| B | 0 | 15043 | 2 |
| C | 0 | 14864 | 4 |
| D | 0 | 19385 | 5 |
| Quadrant | Total seconds | Saturated seconds | Saturation percentage |
|---|---|---|---|
| A | 7169 | 259 | 3.612777% |
| B | 7170 | 246 | 3.430962% |
| C | 7169 | 180 | 2.510810% |
| D | 7169 | 365 | 5.091366% |
Noise dominated data is calculated using 1-second bins in cleaned event files. If a bin has >2000 counts, and if more than 50% of those come from <1% of pixels, then it is considered to be noise-dominated and hence unusable.
| Quadrant | # 1 sec bins | Bins with >0 counts | Bins with >2000 counts | High rate bins dominated by noise | Noise dominated (total time) | Noise dominated (detector-on time) | Marked lightcurve |
|---|---|---|---|---|---|---|---|
| A | 7675 | 7170 | 13 | 13 | 0.17% | 0.18% | 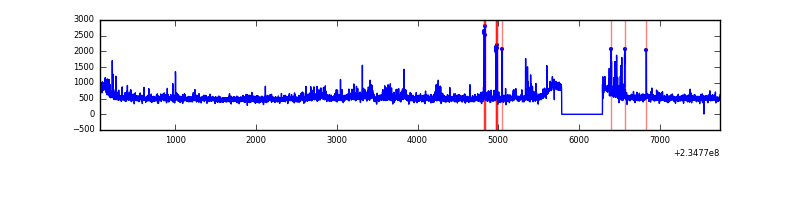 |
| B | 7675 | 7170 | 8 | 8 | 0.10% | 0.11% | 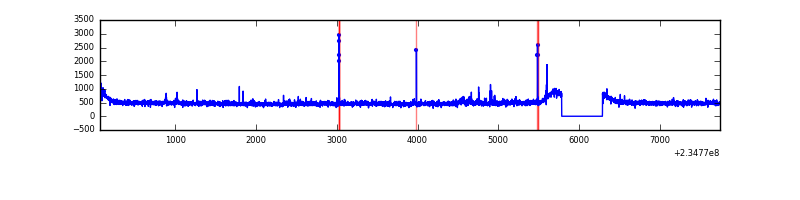 |
| C | 7675 | 7170 | 0 | 0 | 0.00% | 0.00% | 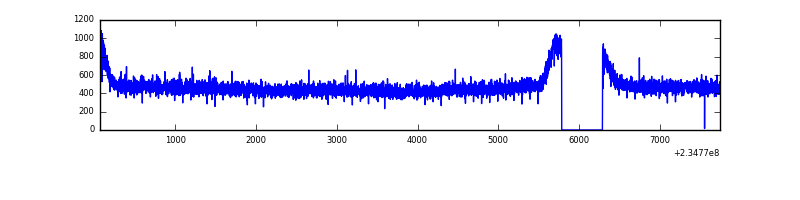 |
| D | 7675 | 7170 | 117 | 117 | 1.52% | 1.63% | 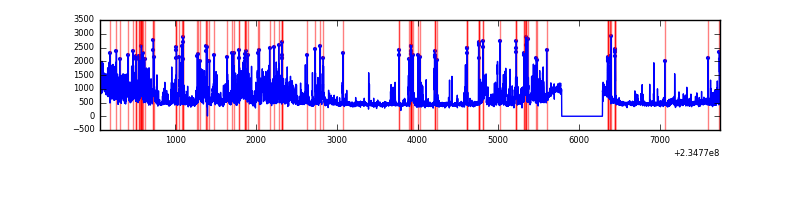 |
Top three noisy pixels from each quadrant. If the there are fewer than three noisy pixels in the level2.evt file, extra rows are filled as -1
| Pixel properties | Quadrant properties | ||||||
|---|---|---|---|---|---|---|---|
| Quadrant | DetID | PixID | Counts | Sigma | Mean | Median | Sigma |
| A | 8 | 5 | 300718 | 1665.28 | 879 | 860 | 180.1 |
| A | 1 | 162 | 126507 | 697.79 | 879 | 860 | 180.1 |
| A | 15 | 223 | 27261 | 146.62 | 879 | 860 | 180.1 |
| B | 12 | 111 | 18564 | 103.05 | 886 | 864 | 171.8 |
| B | 10 | 252 | 18457 | 102.42 | 886 | 864 | 171.8 |
| B | 8 | 234 | 17628 | 97.6 | 886 | 864 | 171.8 |
| C | 13 | 61 | 6513 | 27.95 | 861 | 864 | 202.1 |
| C | 8 | 128 | 5017 | 20.55 | 861 | 864 | 202.1 |
| C | 8 | 222 | 4839 | 19.67 | 861 | 864 | 202.1 |
| D | 1 | 52 | 1340291 | 5902.64 | 845 | 824 | 226.9 |
| D | 9 | 64 | 95523 | 417.31 | 845 | 824 | 226.9 |
| D | 7 | 71 | 80121 | 349.44 | 845 | 824 | 226.9 |
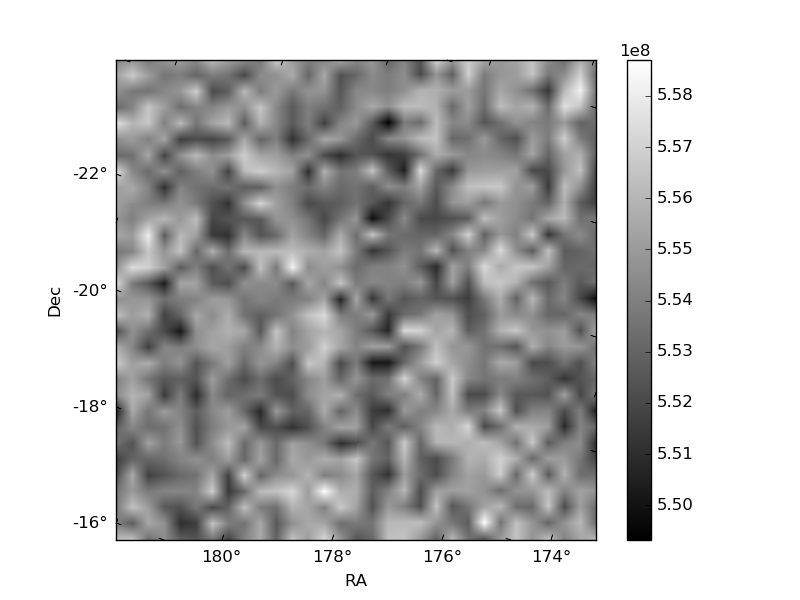
Histogram calculated using DETX and DETY for each event in the final _common_clean file
| Quadrant A | 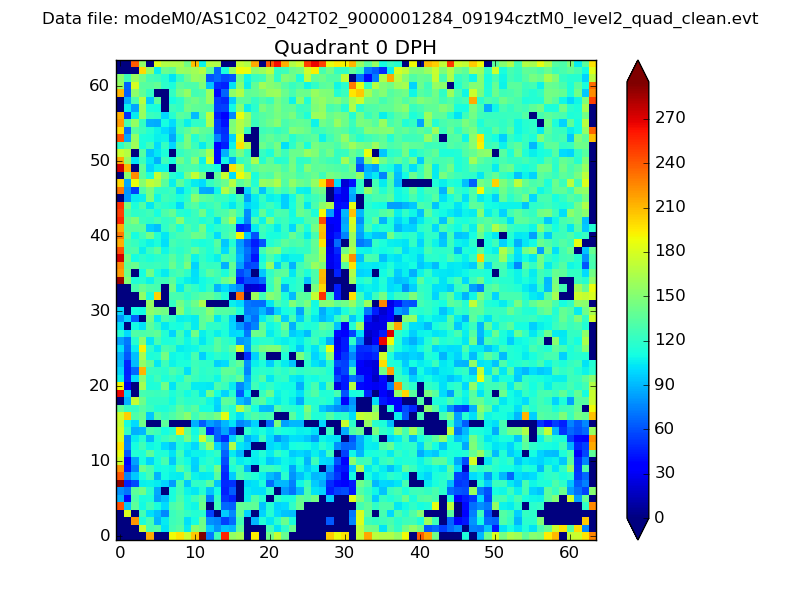 |
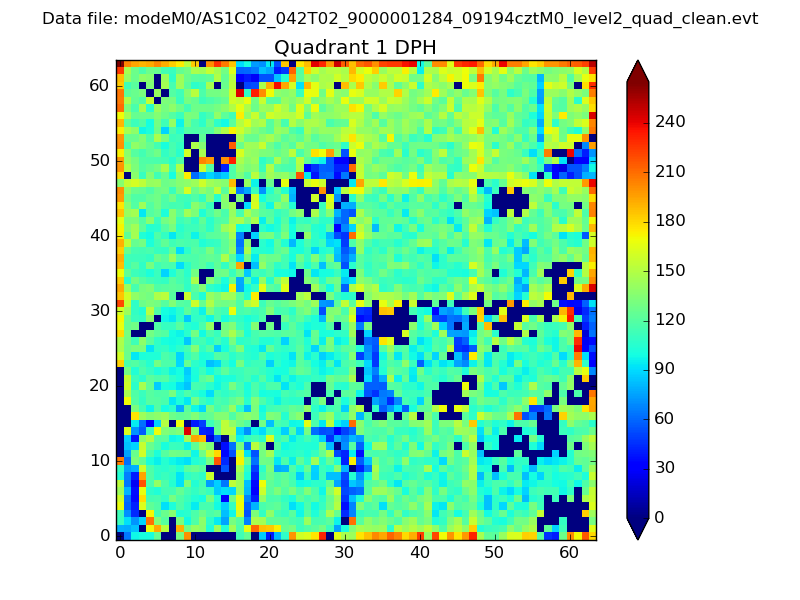 |
Quadrant B |
|---|---|---|---|
| Quadrant D | 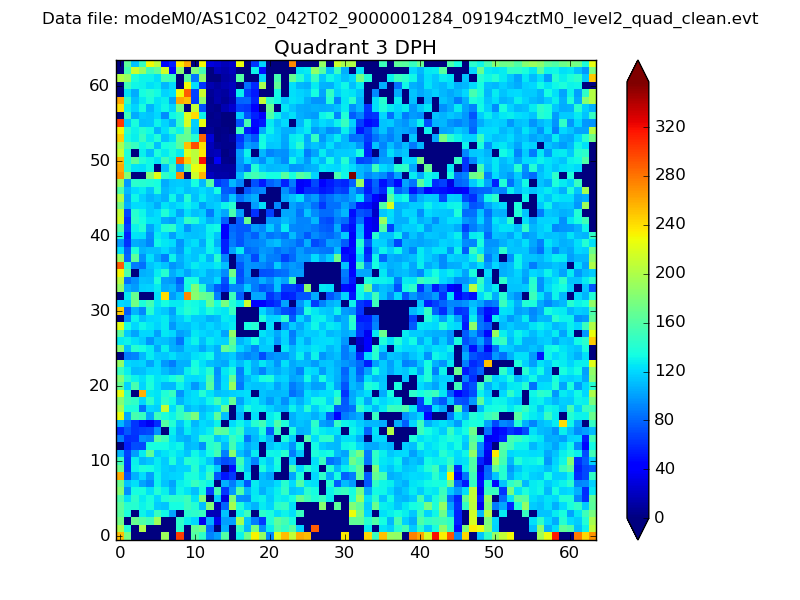 |
 |
Quadrant C |
| Plot type | Count rate plots | Images |
|---|---|---|
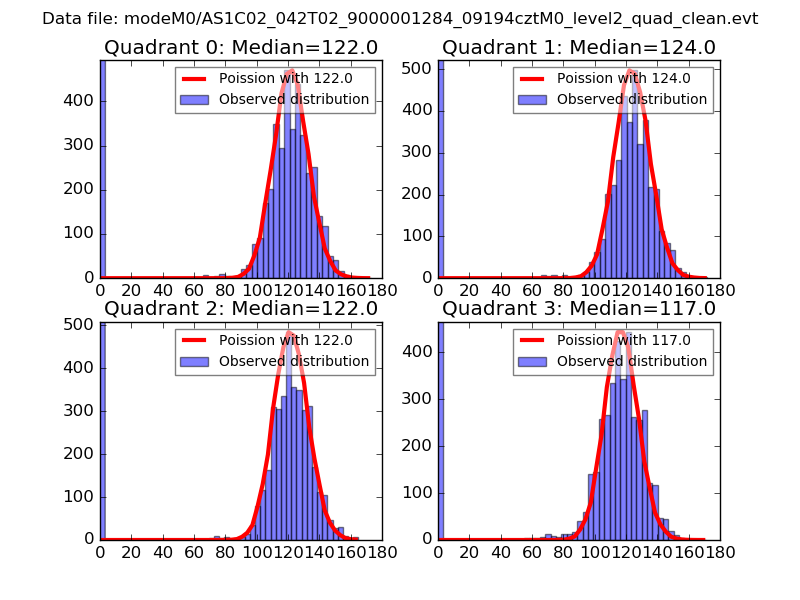
| Comparison with Poisson distribution Blue bars denote a histogram of data divided into 1 sec bins. Red curve is a Poisson curve with rate = median count rate of data. |
 |
 |
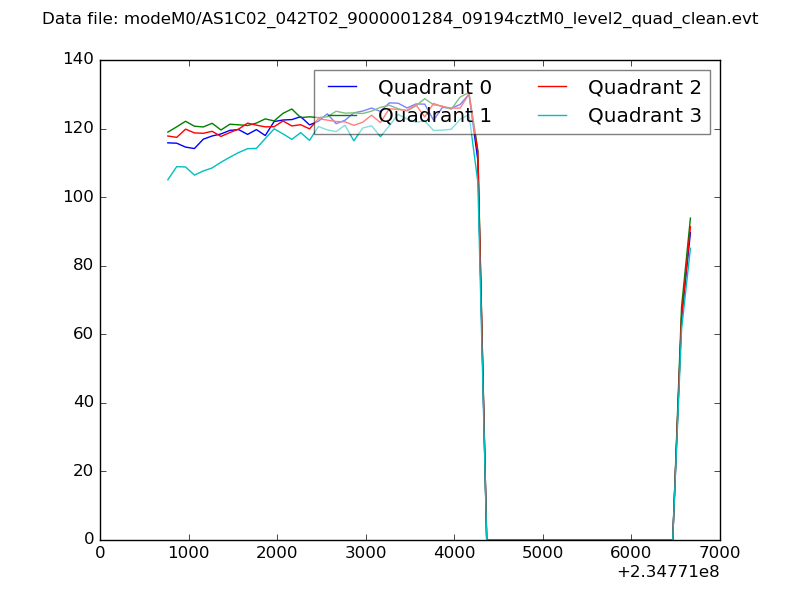
| Quadrant-wise count rates Data is divided into 100 sec bins |
 |
|
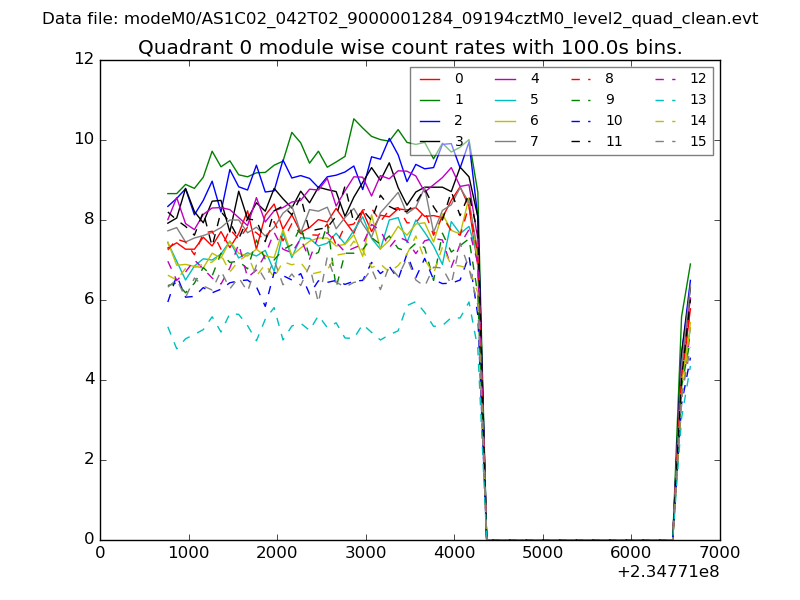
| Module-wise count rates for Quadrant A Data is divided into 100 sec bins |
 |
 |
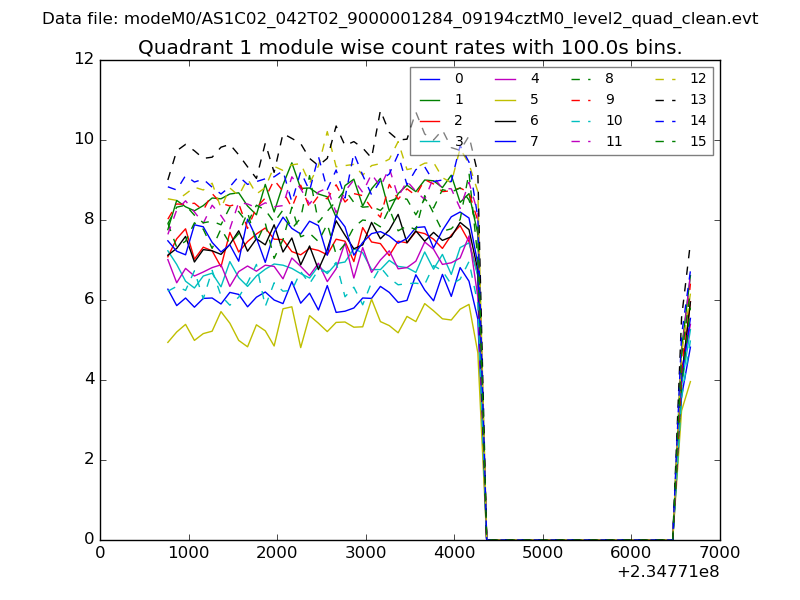
| Module-wise count rates for Quadrant B Data is divided into 100 sec bins |
 |
 |
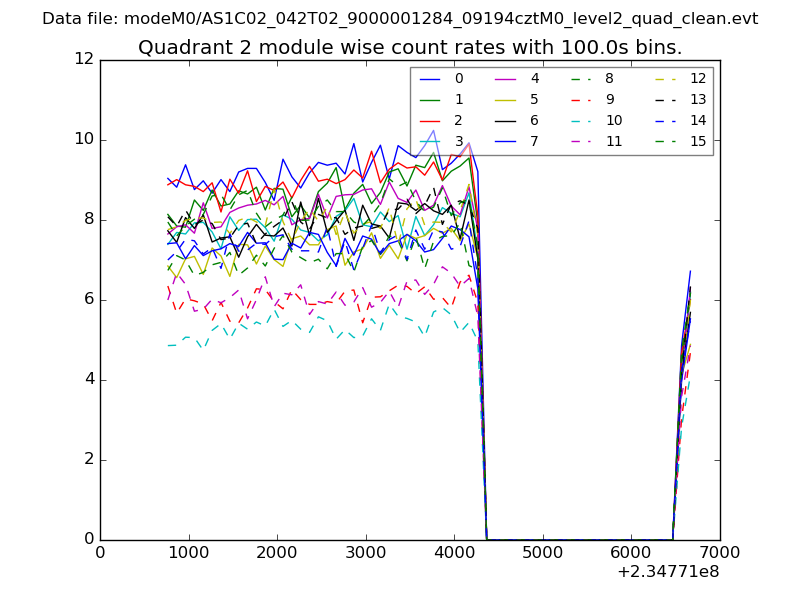
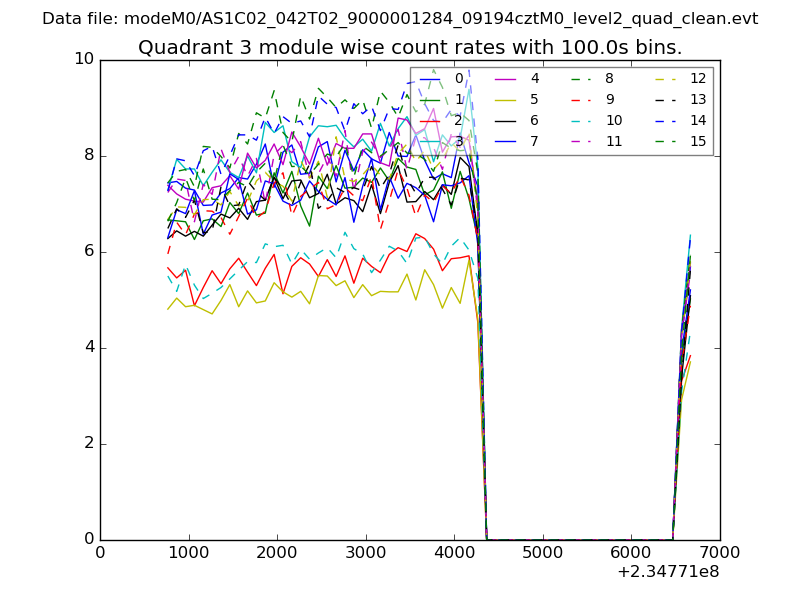
| Module-wise count rates for Quadrant C Data is divided into 100 sec bins |
 |
 |
| Module-wise count rates for Quadrant D Data is divided into 100 sec bins |
 |
 |
| Parameter | Plot |
|---|---|
| CZT HV Monitor | 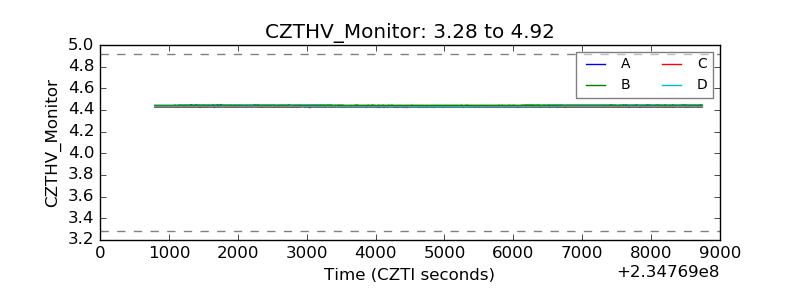 |
| D_VDD |  |
| Temperature 1 | 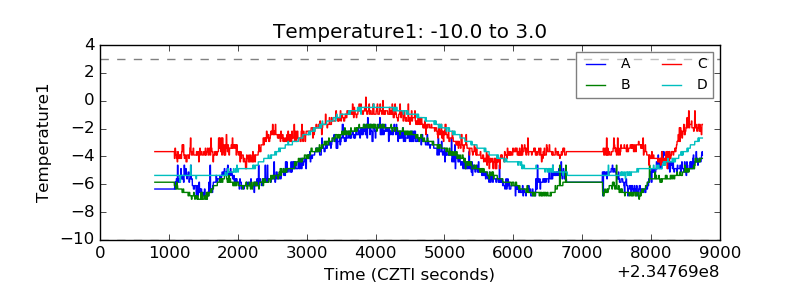 |
| Veto HV Monitor | 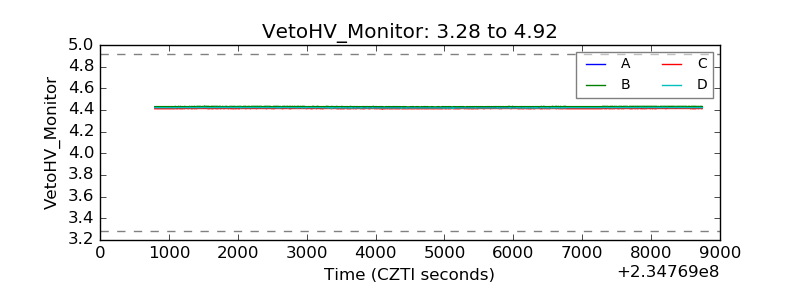 |
| Veto LLD | 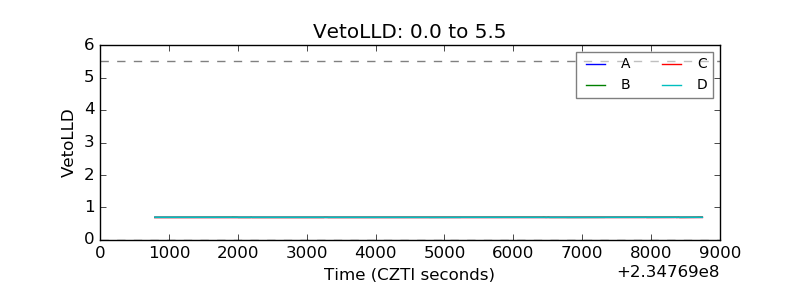 |
| Alpha Counter | 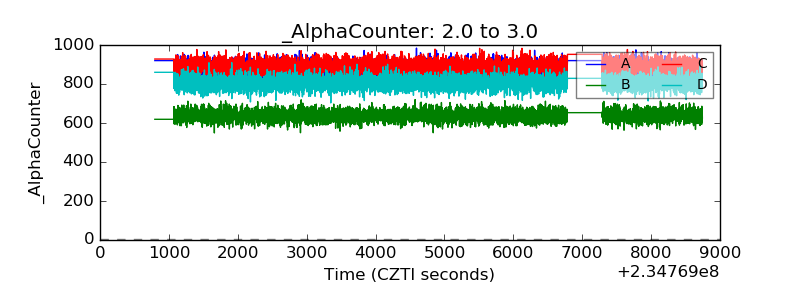 |
| _CPM_Rate | 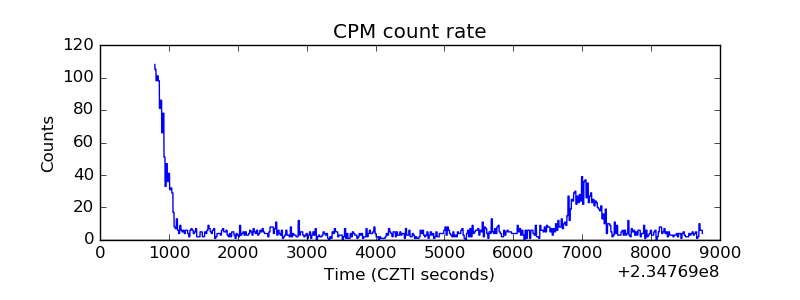 |
| CZT Counter |  |
| +2.5 Volts monitor |  |
| +5 Volts monitor |  |
| _ROLL_ROT | 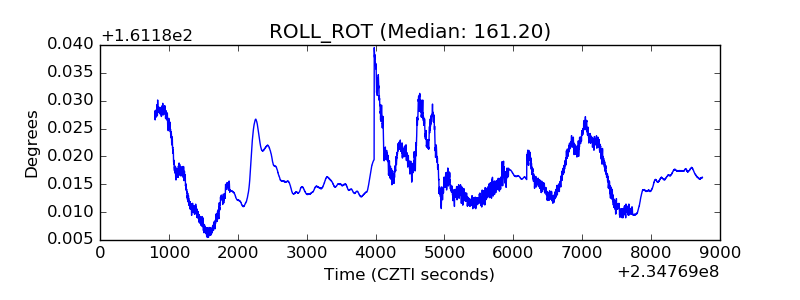 |
| _Roll_DEC | 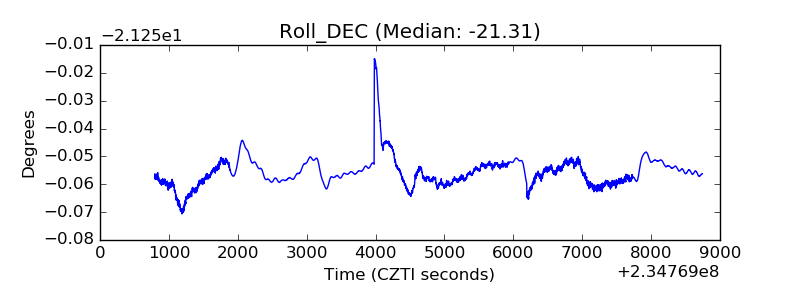 |
| _Roll_RA | 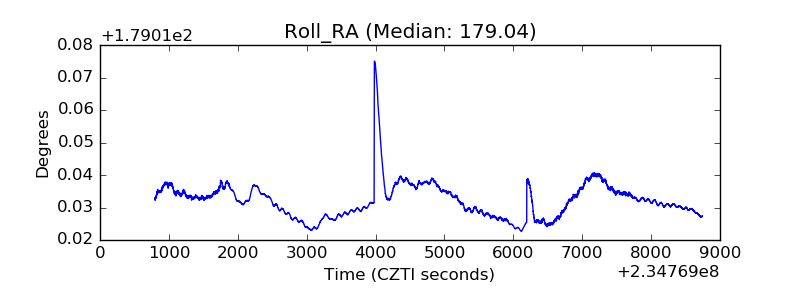 |
| Veto Counter | 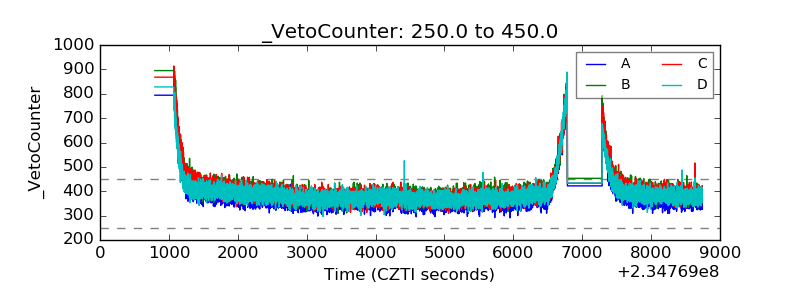 |