| Param | Original file | Final file |
|---|---|---|
| Filename | modeM0/AS1C02_042T02_9000001284_09195cztM0_level2.evt | modeM0/AS1C02_042T02_9000001284_09195cztM0_level2_quad_clean.evt |
| Size (bytes) | 588,562,560 | 84,654,720 |
| Size | 561.3 MB | 80.7 MB |
| Events in quadrant A | 4,818,840 | 501,951 |
| Events in quadrant B | 3,971,593 | 514,410 |
| Events in quadrant C | 3,801,146 | 503,289 |
| Events in quadrant D | 4,692,199 | 490,012 |
| Mode M9 | |||
|---|---|---|---|
| Quadrant | BADHDUFLAG | Total packets | Discarded packets |
| A | 0 | 5 | 0 |
| B | 0 | 5 | 0 |
| C | 0 | 5 | 0 |
| D | 0 | 5 | 0 |
| Mode SS | |||
|---|---|---|---|
| Quadrant | BADHDUFLAG | Total packets | Discarded packets |
| A | 0 | 162 | 0 |
| B | 0 | 162 | 0 |
| C | 0 | 162 | 0 |
| D | 0 | 162 | 0 |
| Mode M0 | |||
|---|---|---|---|
| Quadrant | BADHDUFLAG | Total packets | Discarded packets |
| A | 0 | 19295 | 3 |
| B | 0 | 16954 | 2 |
| C | 0 | 16753 | 2 |
| D | 0 | 19366 | 2 |
| Quadrant | Total seconds | Saturated seconds | Saturation percentage |
|---|---|---|---|
| A | 7964 | 565 | 7.094425% |
| B | 7964 | 486 | 6.102461% |
| C | 7964 | 350 | 4.394776% |
| D | 7964 | 520 | 6.529382% |
Noise dominated data is calculated using 1-second bins in cleaned event files. If a bin has >2000 counts, and if more than 50% of those come from <1% of pixels, then it is considered to be noise-dominated and hence unusable.
| Quadrant | # 1 sec bins | Bins with >0 counts | Bins with >2000 counts | High rate bins dominated by noise | Noise dominated (total time) | Noise dominated (detector-on time) | Marked lightcurve |
|---|---|---|---|---|---|---|---|
| A | 8489 | 7964 | 34 | 34 | 0.40% | 0.43% | 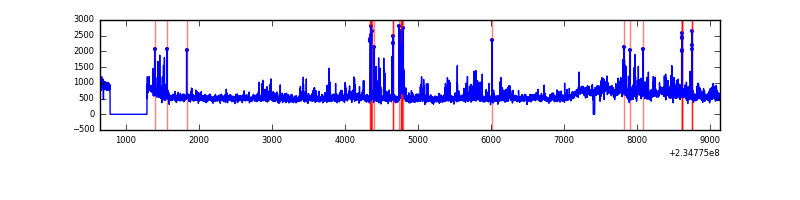 |
| B | 8489 | 7964 | 5 | 5 | 0.06% | 0.06% | 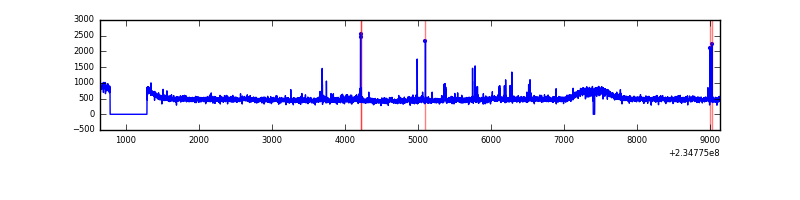 |
| C | 8489 | 7964 | 0 | 0 | 0.00% | 0.00% | 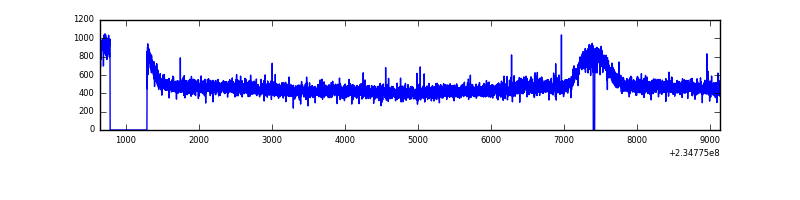 |
| D | 8489 | 7964 | 102 | 102 | 1.20% | 1.28% |  |
Top three noisy pixels from each quadrant. If the there are fewer than three noisy pixels in the level2.evt file, extra rows are filled as -1
| Pixel properties | Quadrant properties | ||||||
|---|---|---|---|---|---|---|---|
| Quadrant | DetID | PixID | Counts | Sigma | Mean | Median | Sigma |
| A | 8 | 5 | 672635 | 3306.22 | 985 | 961 | 203.2 |
| A | 1 | 162 | 147315 | 720.4 | 985 | 961 | 203.2 |
| A | 15 | 223 | 89831 | 437.45 | 985 | 961 | 203.2 |
| B | 10 | 252 | 22270 | 110.82 | 994 | 968 | 192.2 |
| B | 0 | 213 | 21822 | 108.49 | 994 | 968 | 192.2 |
| B | 12 | 111 | 21175 | 105.12 | 994 | 968 | 192.2 |
| C | 8 | 128 | 12512 | 50.67 | 968 | 972 | 227.7 |
| C | 13 | 61 | 7420 | 28.31 | 968 | 972 | 227.7 |
| C | 8 | 112 | 7328 | 27.91 | 968 | 972 | 227.7 |
| D | 1 | 52 | 798404 | 3171.06 | 959 | 934 | 251.5 |
| D | 13 | 112 | 57092 | 223.31 | 959 | 934 | 251.5 |
| D | 4 | 95 | 51528 | 201.18 | 959 | 934 | 251.5 |
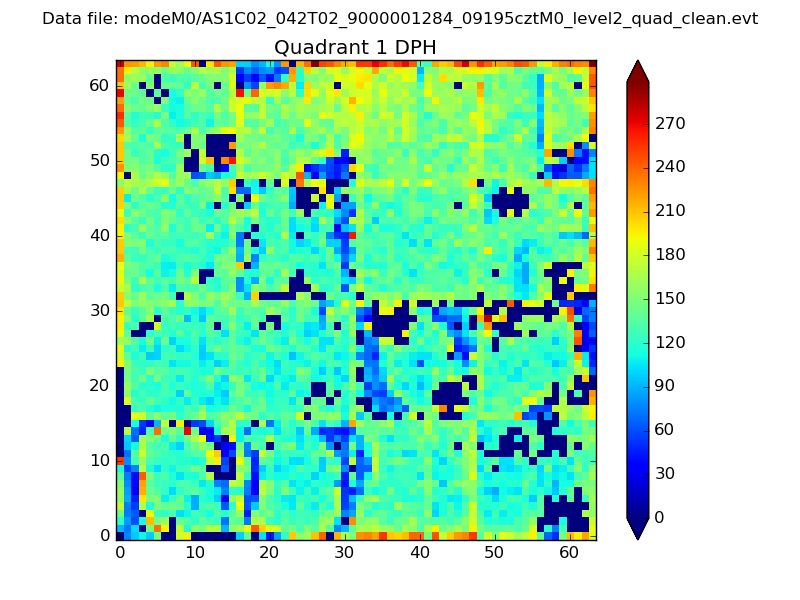
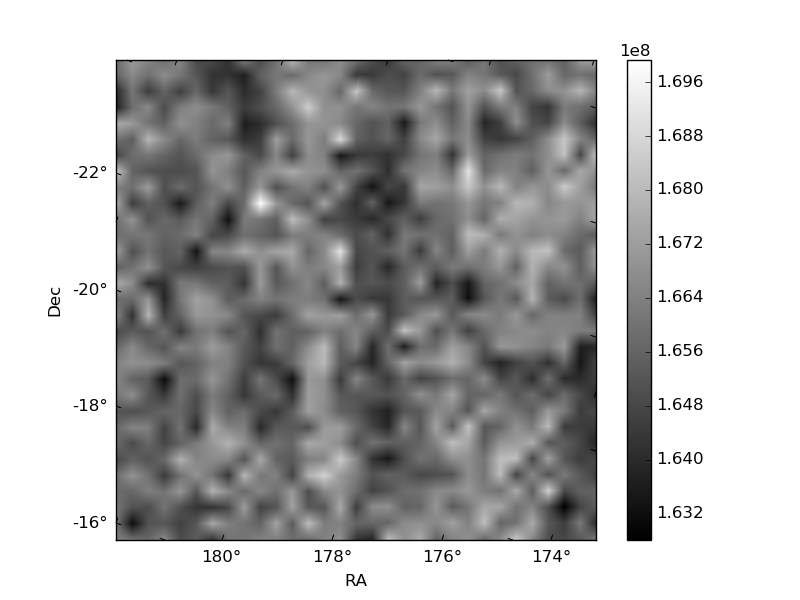
Histogram calculated using DETX and DETY for each event in the final _common_clean file
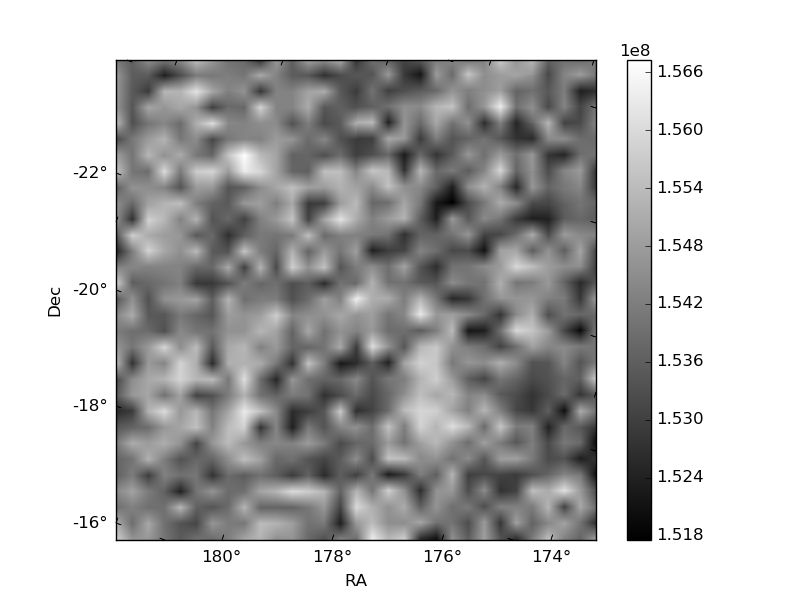
| Quadrant A |  |
 |
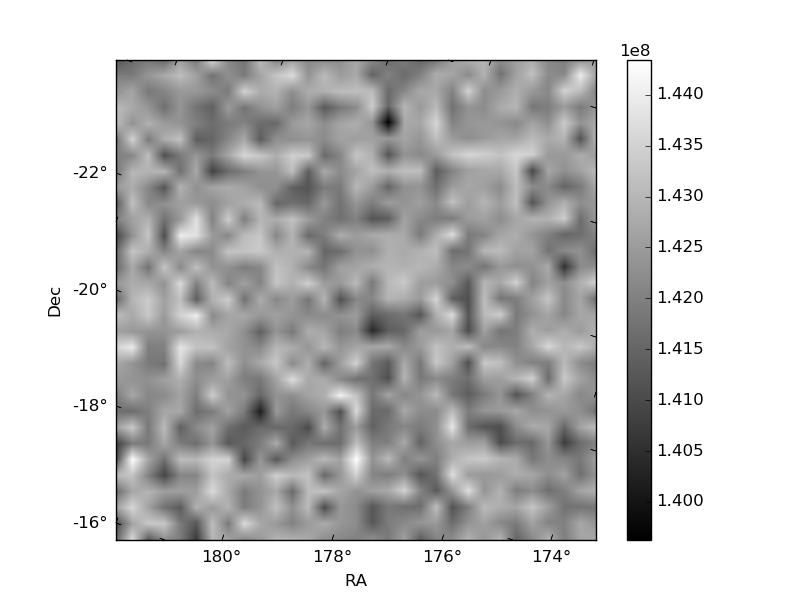
Quadrant B |
|---|---|---|---|
| Quadrant D | 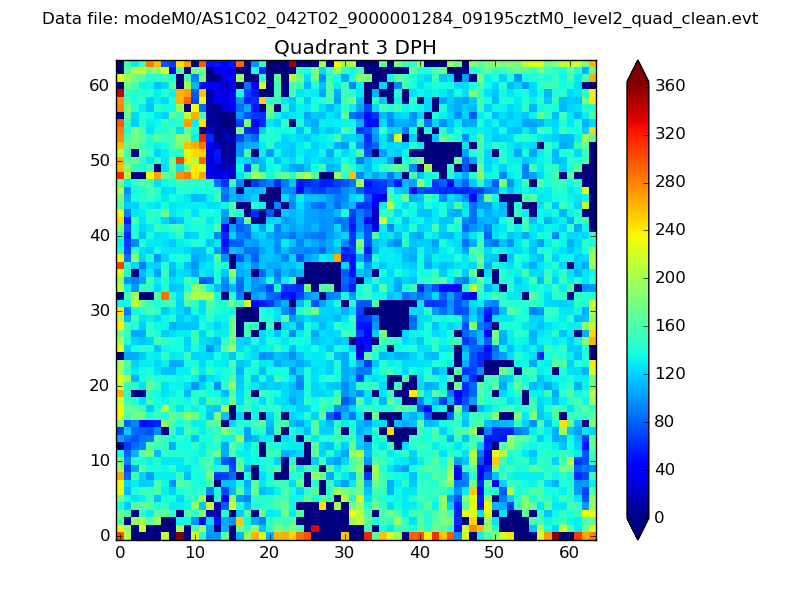 |
 |
Quadrant C |
| Plot type | Count rate plots | Images |
|---|---|---|
| Comparison with Poisson distribution Blue bars denote a histogram of data divided into 1 sec bins. Red curve is a Poisson curve with rate = median count rate of data. |
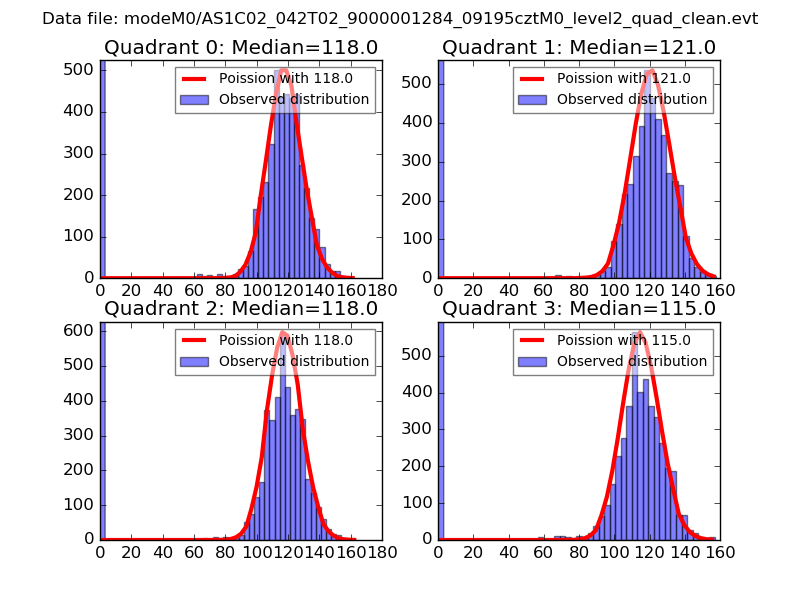 |
 |
| Quadrant-wise count rates Data is divided into 100 sec bins |
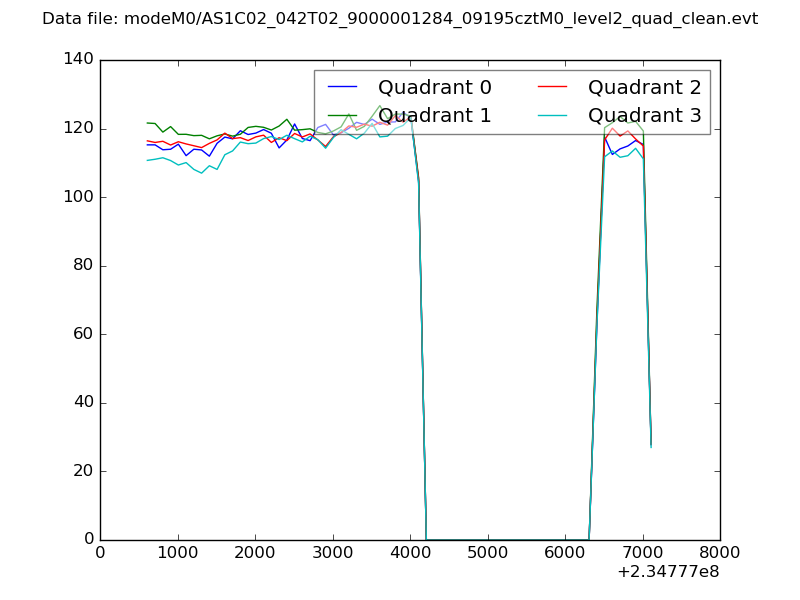 |
|
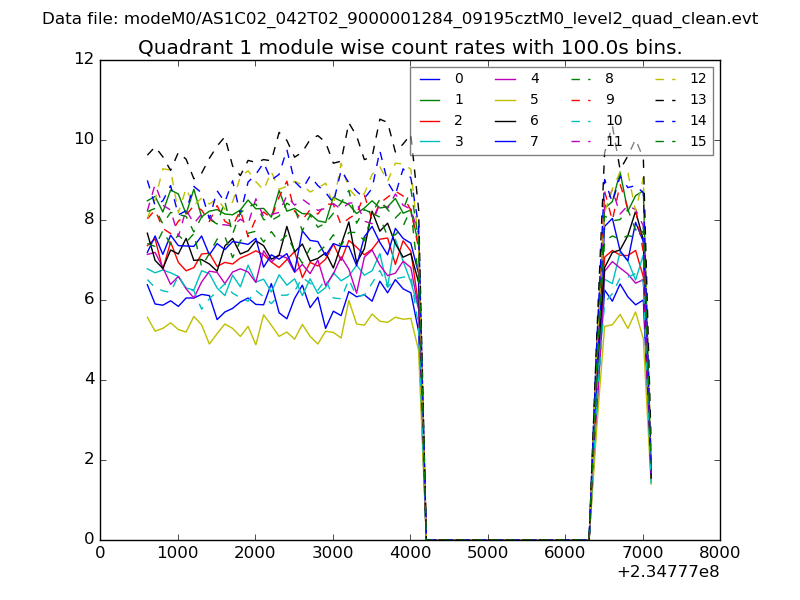
| Module-wise count rates for Quadrant A Data is divided into 100 sec bins |
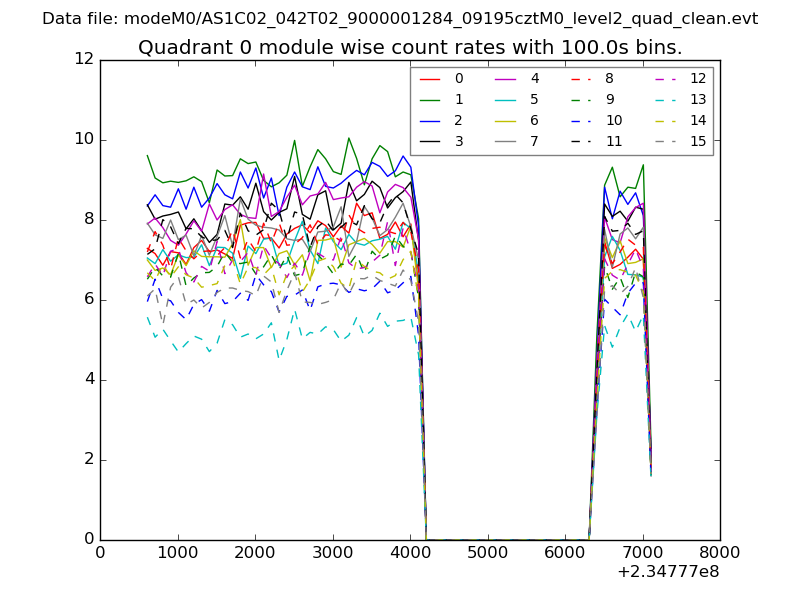 |
 |
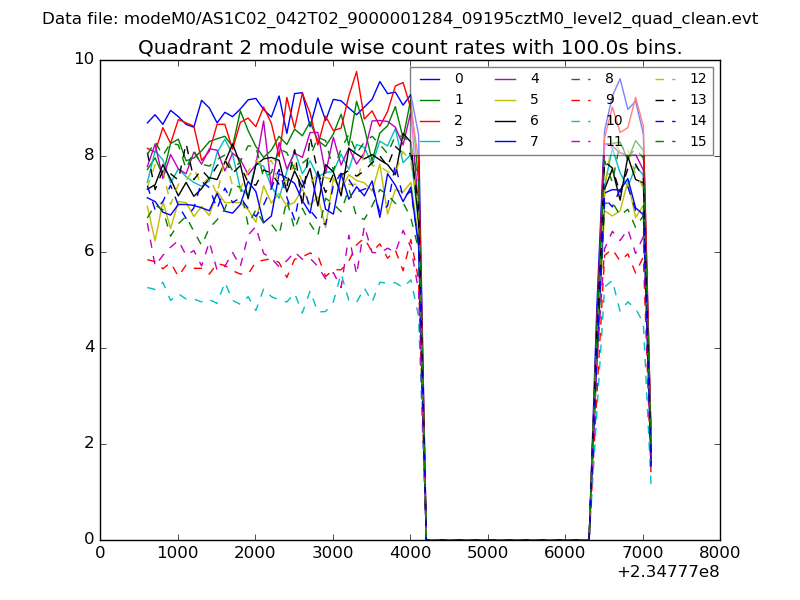
| Module-wise count rates for Quadrant B Data is divided into 100 sec bins |
 |
 |
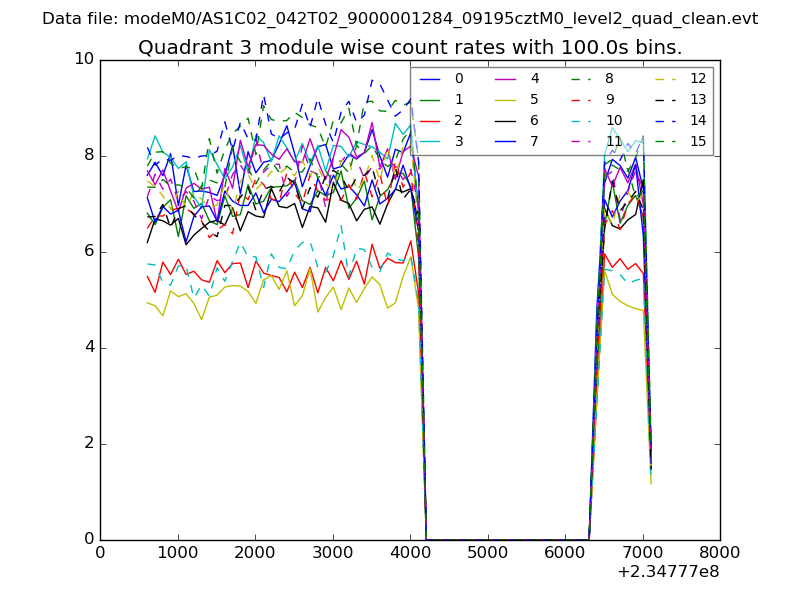
| Module-wise count rates for Quadrant C Data is divided into 100 sec bins |
 |
 |
| Module-wise count rates for Quadrant D Data is divided into 100 sec bins |
 |
 |
| Parameter | Plot |
|---|---|
| CZT HV Monitor | 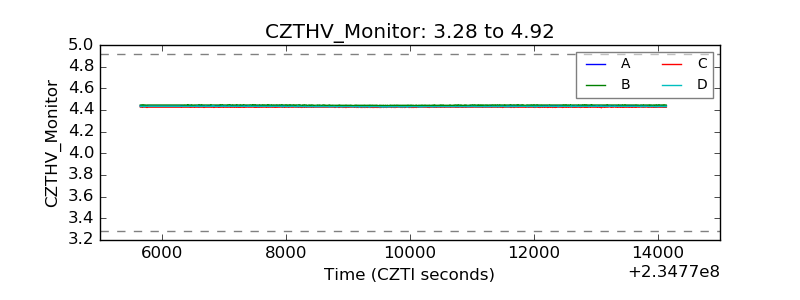 |
| D_VDD | 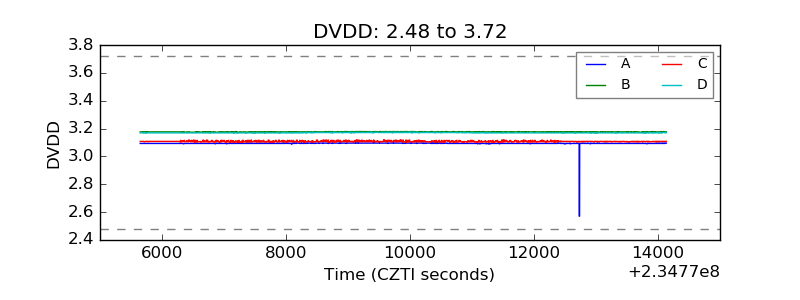 |
| Temperature 1 | 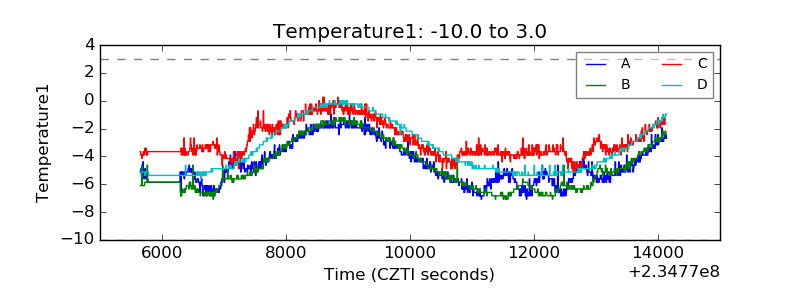 |
| Veto HV Monitor | 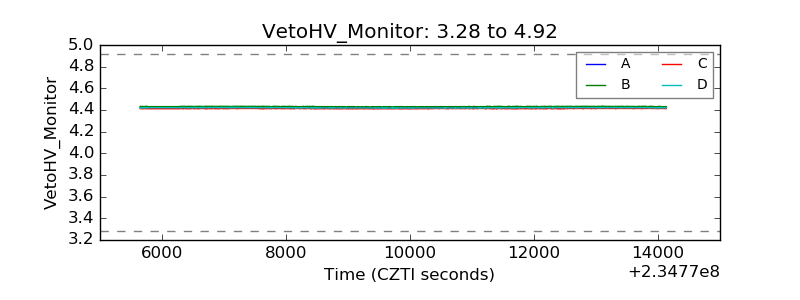 |
| Veto LLD | 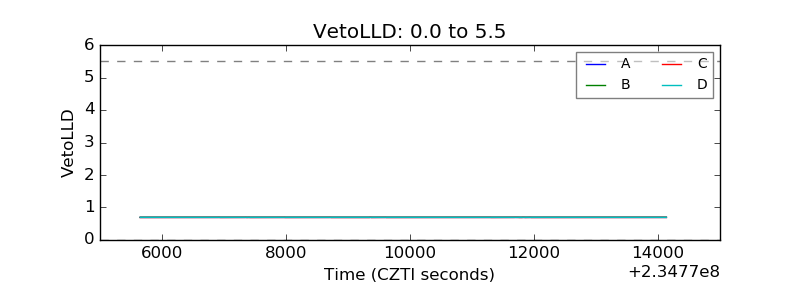 |
| Alpha Counter | 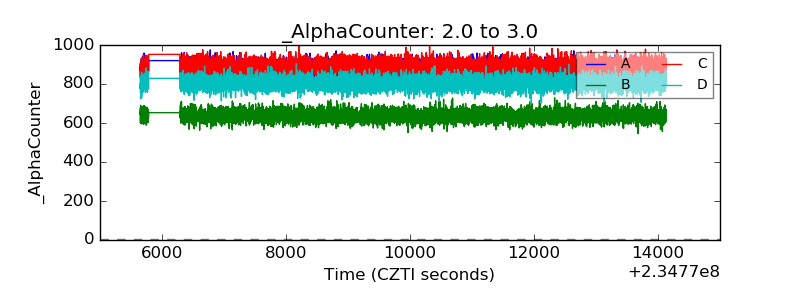 |
| _CPM_Rate | 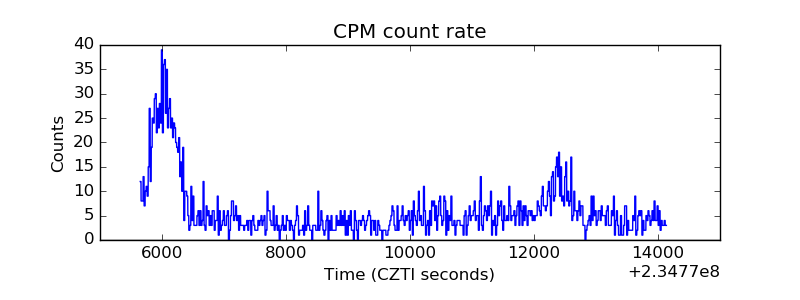 |
| CZT Counter |  |
| +2.5 Volts monitor |  |
| +5 Volts monitor |  |
| _ROLL_ROT | 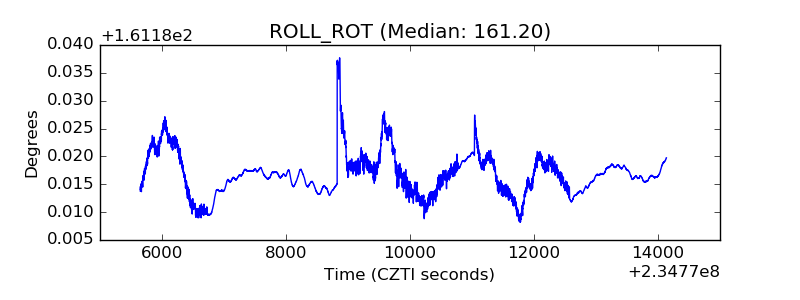 |
| _Roll_DEC | 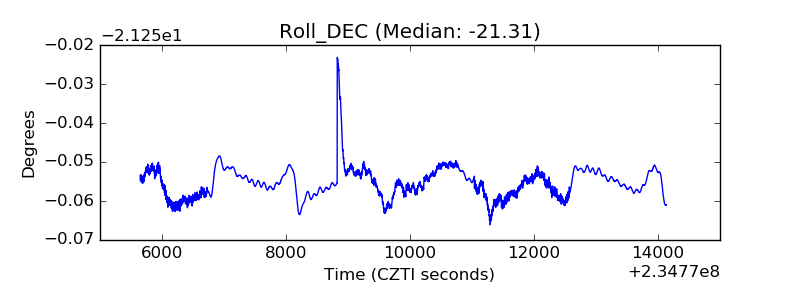 |
| _Roll_RA | 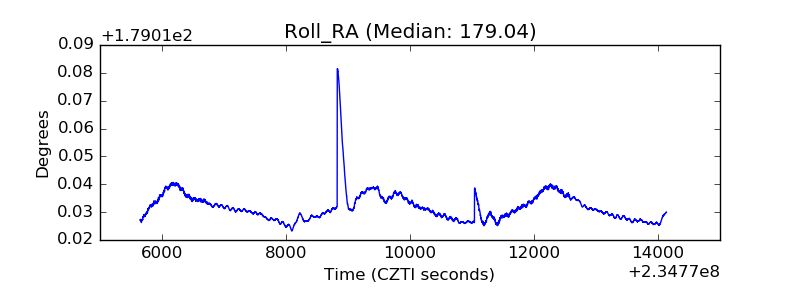 |
| Veto Counter | 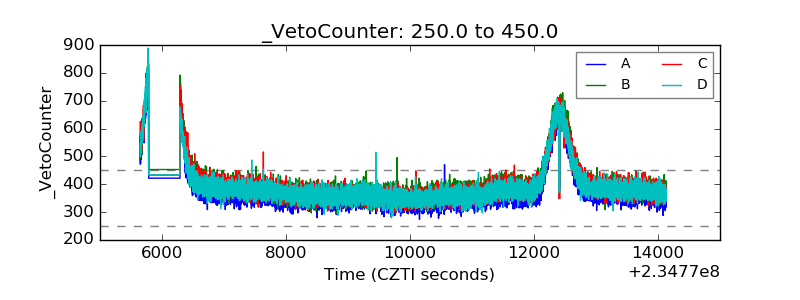 |