| Param | Original file | Final file |
|---|---|---|
| Filename | modeM0/AS1C02_042T02_9000001284_09199cztM0_level2.evt | modeM0/AS1C02_042T02_9000001284_09199cztM0_level2_quad_clean.evt |
| Size (bytes) | 1,427,379,840 | 223,827,840 |
| Size | 1.3 GB | 213.5 MB |
| Events in quadrant A | 13,613,621 | 1,377,756 |
| Events in quadrant B | 8,923,125 | 1,417,339 |
| Events in quadrant C | 9,328,280 | 1,375,389 |
| Events in quadrant D | 10,112,320 | 1,331,500 |
| Mode M9 | |||
|---|---|---|---|
| Quadrant | BADHDUFLAG | Total packets | Discarded packets |
| A | 0 | 18 | 0 |
| B | 0 | 18 | 0 |
| C | 0 | 18 | 0 |
| D | 0 | 18 | 0 |
| Mode SS | |||
|---|---|---|---|
| Quadrant | BADHDUFLAG | Total packets | Discarded packets |
| A | 0 | 376 | 0 |
| B | 0 | 376 | 0 |
| C | 0 | 376 | 0 |
| D | 0 | 376 | 0 |
| Mode M0 | |||
|---|---|---|---|
| Quadrant | BADHDUFLAG | Total packets | Discarded packets |
| A | 0 | 53611 | 7 |
| B | 0 | 38532 | 3 |
| C | 0 | 40546 | 3 |
| D | 0 | 43003 | 5 |
| Quadrant | Total seconds | Saturated seconds | Saturation percentage |
|---|---|---|---|
| A | 18534 | 406 | 2.190569% |
| B | 18535 | 191 | 1.030483% |
| C | 18535 | 366 | 1.974643% |
| D | 18534 | 545 | 2.940542% |
Noise dominated data is calculated using 1-second bins in cleaned event files. If a bin has >2000 counts, and if more than 50% of those come from <1% of pixels, then it is considered to be noise-dominated and hence unusable.
| Quadrant | # 1 sec bins | Bins with >0 counts | Bins with >2000 counts | High rate bins dominated by noise | Noise dominated (total time) | Noise dominated (detector-on time) | Marked lightcurve |
|---|---|---|---|---|---|---|---|
| A | 20271 | 18535 | 71 | 71 | 0.35% | 0.38% | 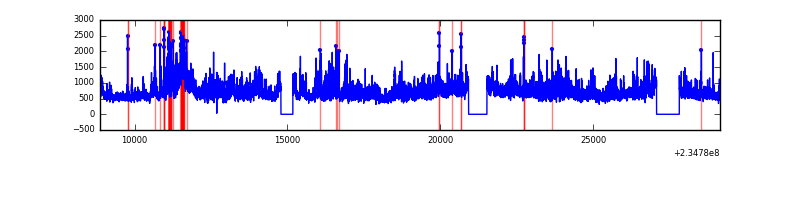 |
| B | 20271 | 18535 | 11 | 11 | 0.05% | 0.06% |  |
| C | 20270 | 18534 | 166 | 166 | 0.82% | 0.90% |  |
| D | 20271 | 18535 | 385 | 385 | 1.90% | 2.08% |  |
Top three noisy pixels from each quadrant. If the there are fewer than three noisy pixels in the level2.evt file, extra rows are filled as -1
| Pixel properties | Quadrant properties | ||||||
|---|---|---|---|---|---|---|---|
| Quadrant | DetID | PixID | Counts | Sigma | Mean | Median | Sigma |
| A | 8 | 5 | 4594678 | 10195.36 | 2191 | 2143 | 450.5 |
| A | 1 | 162 | 319458 | 704.43 | 2191 | 2143 | 450.5 |
| A | 1 | 178 | 72200 | 155.53 | 2191 | 2143 | 450.5 |
| B | 0 | 214 | 65850 | 150.27 | 2207 | 2151 | 423.9 |
| B | 0 | 213 | 62827 | 143.14 | 2207 | 2151 | 423.9 |
| B | 12 | 111 | 46062 | 103.59 | 2207 | 2151 | 423.9 |
| C | 4 | 254 | 1035446 | 2099.73 | 2116 | 2126 | 492.1 |
| C | 13 | 61 | 16288 | 28.78 | 2116 | 2126 | 492.1 |
| C | 8 | 128 | 13913 | 23.95 | 2116 | 2126 | 492.1 |
| D | 4 | 95 | 1031858 | 1820.73 | 2104 | 2054 | 565.6 |
| D | 9 | 64 | 377352 | 663.54 | 2104 | 2054 | 565.6 |
| D | 7 | 71 | 320696 | 563.37 | 2104 | 2054 | 565.6 |
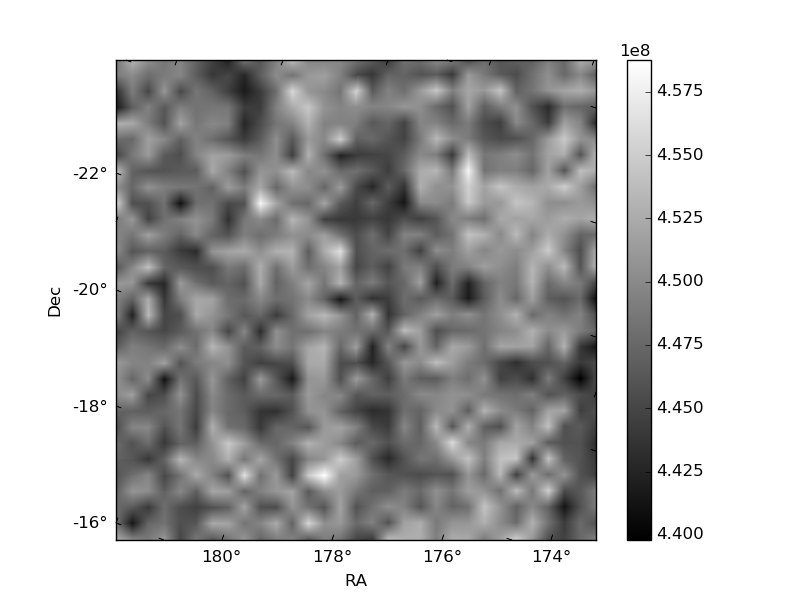
Histogram calculated using DETX and DETY for each event in the final _common_clean file
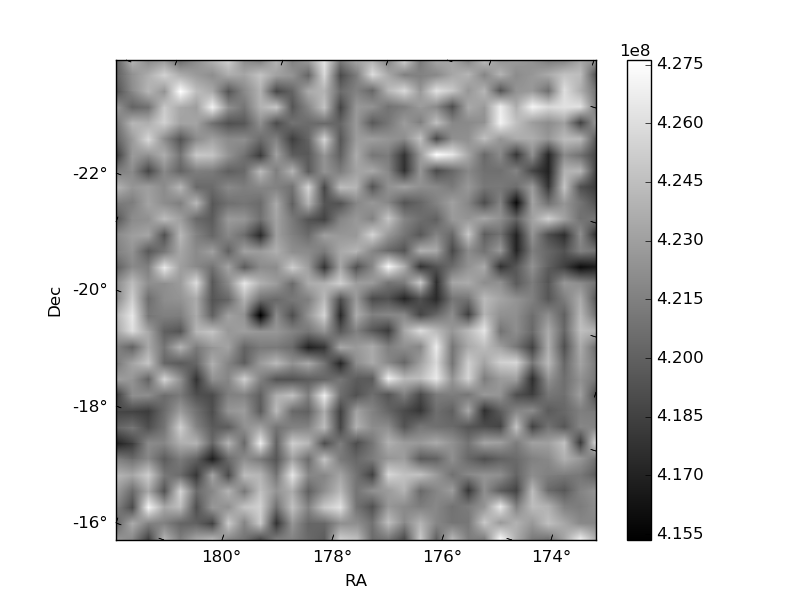
| Quadrant A | 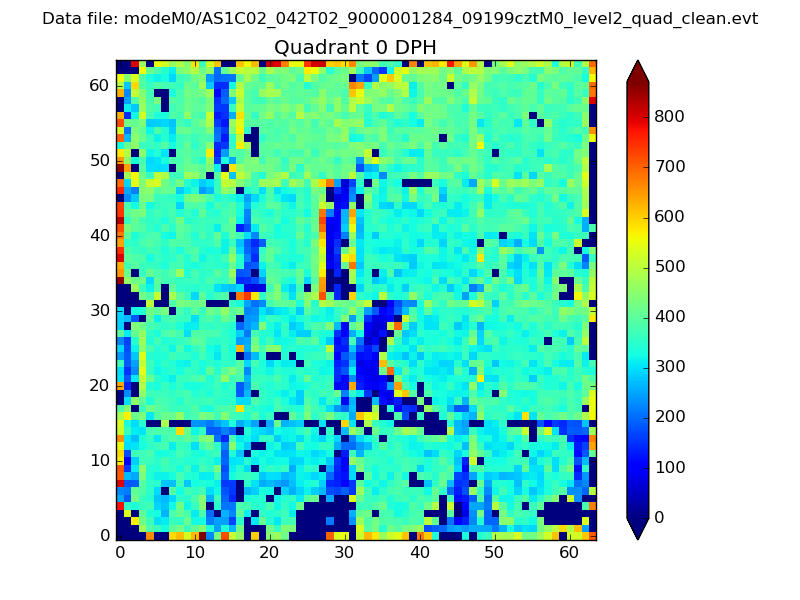 |
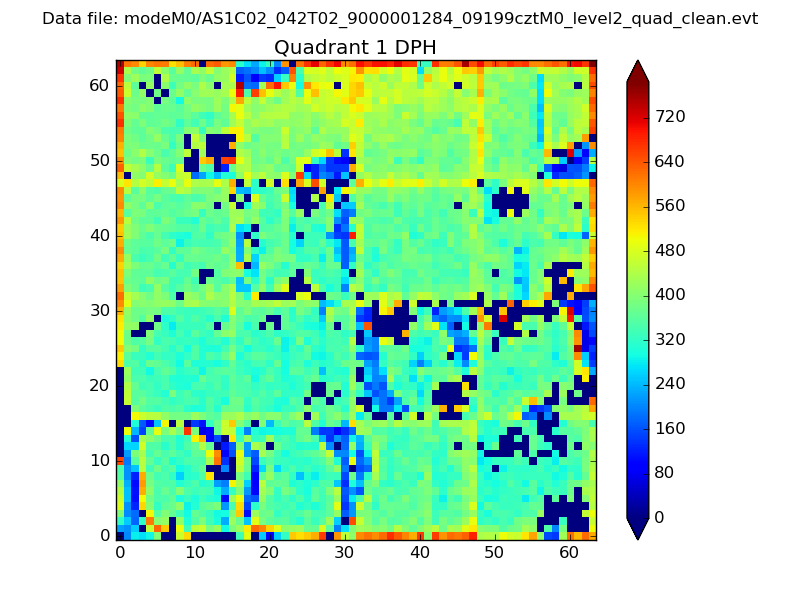 |
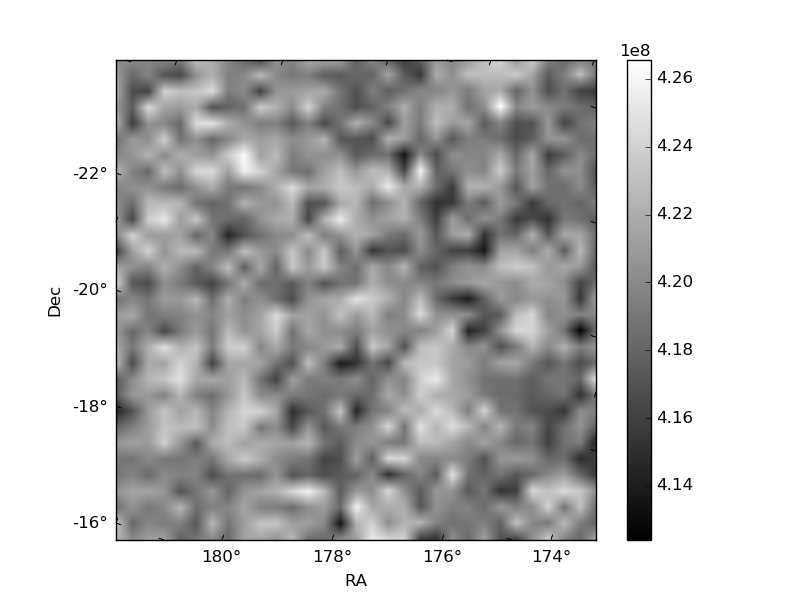
Quadrant B |
|---|---|---|---|
| Quadrant D | 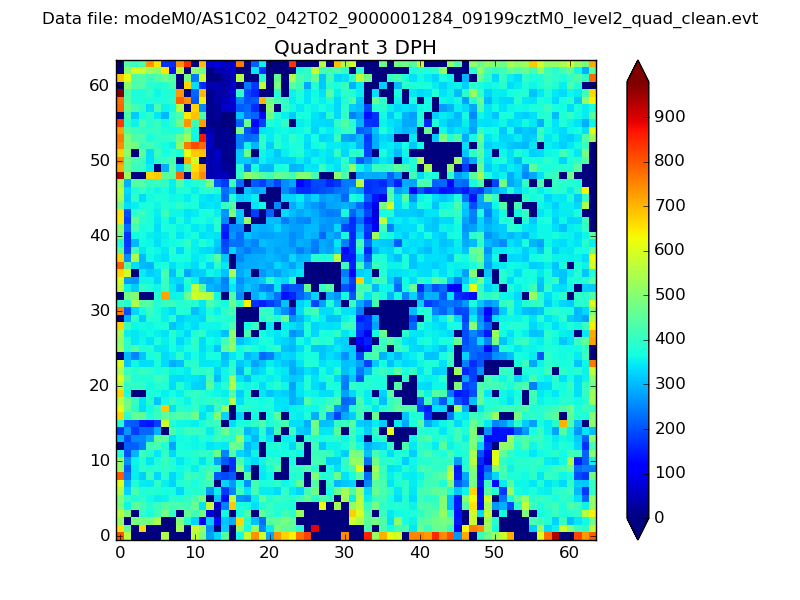 |
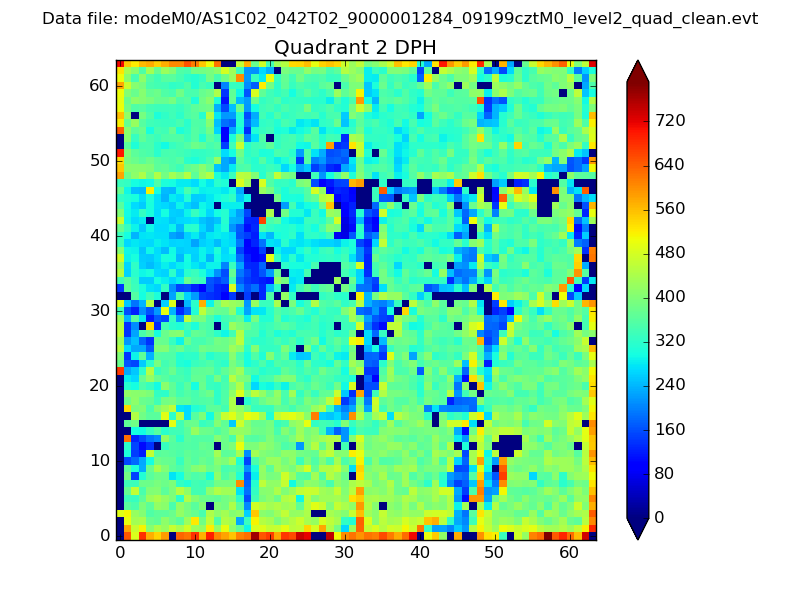 |
Quadrant C |
| Plot type | Count rate plots | Images |
|---|---|---|
| Comparison with Poisson distribution Blue bars denote a histogram of data divided into 1 sec bins. Red curve is a Poisson curve with rate = median count rate of data. |
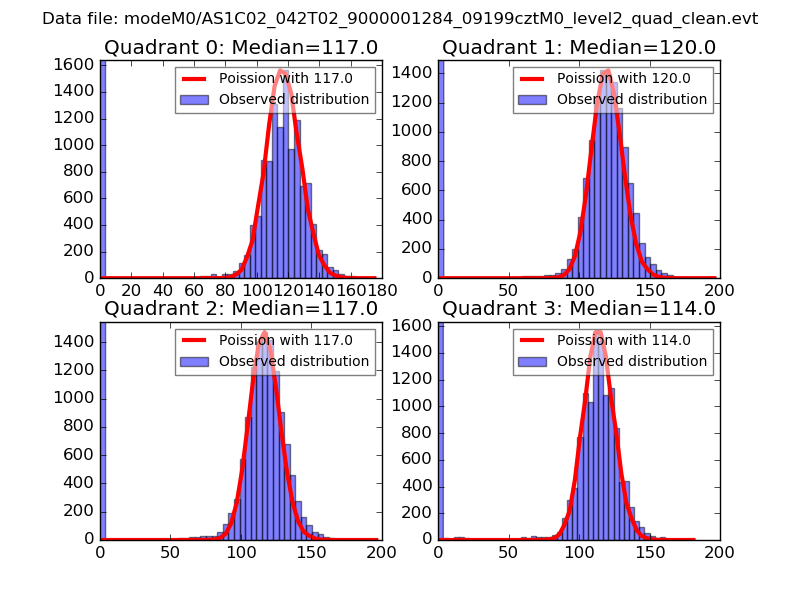 |
 |
| Quadrant-wise count rates Data is divided into 100 sec bins |
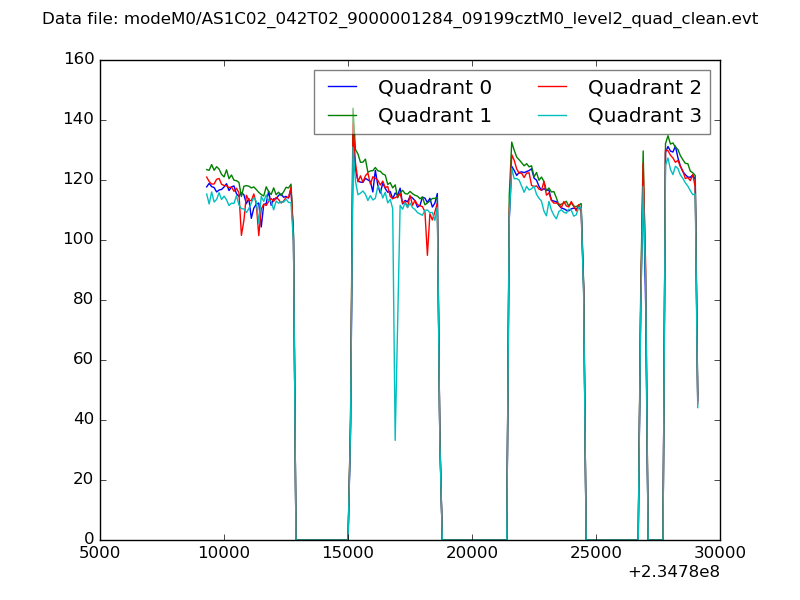 |
|
| Module-wise count rates for Quadrant A Data is divided into 100 sec bins |
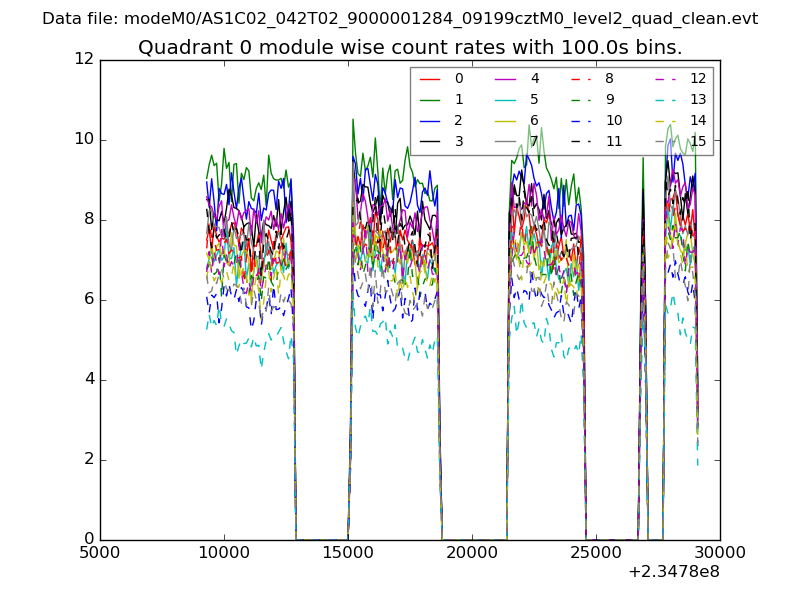 |
 |
| Module-wise count rates for Quadrant B Data is divided into 100 sec bins |
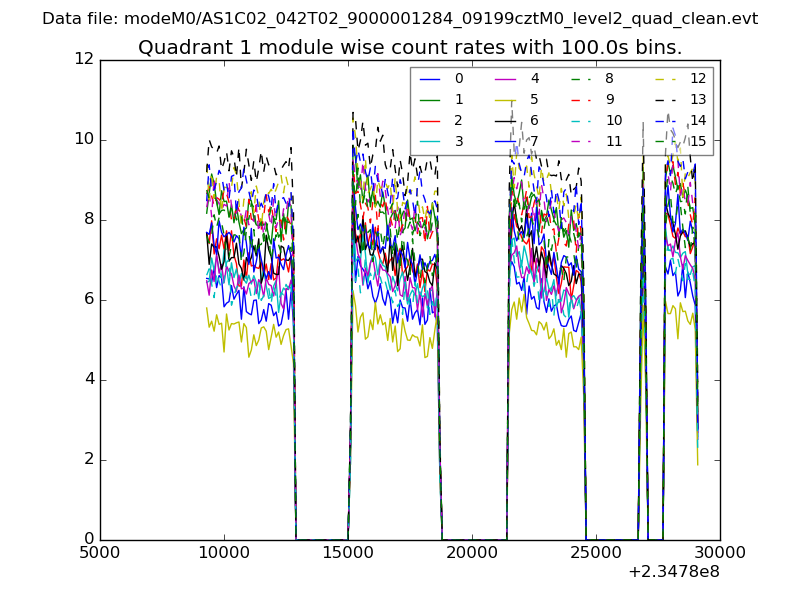 |
 |
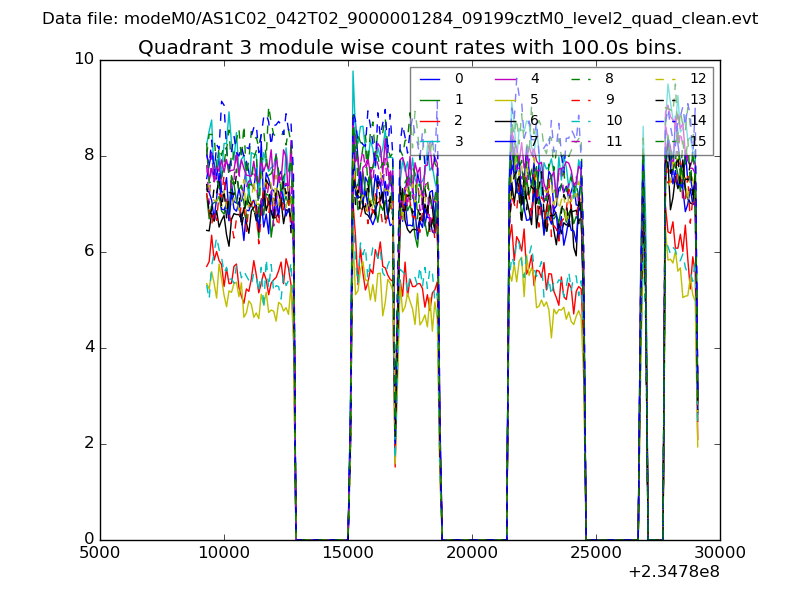
| Module-wise count rates for Quadrant C Data is divided into 100 sec bins |
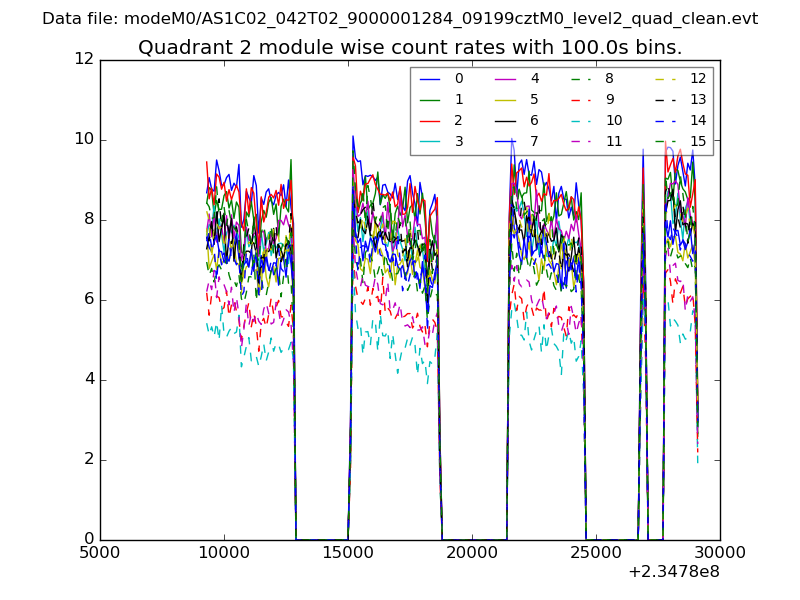 |
 |
| Module-wise count rates for Quadrant D Data is divided into 100 sec bins |
 |
 |
| Parameter | Plot |
|---|---|
| CZT HV Monitor | 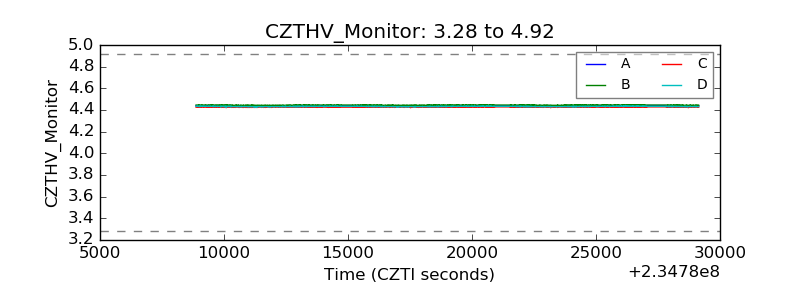 |
| D_VDD | 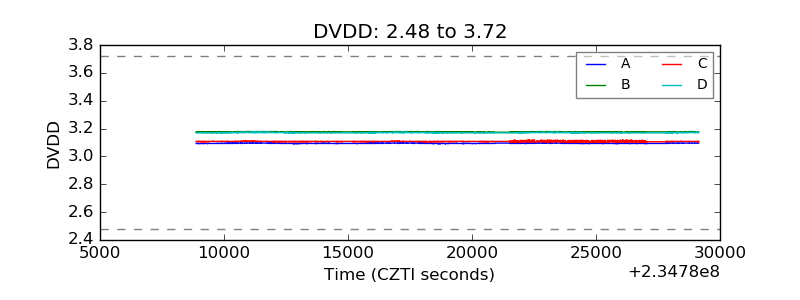 |
| Temperature 1 | 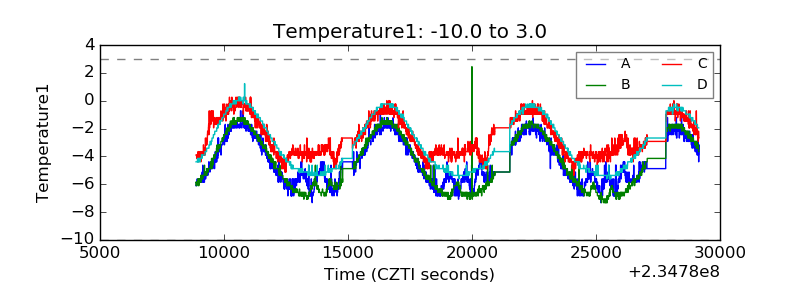 |
| Veto HV Monitor | 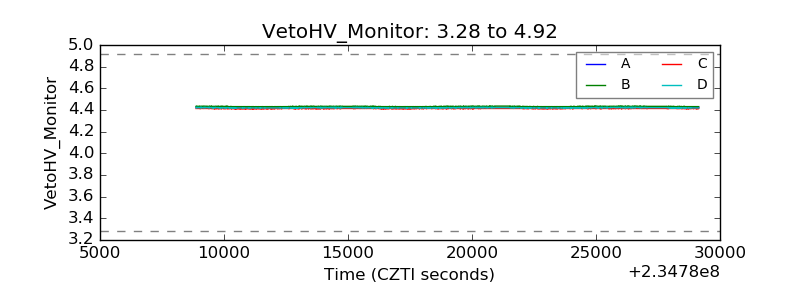 |
| Veto LLD | 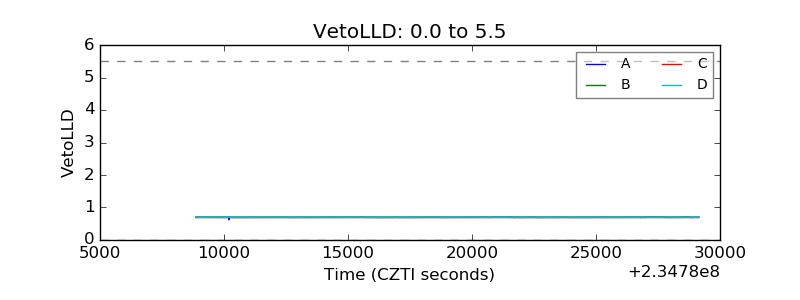 |
| Alpha Counter | 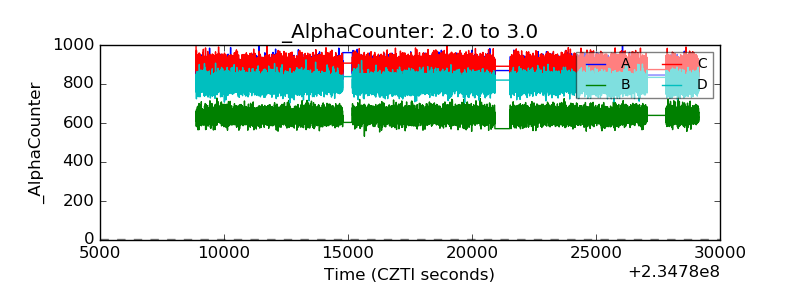 |
| _CPM_Rate | 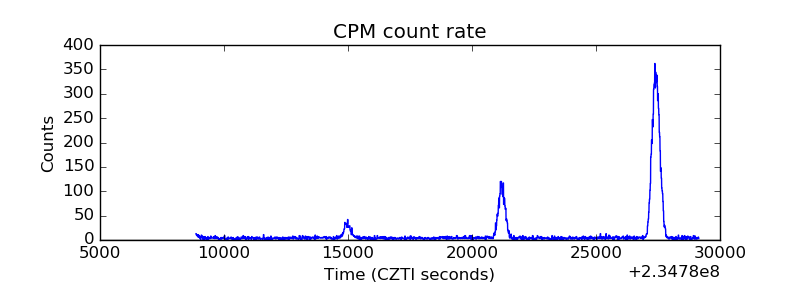 |
| CZT Counter | 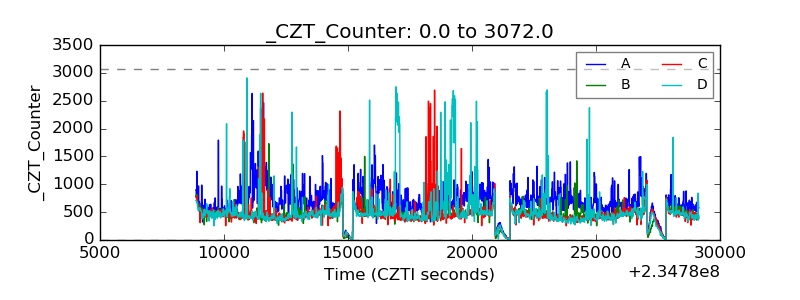 |
| +2.5 Volts monitor |  |
| +5 Volts monitor |  |
| _ROLL_ROT | 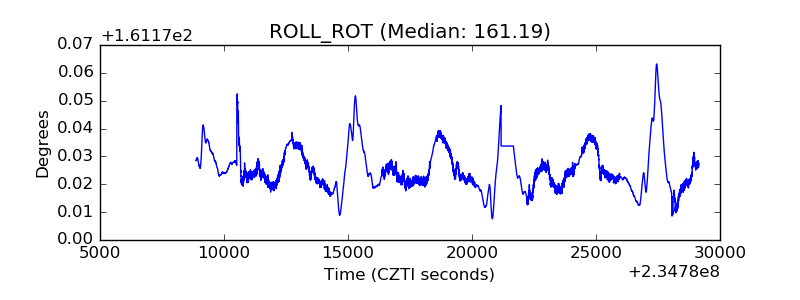 |
| _Roll_DEC | 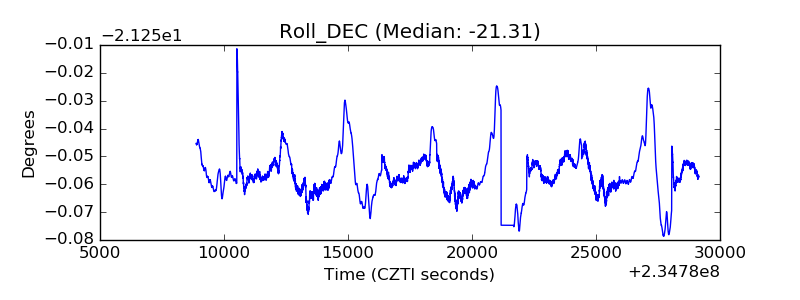 |
| _Roll_RA | 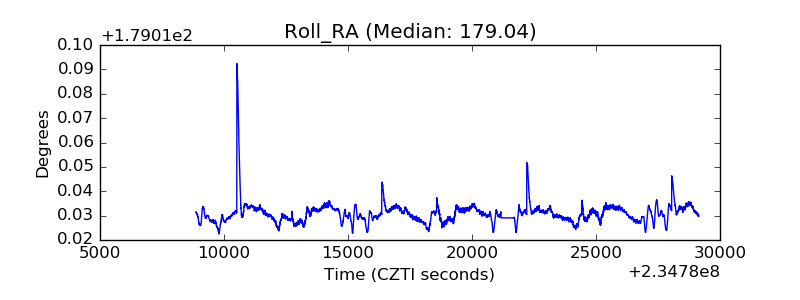 |
| Veto Counter | 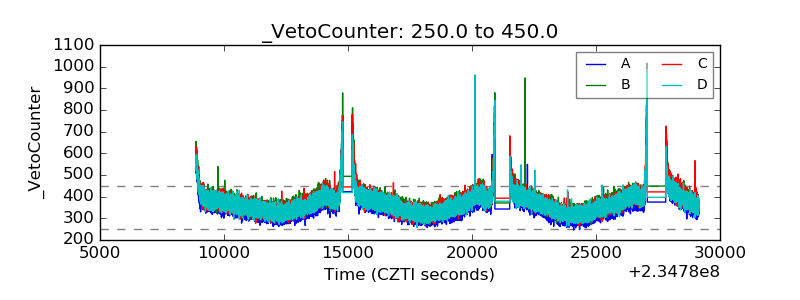 |