| Param | Original file | Final file |
|---|---|---|
| Filename | modeM0/AS1C02_042T02_9000001284_09200cztM0_level2.evt | modeM0/AS1C02_042T02_9000001284_09200cztM0_level2_quad_clean.evt |
| Size (bytes) | 481,786,560 | 89,231,040 |
| Size | 459.5 MB | 85.1 MB |
| Events in quadrant A | 4,444,087 | 558,317 |
| Events in quadrant B | 3,300,671 | 570,594 |
| Events in quadrant C | 3,079,359 | 557,483 |
| Events in quadrant D | 3,306,165 | 542,937 |
| Mode M9 | |||
|---|---|---|---|
| Quadrant | BADHDUFLAG | Total packets | Discarded packets |
| A | 0 | 18 | 0 |
| B | 0 | 18 | 0 |
| C | 0 | 18 | 0 |
| D | 0 | 18 | 0 |
| Mode SS | |||
|---|---|---|---|
| Quadrant | BADHDUFLAG | Total packets | Discarded packets |
| A | 0 | 138 | 0 |
| B | 0 | 138 | 0 |
| C | 0 | 138 | 0 |
| D | 0 | 138 | 0 |
| Mode M0 | |||
|---|---|---|---|
| Quadrant | BADHDUFLAG | Total packets | Discarded packets |
| A | 0 | 17892 | 3 |
| B | 0 | 14214 | 2 |
| C | 0 | 13917 | 2 |
| D | 0 | 14659 | 2 |
| Quadrant | Total seconds | Saturated seconds | Saturation percentage |
|---|---|---|---|
| A | 6788 | 174 | 2.563347% |
| B | 6788 | 101 | 1.487920% |
| C | 6788 | 55 | 0.810253% |
| D | 6788 | 102 | 1.502652% |
Noise dominated data is calculated using 1-second bins in cleaned event files. If a bin has >2000 counts, and if more than 50% of those come from <1% of pixels, then it is considered to be noise-dominated and hence unusable.
| Quadrant | # 1 sec bins | Bins with >0 counts | Bins with >2000 counts | High rate bins dominated by noise | Noise dominated (total time) | Noise dominated (detector-on time) | Marked lightcurve |
|---|---|---|---|---|---|---|---|
| A | 8483 | 6788 | 40 | 40 | 0.47% | 0.59% | 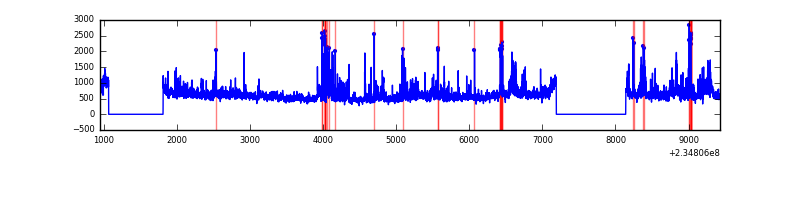 |
| B | 8483 | 6788 | 7 | 7 | 0.08% | 0.10% | 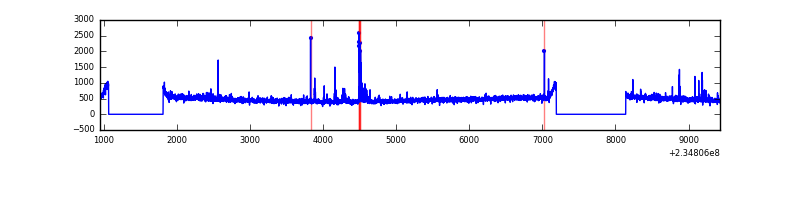 |
| C | 8482 | 6787 | 0 | 0 | 0.00% | 0.00% | 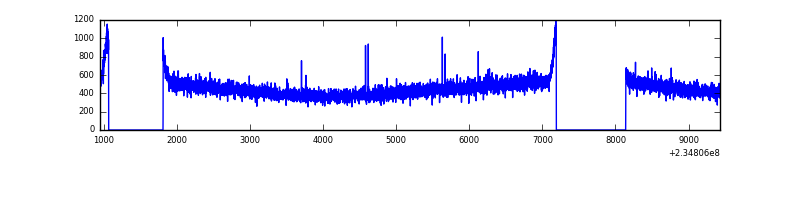 |
| D | 8483 | 6788 | 32 | 32 | 0.38% | 0.47% | 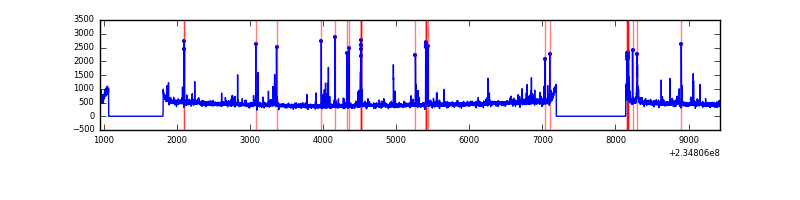 |
Top three noisy pixels from each quadrant. If the there are fewer than three noisy pixels in the level2.evt file, extra rows are filled as -1
| Pixel properties | Quadrant properties | ||||||
|---|---|---|---|---|---|---|---|
| Quadrant | DetID | PixID | Counts | Sigma | Mean | Median | Sigma |
| A | 8 | 5 | 1010542 | 6019.75 | 812 | 793 | 167.7 |
| A | 1 | 162 | 127693 | 756.53 | 812 | 793 | 167.7 |
| A | 13 | 248 | 56897 | 334.47 | 812 | 793 | 167.7 |
| B | 4 | 48 | 49913 | 309.15 | 817 | 797 | 158.9 |
| B | 0 | 214 | 22280 | 135.22 | 817 | 797 | 158.9 |
| B | 12 | 111 | 16831 | 100.92 | 817 | 797 | 158.9 |
| C | 13 | 61 | 6019 | 28.19 | 789 | 794 | 185.3 |
| C | 8 | 222 | 2722 | 10.4 | 789 | 794 | 185.3 |
| C | 3 | 202 | 1934 | 6.15 | 789 | 794 | 185.3 |
| D | 7 | 71 | 121914 | 575.34 | 784 | 764 | 210.6 |
| D | 4 | 95 | 100255 | 472.48 | 784 | 764 | 210.6 |
| D | 2 | 14 | 52030 | 243.46 | 784 | 764 | 210.6 |
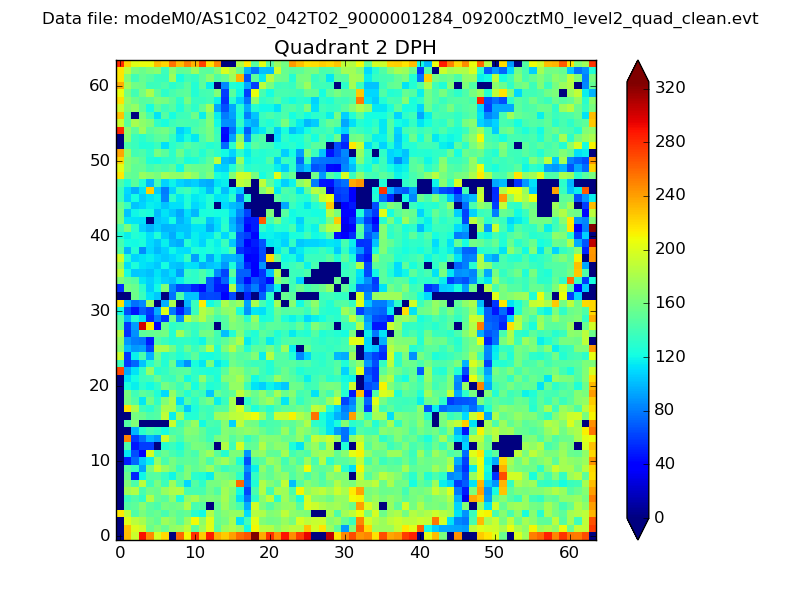
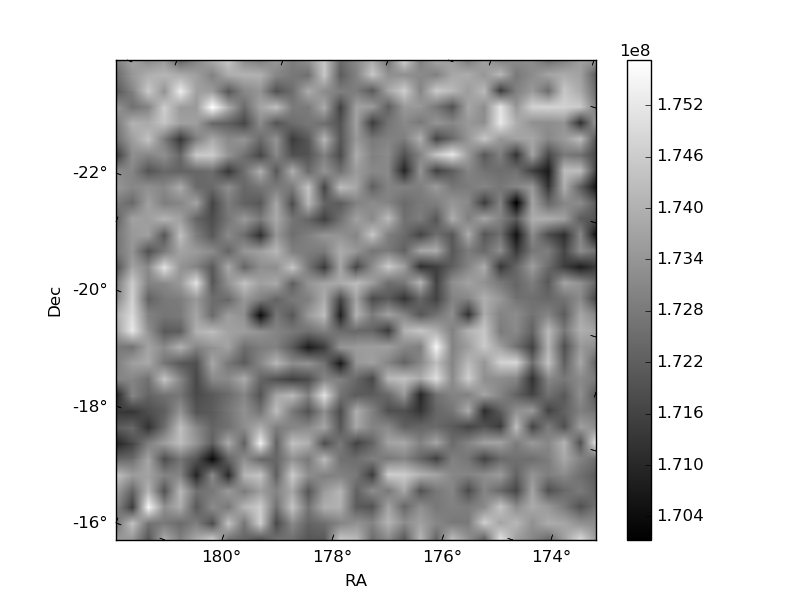
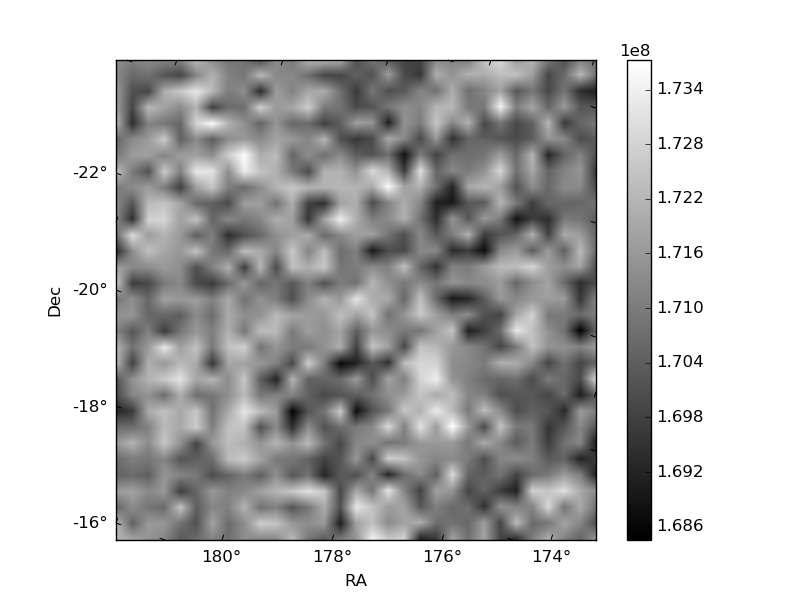
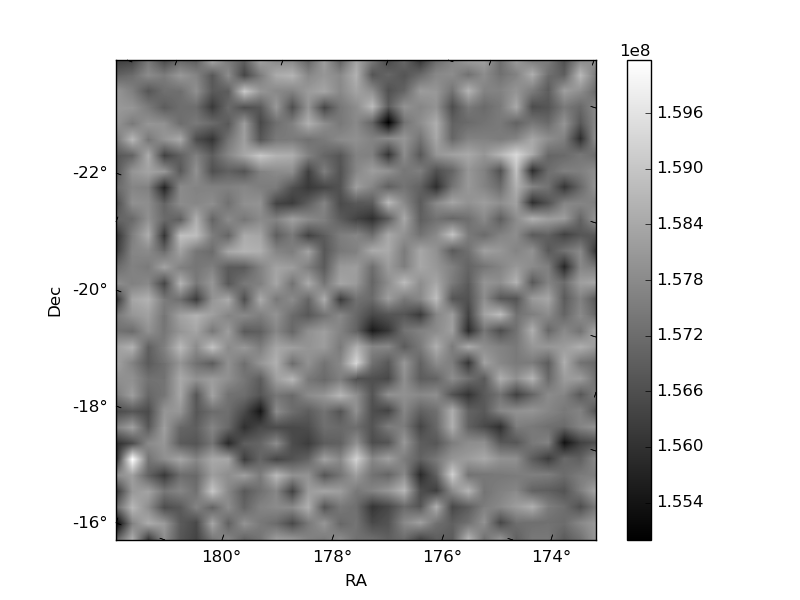
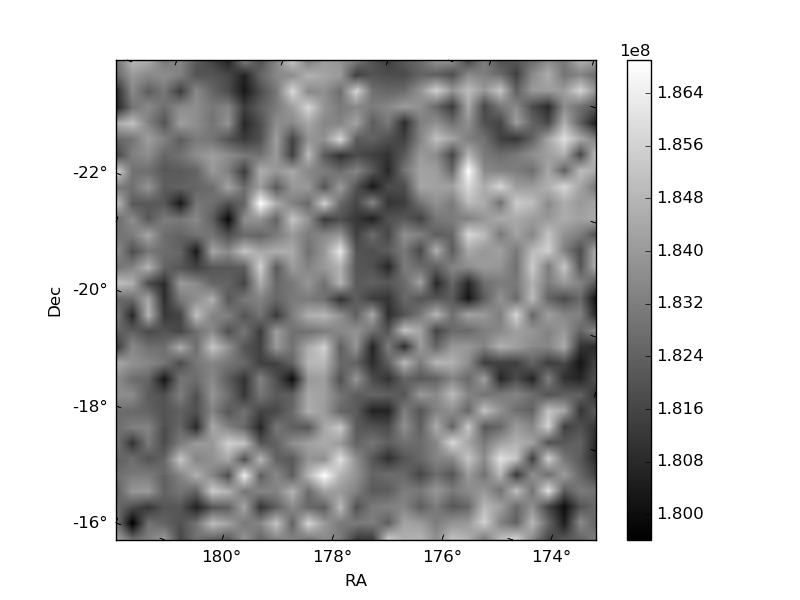
Histogram calculated using DETX and DETY for each event in the final _common_clean file
| Quadrant A | 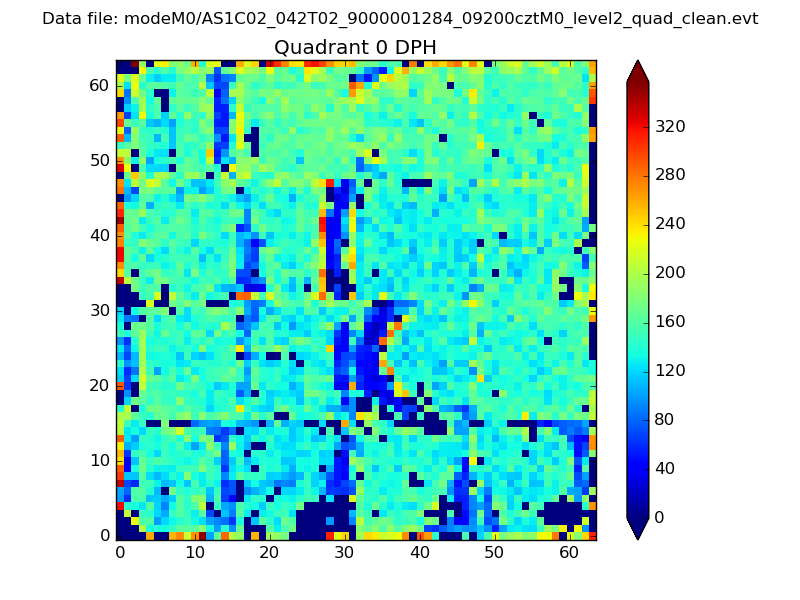 |
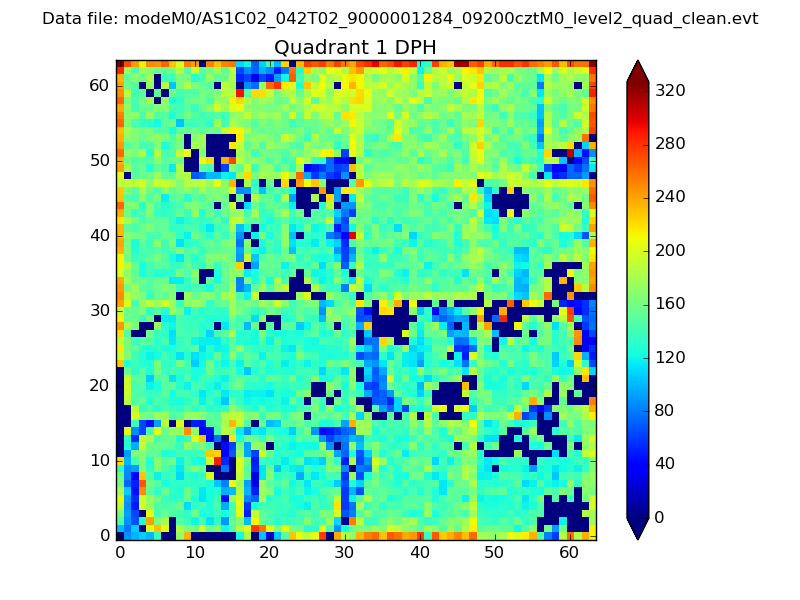 |
Quadrant B |
|---|---|---|---|
| Quadrant D | 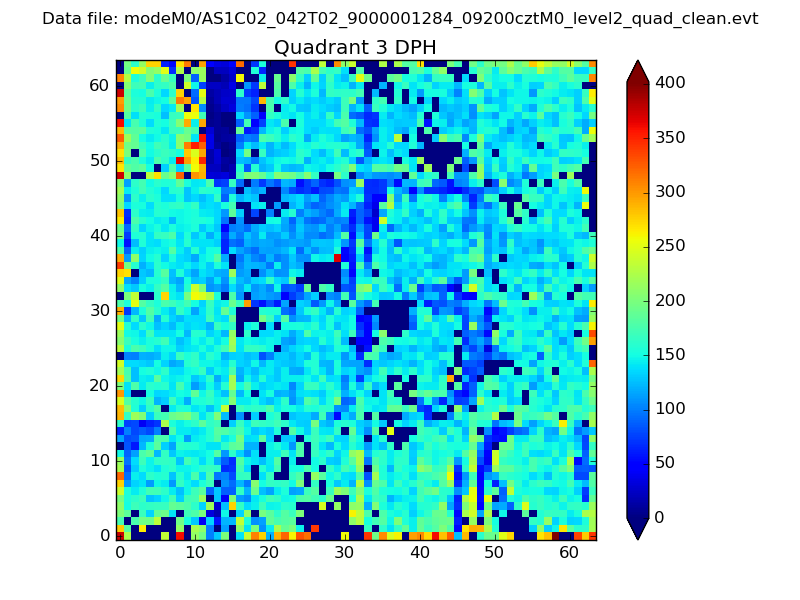 |
 |
Quadrant C |
| Plot type | Count rate plots | Images |
|---|---|---|
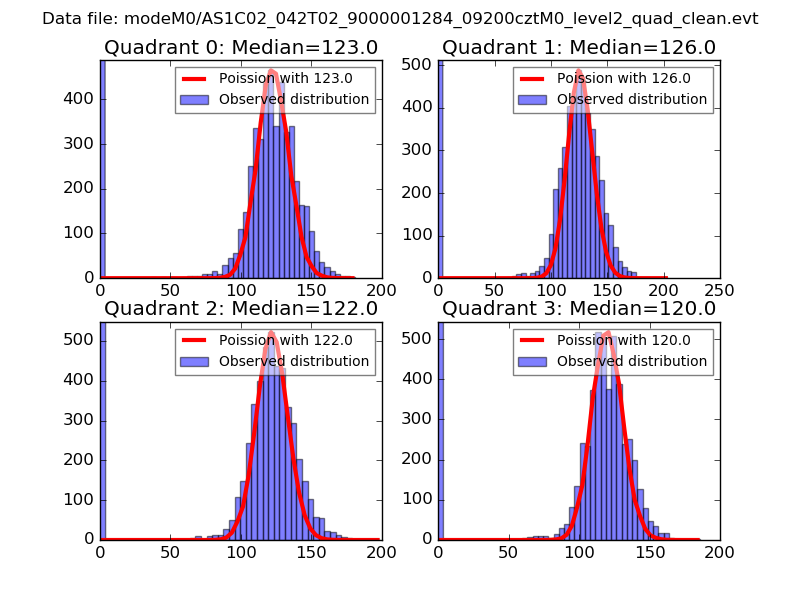
| Comparison with Poisson distribution Blue bars denote a histogram of data divided into 1 sec bins. Red curve is a Poisson curve with rate = median count rate of data. |
 |
 |
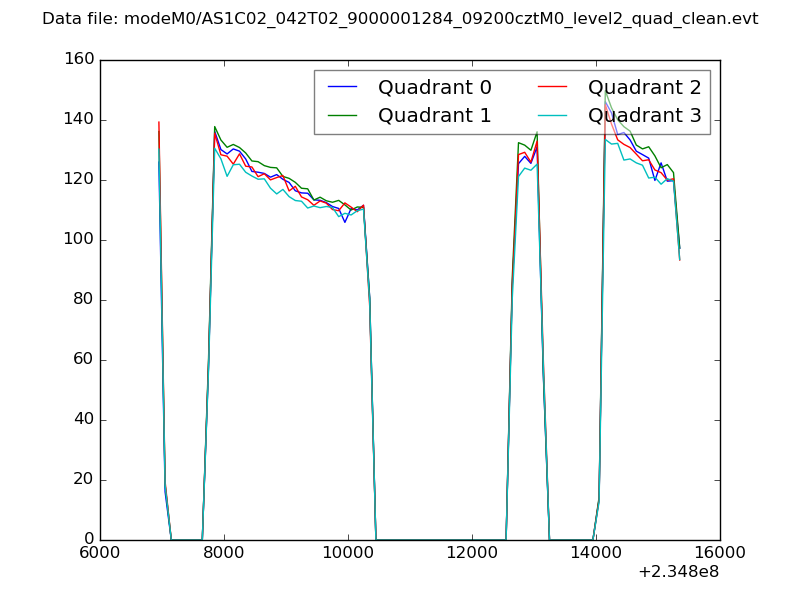
| Quadrant-wise count rates Data is divided into 100 sec bins |
 |
|
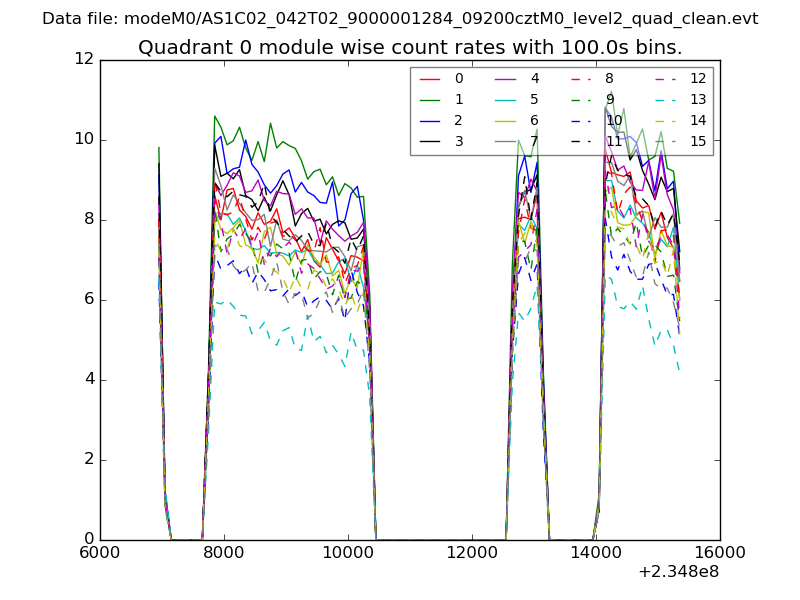
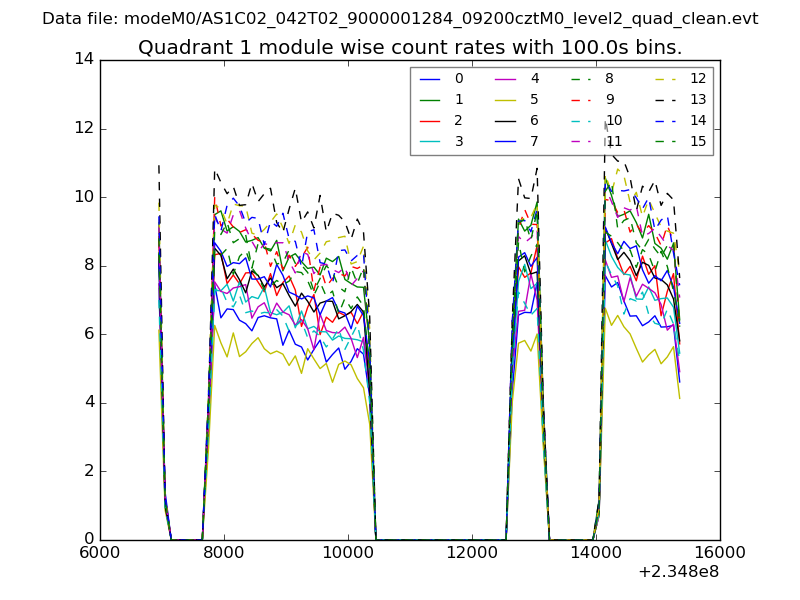
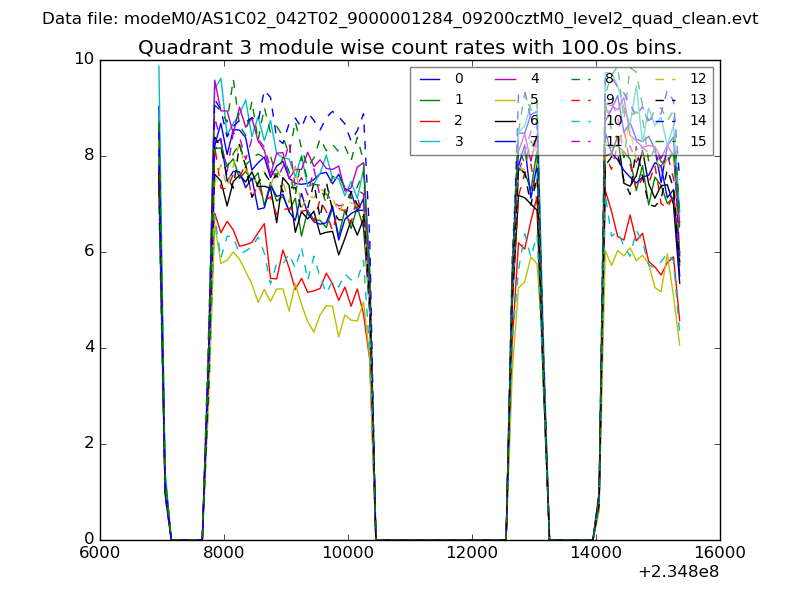
| Module-wise count rates for Quadrant A Data is divided into 100 sec bins |
 |
 |
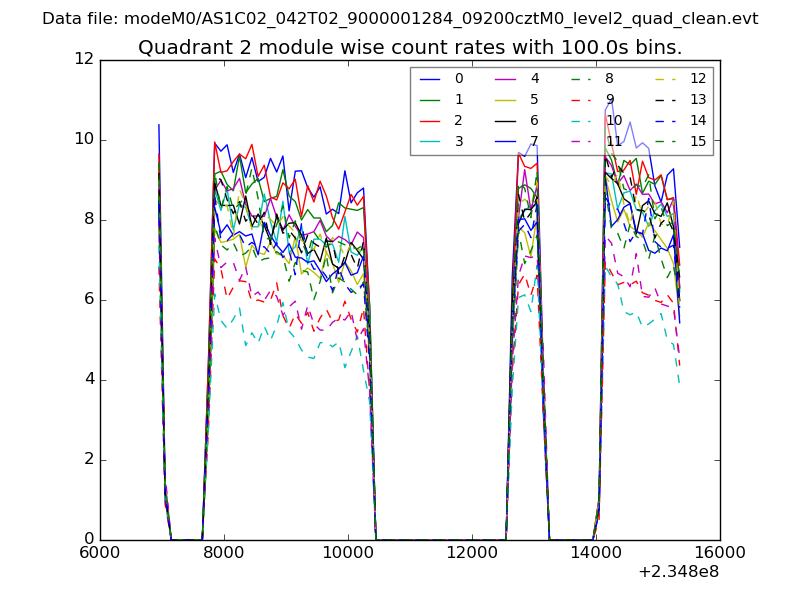
| Module-wise count rates for Quadrant B Data is divided into 100 sec bins |
 |
 |
| Module-wise count rates for Quadrant C Data is divided into 100 sec bins |
 |
 |
| Module-wise count rates for Quadrant D Data is divided into 100 sec bins |
 |
 |
| Parameter | Plot |
|---|---|
| CZT HV Monitor | 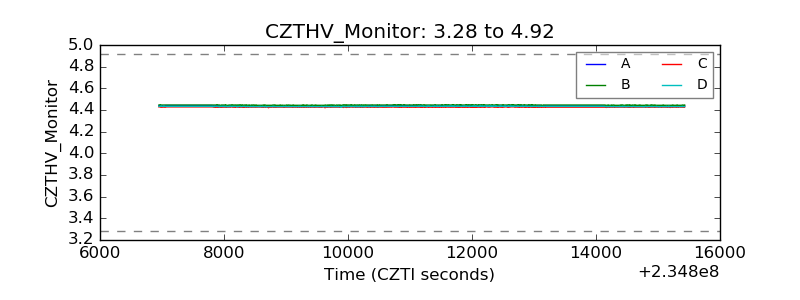 |
| D_VDD | 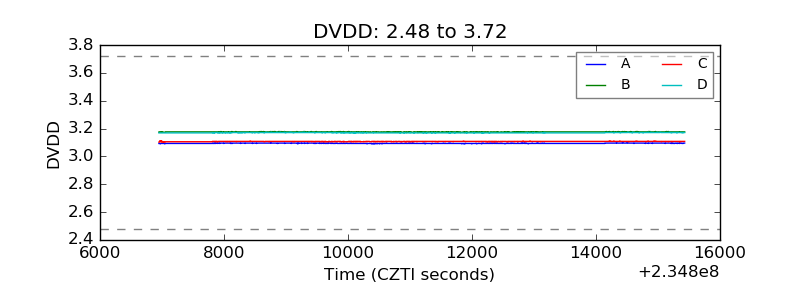 |
| Temperature 1 | 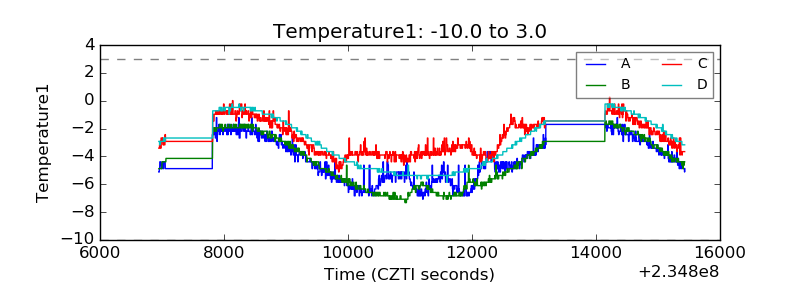 |
| Veto HV Monitor | 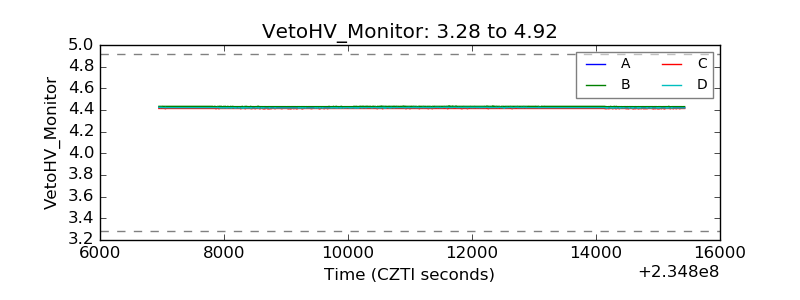 |
| Veto LLD | 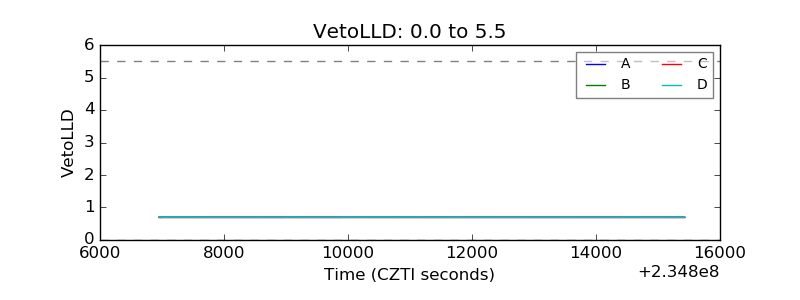 |
| Alpha Counter | 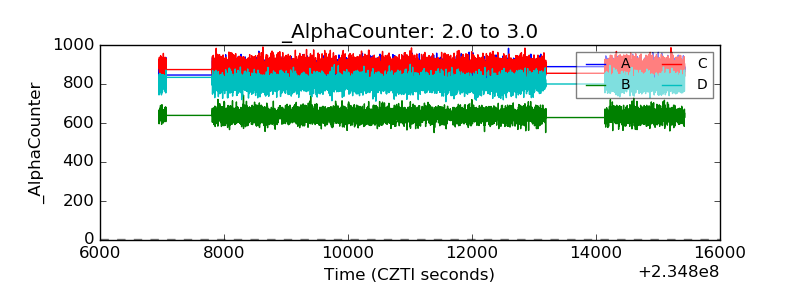 |
| _CPM_Rate | 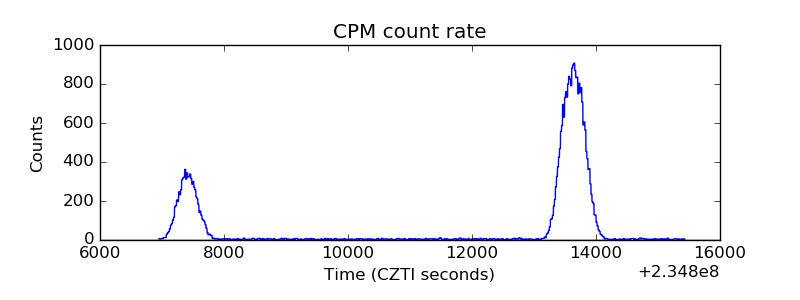 |
| CZT Counter | 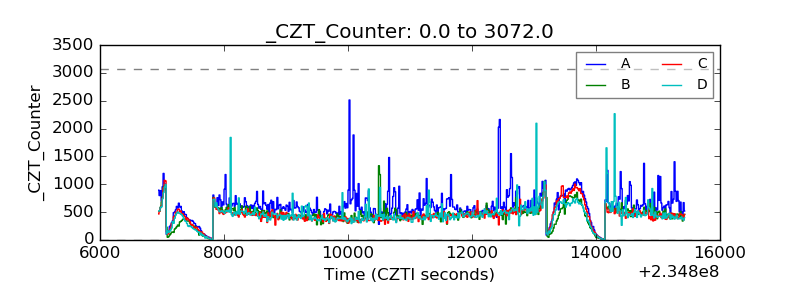 |
| +2.5 Volts monitor |  |
| +5 Volts monitor |  |
| _ROLL_ROT | 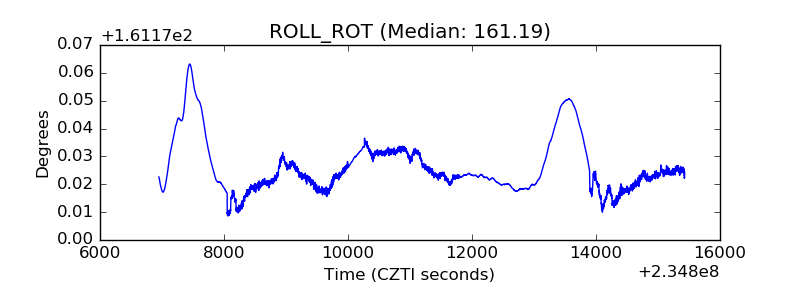 |
| _Roll_DEC | 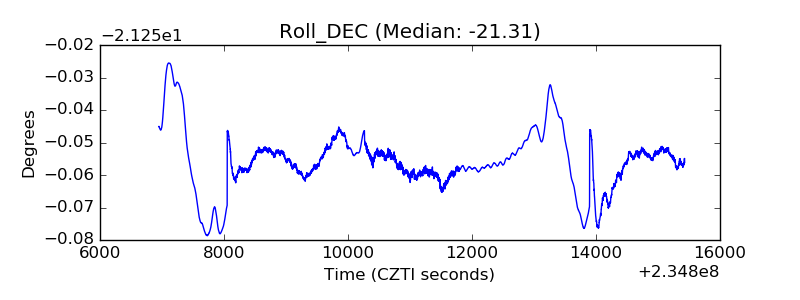 |
| _Roll_RA | 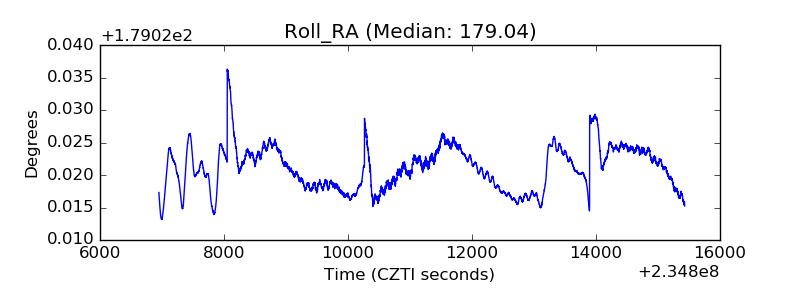 |
| Veto Counter | 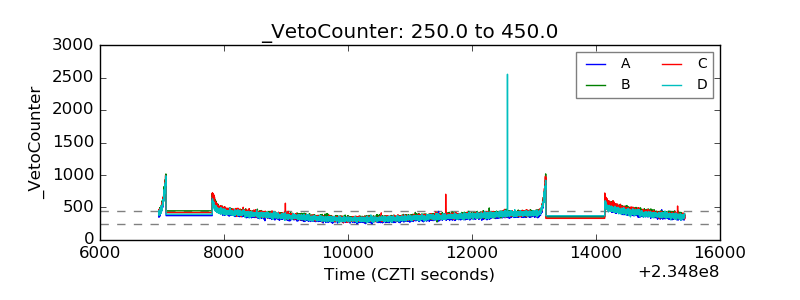 |