| Param | Original file | Final file |
|---|---|---|
| Filename | modeM0/AS1C02_042T02_9000001284_09202cztM0_level2.evt | modeM0/AS1C02_042T02_9000001284_09202cztM0_level2_quad_clean.evt |
| Size (bytes) | 479,923,200 | 86,711,040 |
| Size | 457.7 MB | 82.7 MB |
| Events in quadrant A | 4,577,555 | 543,034 |
| Events in quadrant B | 3,301,971 | 559,399 |
| Events in quadrant C | 2,972,407 | 543,826 |
| Events in quadrant D | 3,241,587 | 526,469 |
| Mode M9 | |||
|---|---|---|---|
| Quadrant | BADHDUFLAG | Total packets | Discarded packets |
| A | 0 | 21 | 0 |
| B | 0 | 21 | 0 |
| C | 0 | 21 | 0 |
| D | 0 | 21 | 0 |
| Mode SS | |||
|---|---|---|---|
| Quadrant | BADHDUFLAG | Total packets | Discarded packets |
| A | 0 | 134 | 0 |
| B | 0 | 134 | 0 |
| C | 0 | 134 | 0 |
| D | 0 | 134 | 0 |
| Mode M0 | |||
|---|---|---|---|
| Quadrant | BADHDUFLAG | Total packets | Discarded packets |
| A | 0 | 18002 | 3 |
| B | 0 | 13892 | 2 |
| C | 0 | 13302 | 4 |
| D | 0 | 14292 | 2 |
| Quadrant | Total seconds | Saturated seconds | Saturation percentage |
|---|---|---|---|
| A | 6494 | 177 | 2.725593% |
| B | 6494 | 83 | 1.278103% |
| C | 6493 | 43 | 0.662252% |
| D | 6494 | 84 | 1.293502% |
Noise dominated data is calculated using 1-second bins in cleaned event files. If a bin has >2000 counts, and if more than 50% of those come from <1% of pixels, then it is considered to be noise-dominated and hence unusable.
| Quadrant | # 1 sec bins | Bins with >0 counts | Bins with >2000 counts | High rate bins dominated by noise | Noise dominated (total time) | Noise dominated (detector-on time) | Marked lightcurve |
|---|---|---|---|---|---|---|---|
| A | 8548 | 6493 | 45 | 45 | 0.53% | 0.69% | 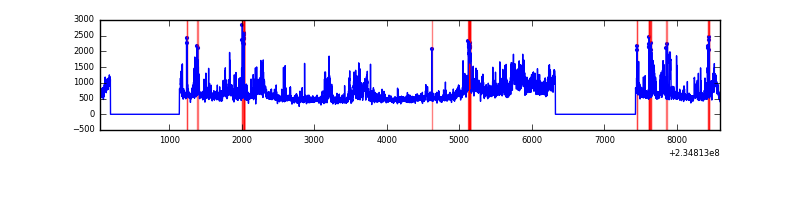 |
| B | 8549 | 6494 | 11 | 11 | 0.13% | 0.17% | 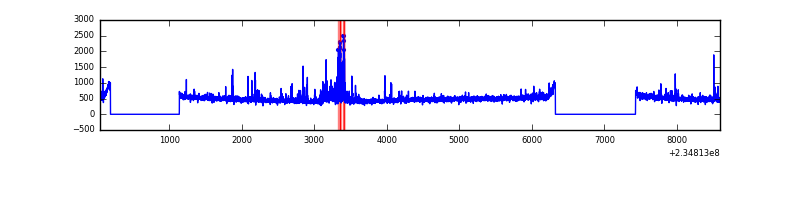 |
| C | 8549 | 6494 | 0 | 0 | 0.00% | 0.00% | 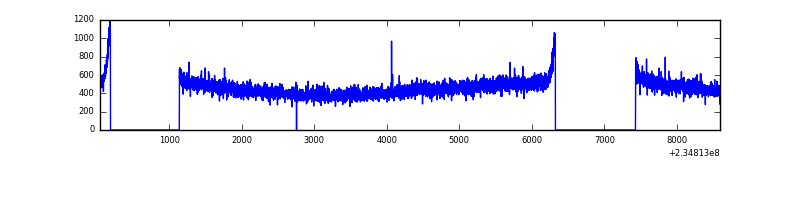 |
| D | 8548 | 6493 | 35 | 35 | 0.41% | 0.54% | 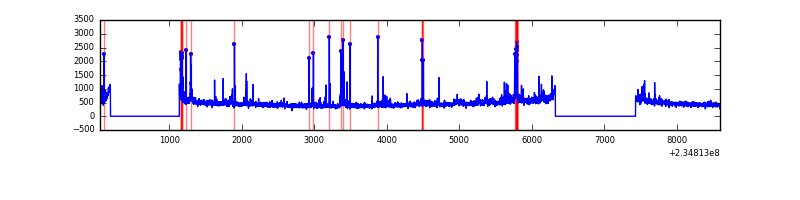 |
Top three noisy pixels from each quadrant. If the there are fewer than three noisy pixels in the level2.evt file, extra rows are filled as -1
| Pixel properties | Quadrant properties | ||||||
|---|---|---|---|---|---|---|---|
| Quadrant | DetID | PixID | Counts | Sigma | Mean | Median | Sigma |
| A | 8 | 5 | 1364371 | 8564.63 | 780 | 765 | 159.2 |
| A | 1 | 162 | 114399 | 713.72 | 780 | 765 | 159.2 |
| A | 5 | 16 | 30937 | 189.51 | 780 | 765 | 159.2 |
| B | 4 | 48 | 123694 | 807.46 | 788 | 769 | 152.2 |
| B | 4 | 173 | 49801 | 322.08 | 788 | 769 | 152.2 |
| B | 0 | 245 | 19249 | 121.39 | 788 | 769 | 152.2 |
| C | 3 | 233 | 10446 | 54.68 | 758 | 763 | 177.1 |
| C | 13 | 61 | 5750 | 28.16 | 758 | 763 | 177.1 |
| C | 8 | 222 | 3703 | 16.6 | 758 | 763 | 177.1 |
| D | 1 | 52 | 130497 | 652.97 | 750 | 729 | 198.7 |
| D | 7 | 71 | 127964 | 640.22 | 750 | 729 | 198.7 |
| D | 13 | 112 | 46189 | 228.75 | 750 | 729 | 198.7 |
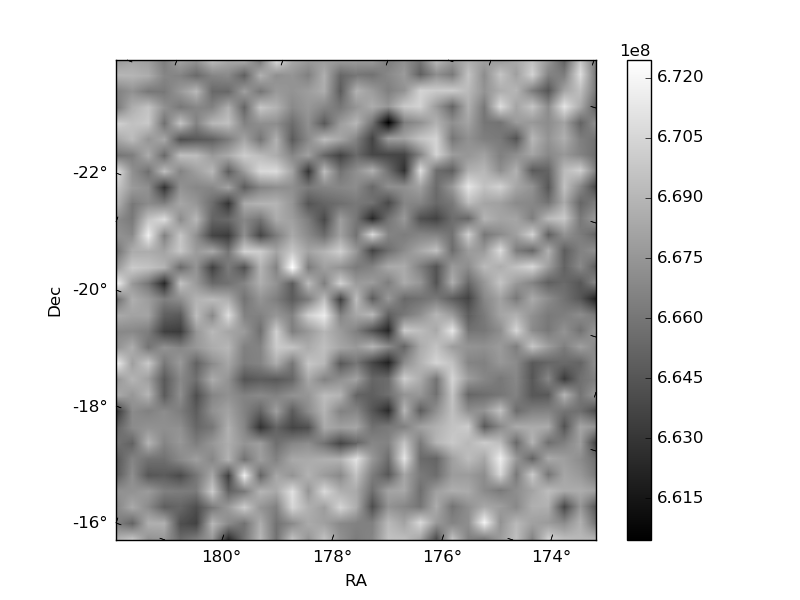
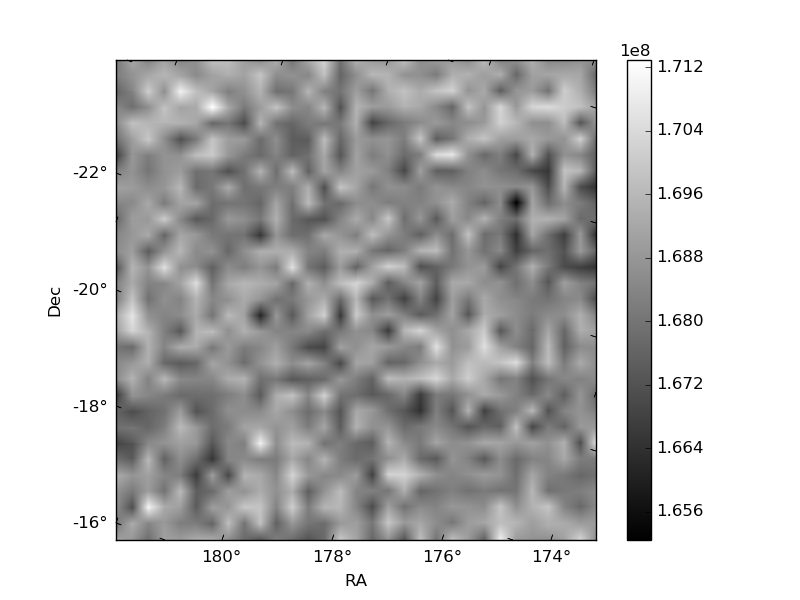
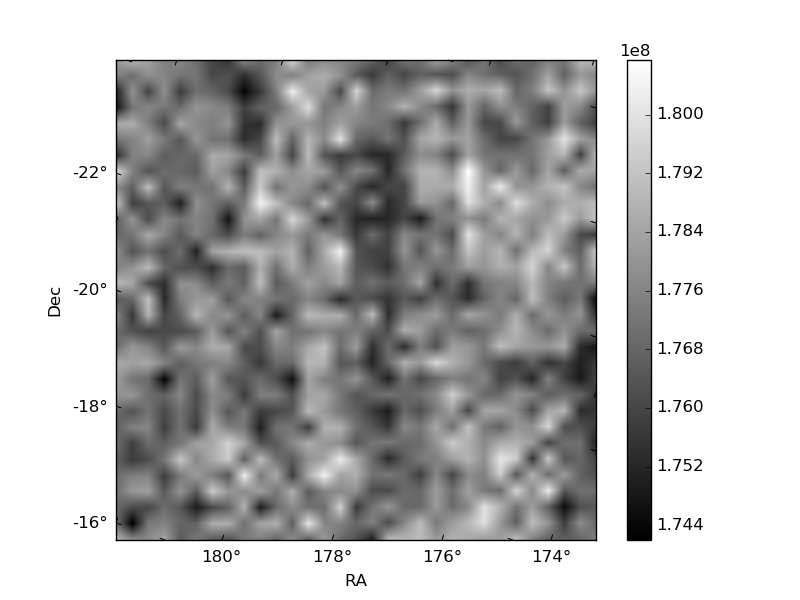
Histogram calculated using DETX and DETY for each event in the final _common_clean file
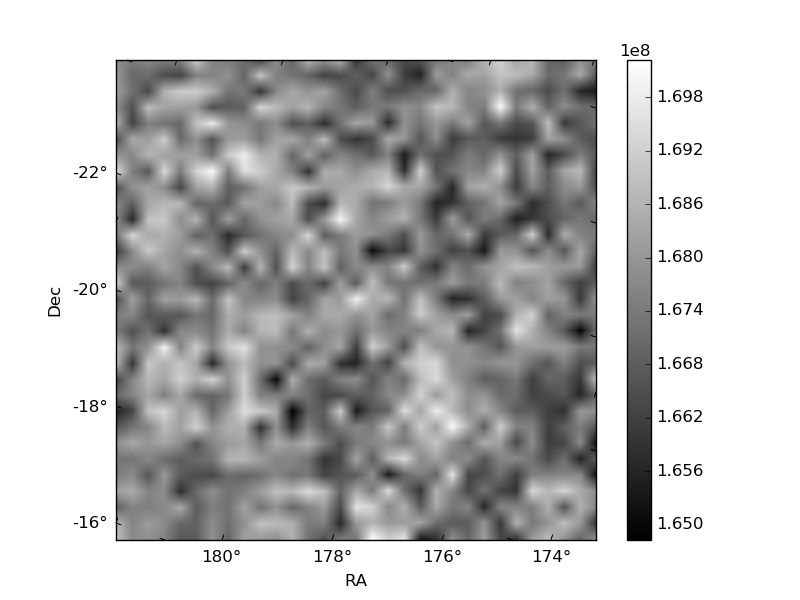
| Quadrant A | 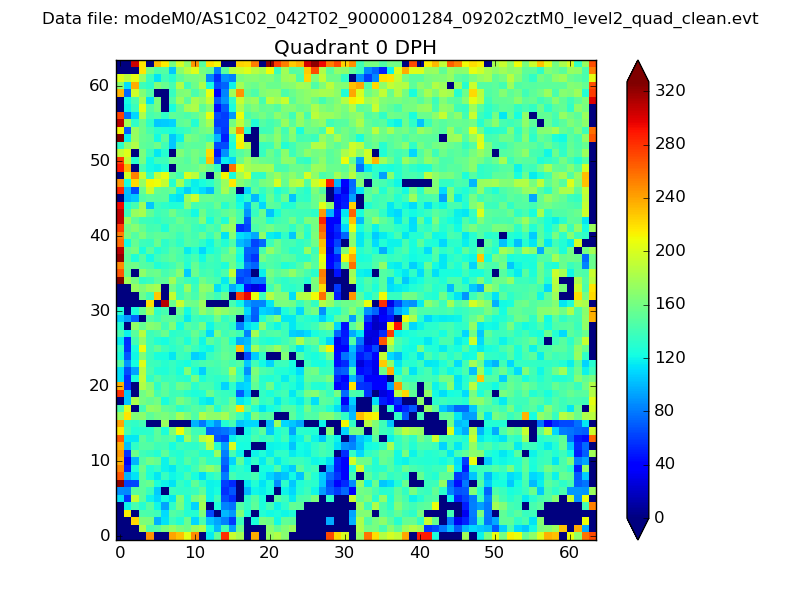 |
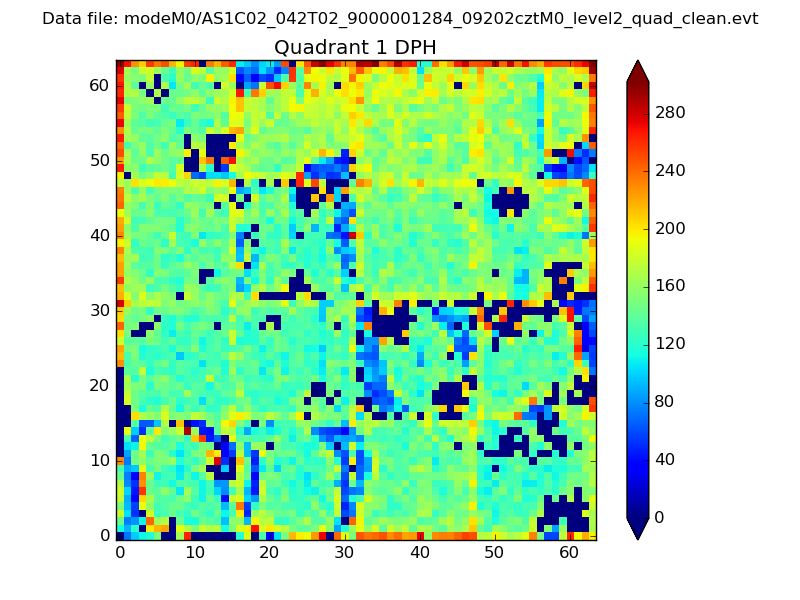 |
Quadrant B |
|---|---|---|---|
| Quadrant D | 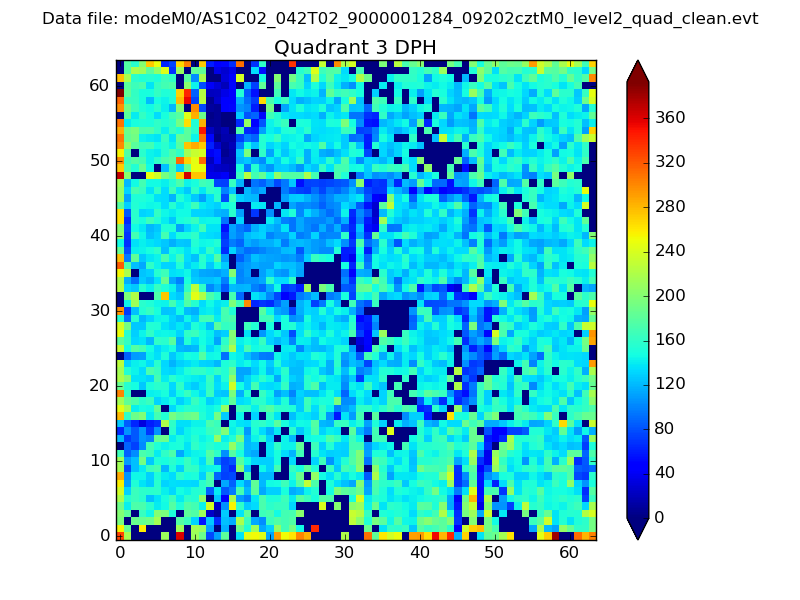 |
 |
Quadrant C |
| Plot type | Count rate plots | Images |
|---|---|---|
| Comparison with Poisson distribution Blue bars denote a histogram of data divided into 1 sec bins. Red curve is a Poisson curve with rate = median count rate of data. |
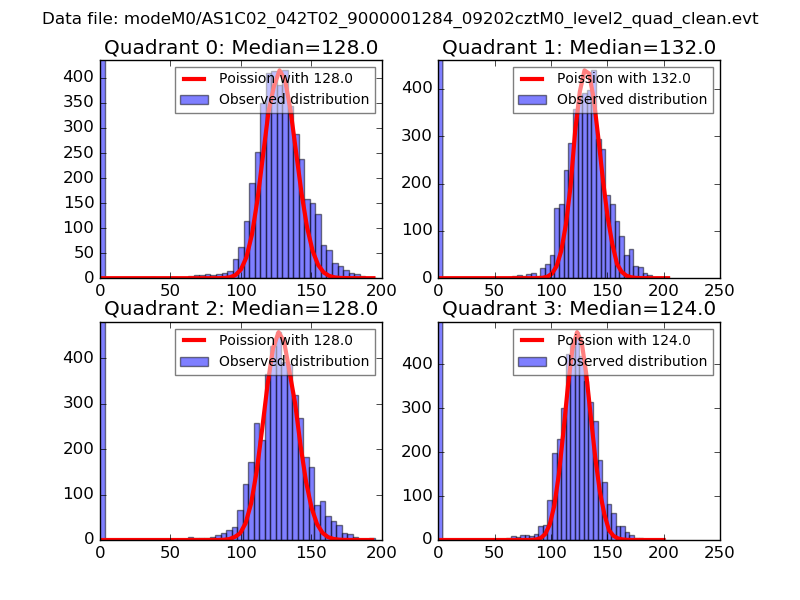 |
 |
| Quadrant-wise count rates Data is divided into 100 sec bins |
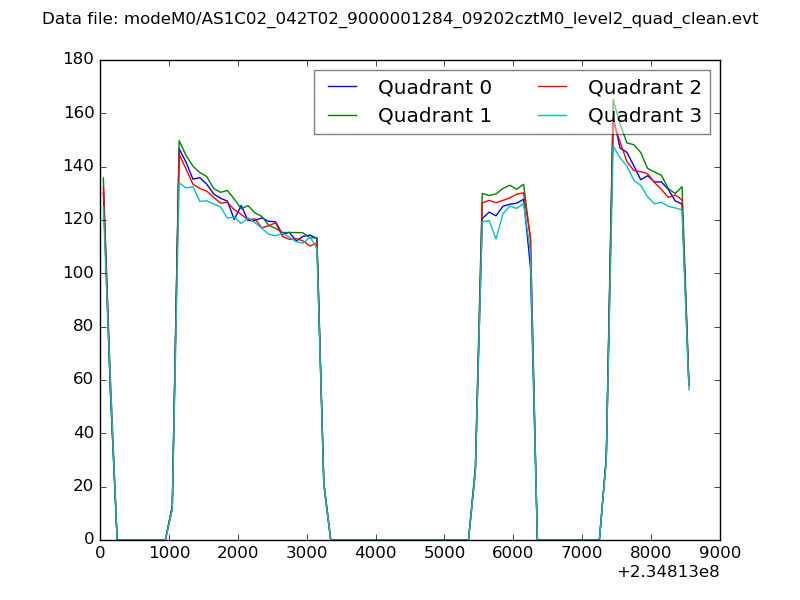 |
|
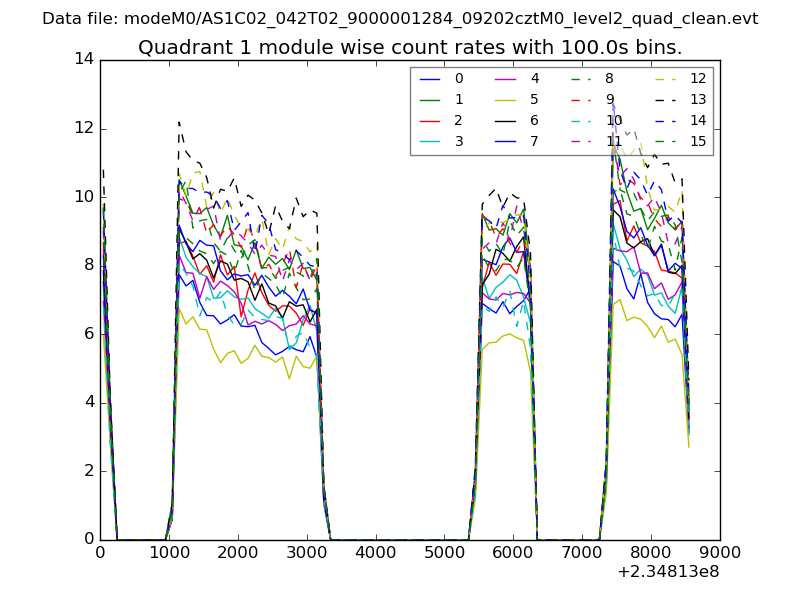
| Module-wise count rates for Quadrant A Data is divided into 100 sec bins |
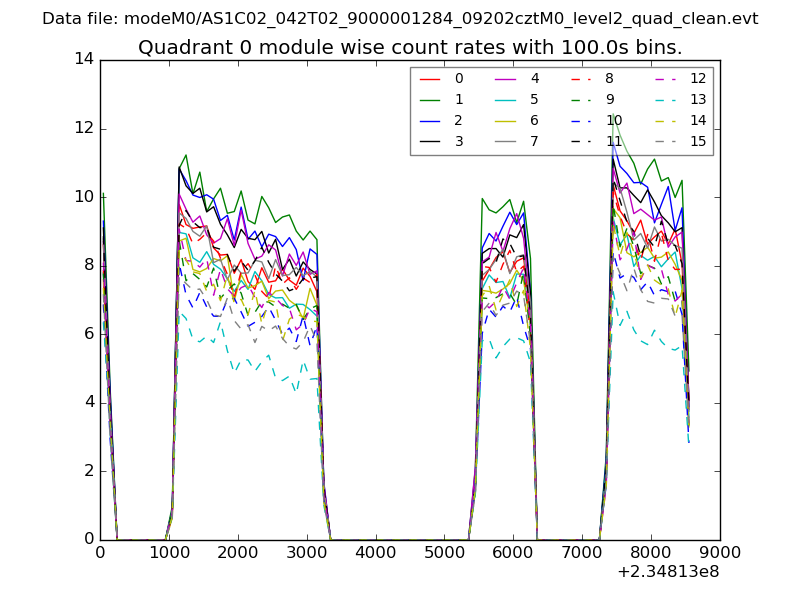 |
 |
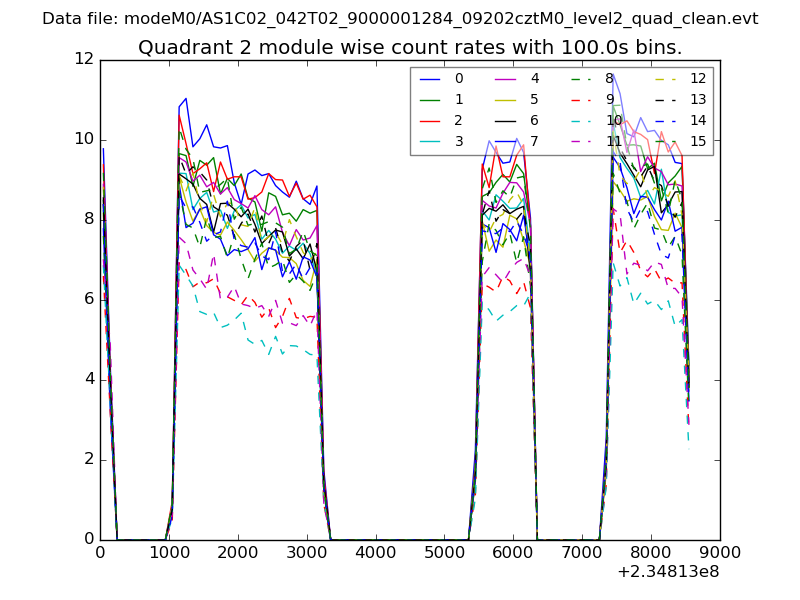
| Module-wise count rates for Quadrant B Data is divided into 100 sec bins |
 |
 |
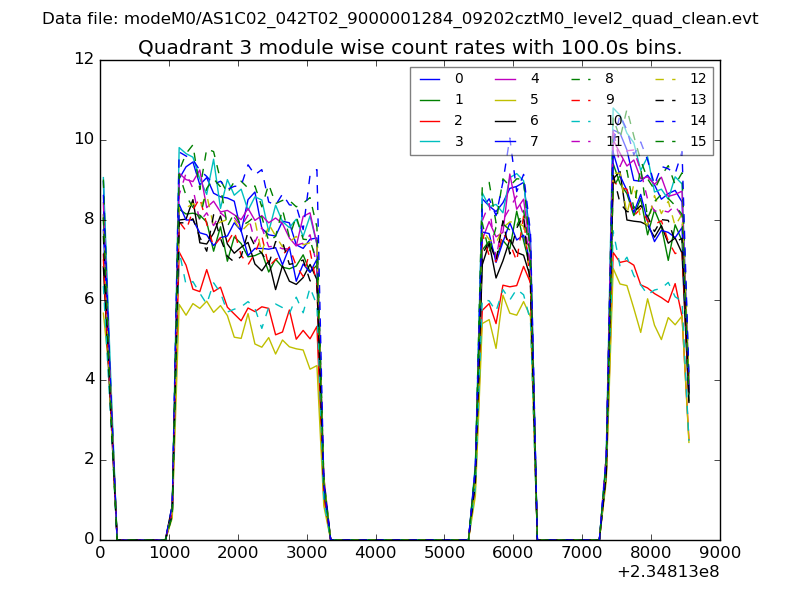
| Module-wise count rates for Quadrant C Data is divided into 100 sec bins |
 |
 |
| Module-wise count rates for Quadrant D Data is divided into 100 sec bins |
 |
 |
| Parameter | Plot |
|---|---|
| CZT HV Monitor | 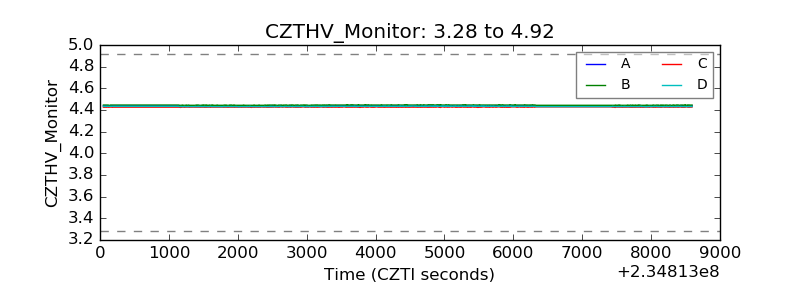 |
| D_VDD | 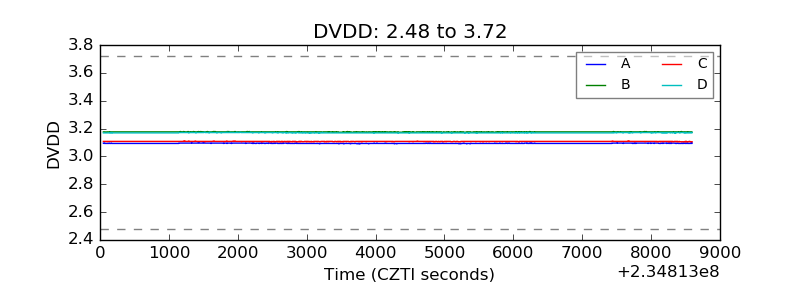 |
| Temperature 1 | 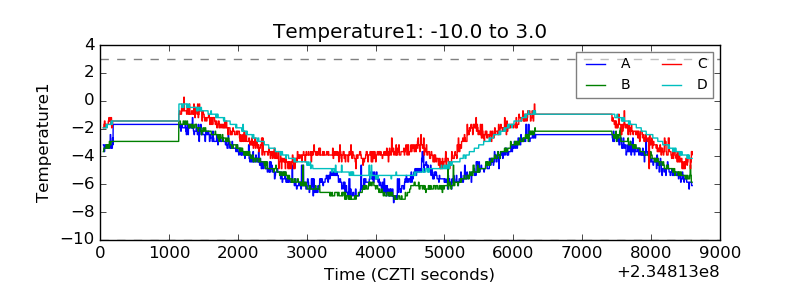 |
| Veto HV Monitor |  |
| Veto LLD | 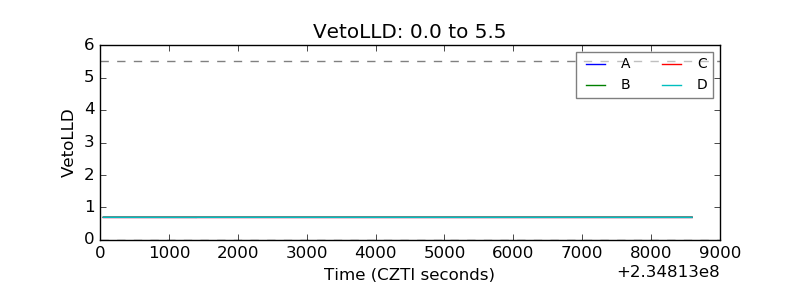 |
| Alpha Counter | 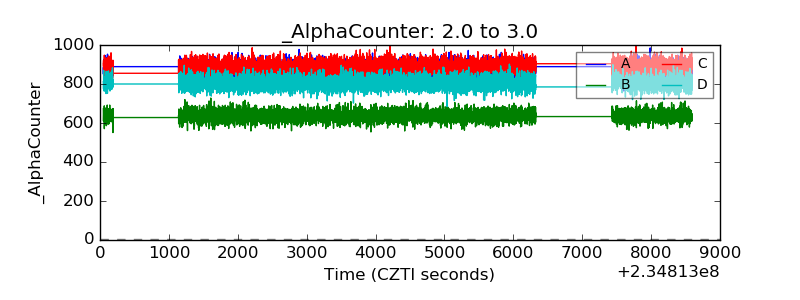 |
| _CPM_Rate | 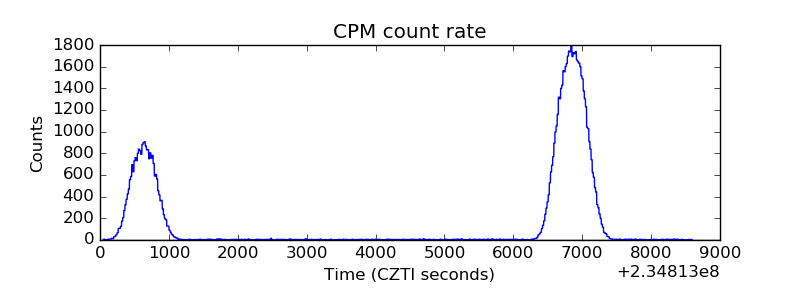 |
| CZT Counter |  |
| +2.5 Volts monitor |  |
| +5 Volts monitor |  |
| _ROLL_ROT | 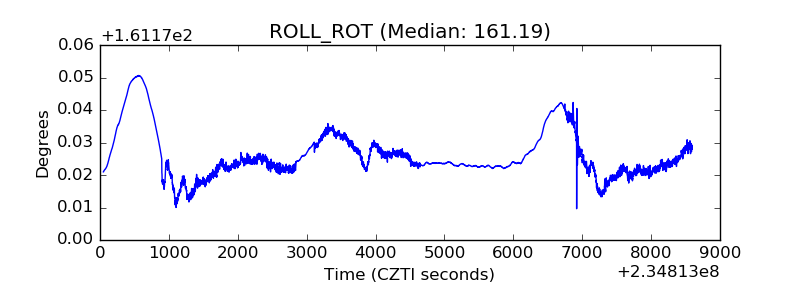 |
| _Roll_DEC | 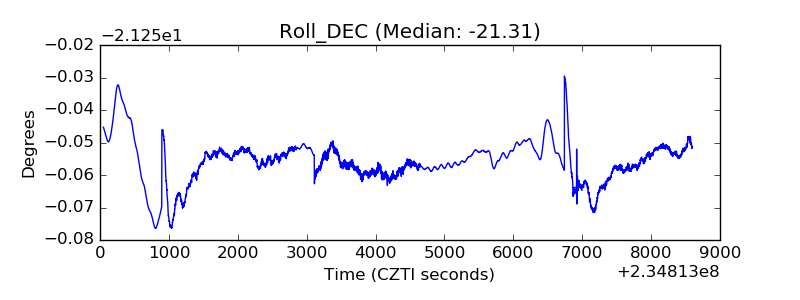 |
| _Roll_RA | 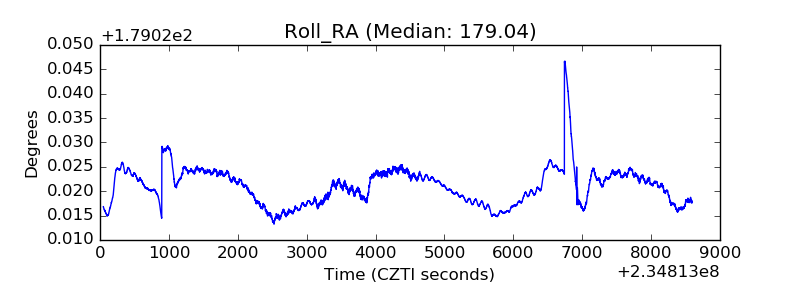 |
| Veto Counter | 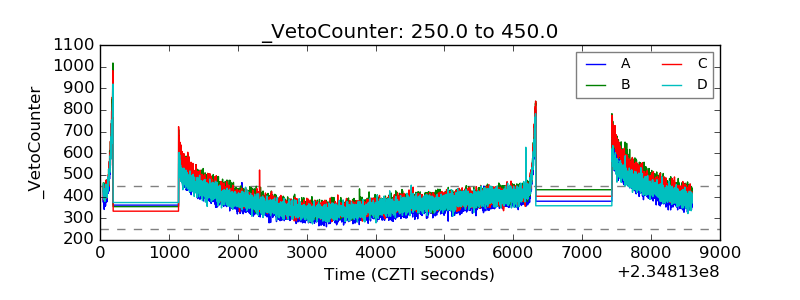 |