| Param | Original file | Final file |
|---|---|---|
| Filename | modeM0/AS1C02_042T02_9000001284_09203cztM0_level2.evt | modeM0/AS1C02_042T02_9000001284_09203cztM0_level2_quad_clean.evt |
| Size (bytes) | 478,523,520 | 91,051,200 |
| Size | 456.4 MB | 86.8 MB |
| Events in quadrant A | 3,993,082 | 578,507 |
| Events in quadrant B | 3,419,813 | 595,258 |
| Events in quadrant C | 3,086,932 | 577,122 |
| Events in quadrant D | 3,550,939 | 553,102 |
| Mode M9 | |||
|---|---|---|---|
| Quadrant | BADHDUFLAG | Total packets | Discarded packets |
| A | 0 | 23 | 0 |
| B | 0 | 23 | 0 |
| C | 0 | 23 | 0 |
| D | 0 | 23 | 0 |
| Mode SS | |||
|---|---|---|---|
| Quadrant | BADHDUFLAG | Total packets | Discarded packets |
| A | 0 | 134 | 0 |
| B | 0 | 134 | 0 |
| C | 0 | 134 | 0 |
| D | 0 | 134 | 0 |
| Mode M0 | |||
|---|---|---|---|
| Quadrant | BADHDUFLAG | Total packets | Discarded packets |
| A | 0 | 15968 | 7 |
| B | 0 | 14297 | 8 |
| C | 0 | 13444 | 2 |
| D | 0 | 14977 | 2 |
| Quadrant | Total seconds | Saturated seconds | Saturation percentage |
|---|---|---|---|
| A | 6500 | 94 | 1.446154% |
| B | 6500 | 62 | 0.953846% |
| C | 6501 | 31 | 0.476850% |
| D | 6501 | 102 | 1.568989% |
Noise dominated data is calculated using 1-second bins in cleaned event files. If a bin has >2000 counts, and if more than 50% of those come from <1% of pixels, then it is considered to be noise-dominated and hence unusable.
| Quadrant | # 1 sec bins | Bins with >0 counts | Bins with >2000 counts | High rate bins dominated by noise | Noise dominated (total time) | Noise dominated (detector-on time) | Marked lightcurve |
|---|---|---|---|---|---|---|---|
| A | 8820 | 6500 | 21 | 21 | 0.24% | 0.32% | 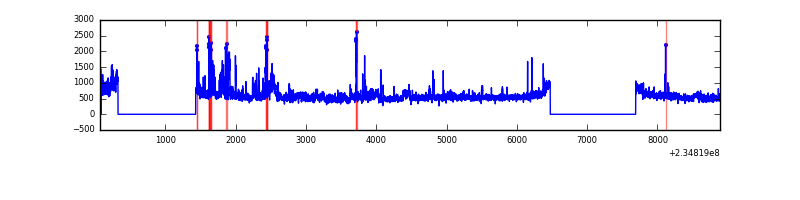 |
| B | 8820 | 6500 | 6 | 6 | 0.07% | 0.09% | 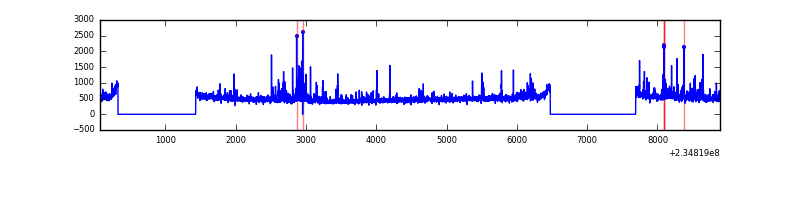 |
| C | 8820 | 6500 | 0 | 0 | 0.00% | 0.00% | 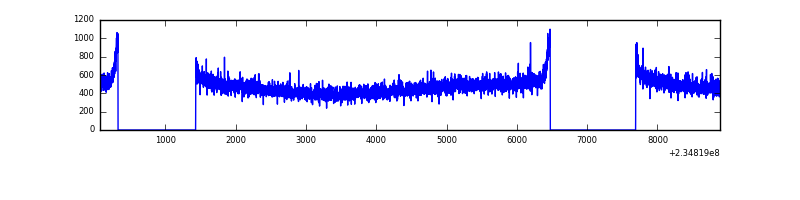 |
| D | 8820 | 6500 | 99 | 99 | 1.12% | 1.52% | 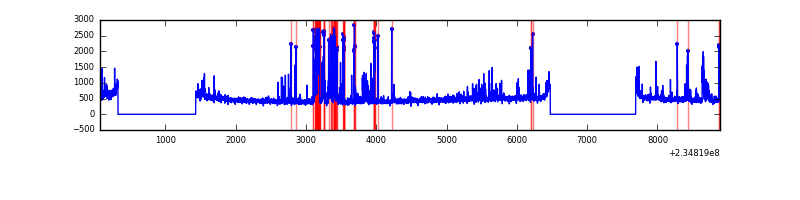 |
Top three noisy pixels from each quadrant. If the there are fewer than three noisy pixels in the level2.evt file, extra rows are filled as -1
| Pixel properties | Quadrant properties | ||||||
|---|---|---|---|---|---|---|---|
| Quadrant | DetID | PixID | Counts | Sigma | Mean | Median | Sigma |
| A | 8 | 5 | 705756 | 4311.25 | 799 | 784 | 163.5 |
| A | 1 | 162 | 123575 | 750.93 | 799 | 784 | 163.5 |
| A | 1 | 178 | 25173 | 149.15 | 799 | 784 | 163.5 |
| B | 4 | 48 | 156724 | 998.98 | 809 | 789 | 156.1 |
| B | 0 | 187 | 24643 | 152.82 | 809 | 789 | 156.1 |
| B | 0 | 245 | 23220 | 143.7 | 809 | 789 | 156.1 |
| C | 3 | 233 | 63226 | 346.67 | 774 | 779 | 180.1 |
| C | 13 | 61 | 5901 | 28.43 | 774 | 779 | 180.1 |
| C | 8 | 222 | 2817 | 11.31 | 774 | 779 | 180.1 |
| D | 4 | 95 | 326015 | 1624.18 | 764 | 745 | 200.3 |
| D | 1 | 52 | 136823 | 679.48 | 764 | 745 | 200.3 |
| D | 7 | 71 | 80398 | 397.73 | 764 | 745 | 200.3 |
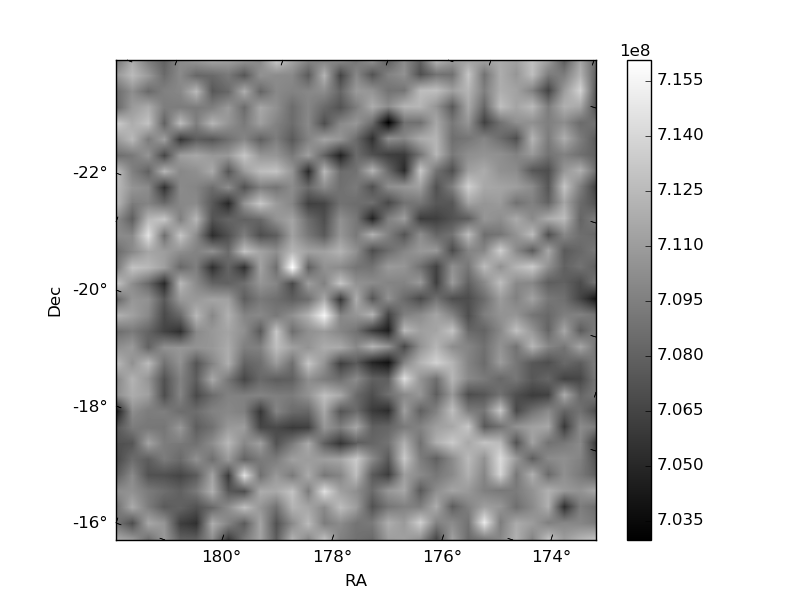
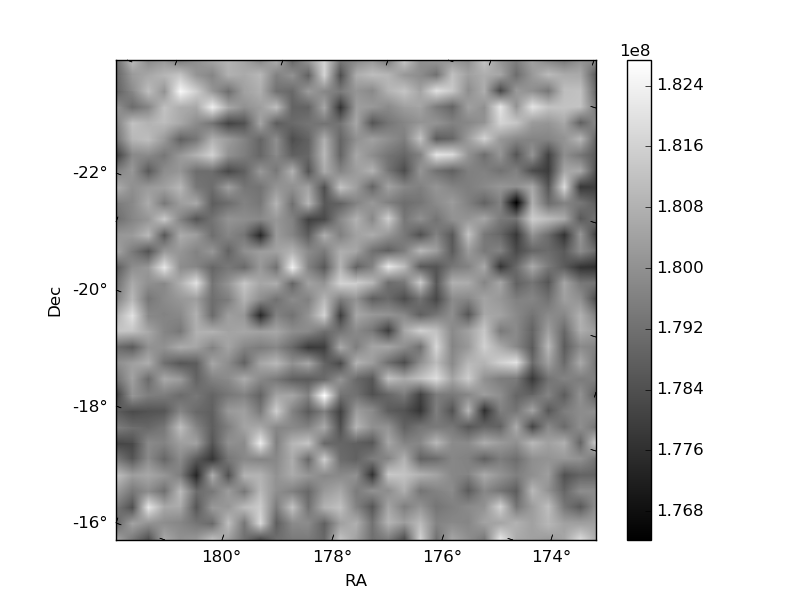
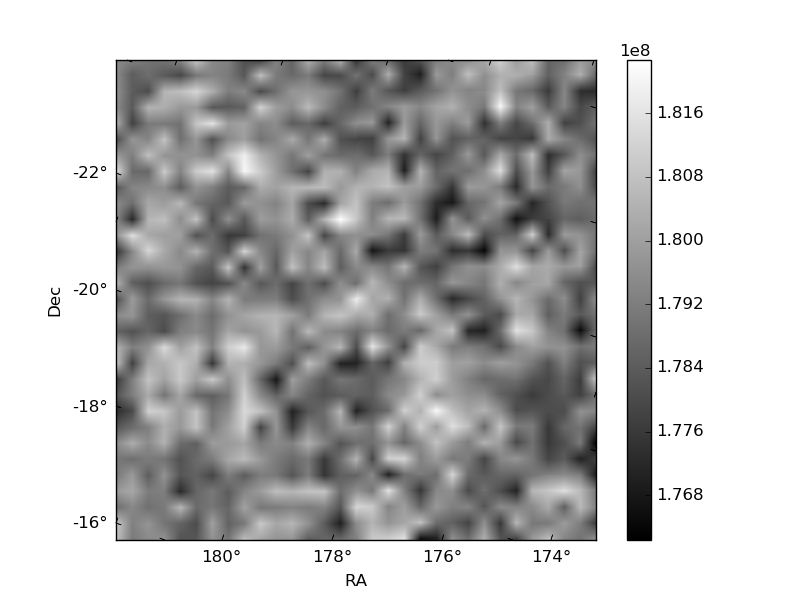
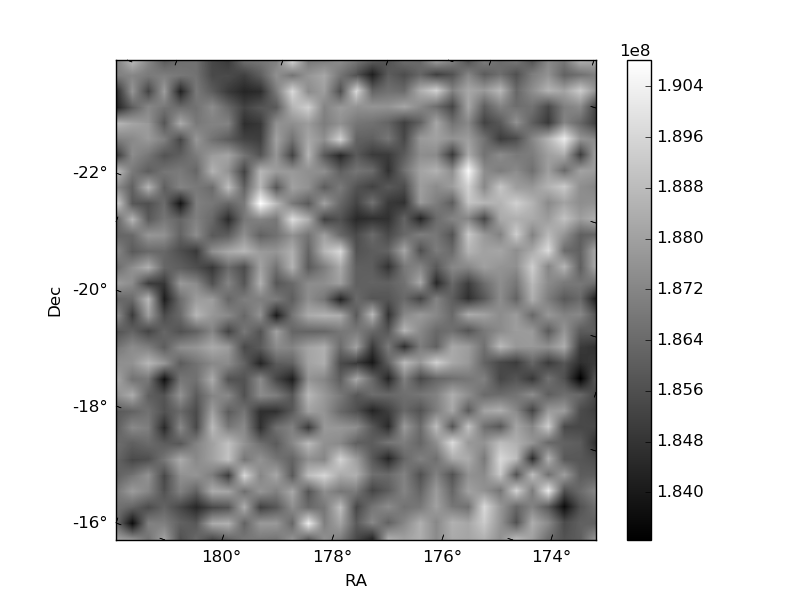
Histogram calculated using DETX and DETY for each event in the final _common_clean file
| Quadrant A | 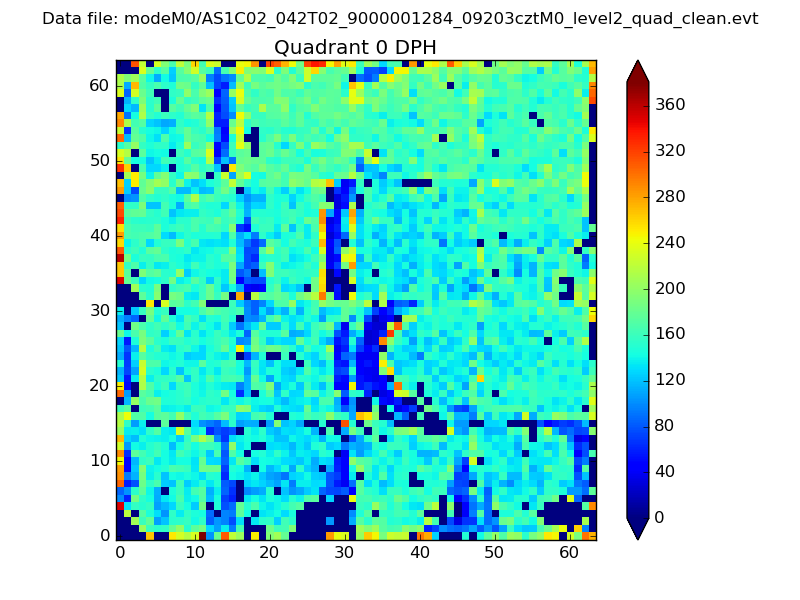 |
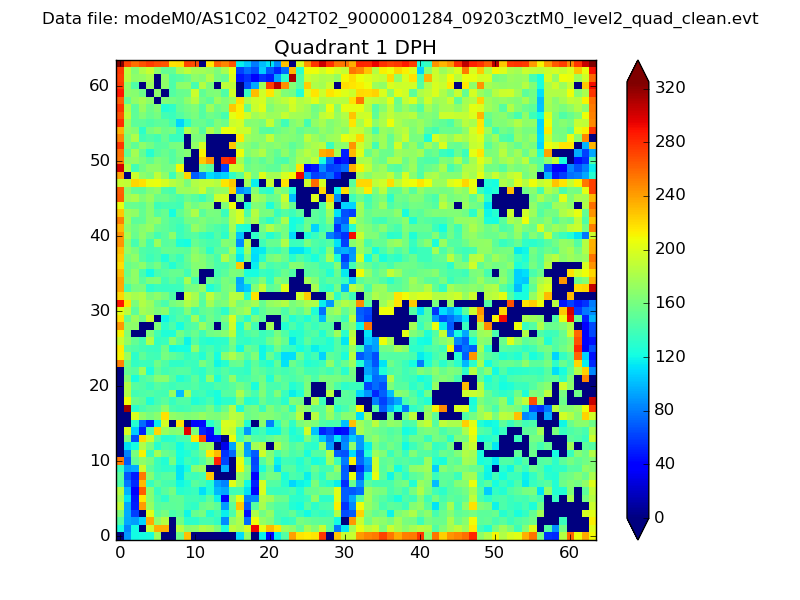 |
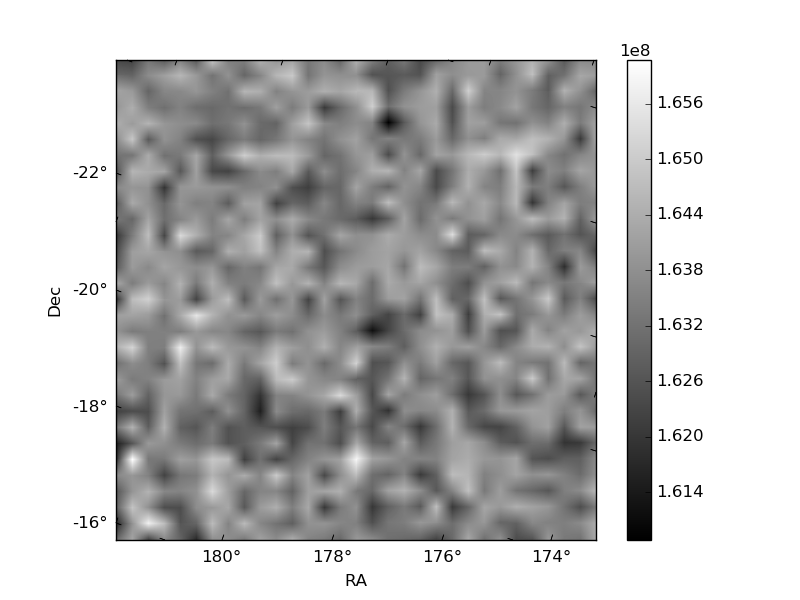
Quadrant B |
|---|---|---|---|
| Quadrant D |  |
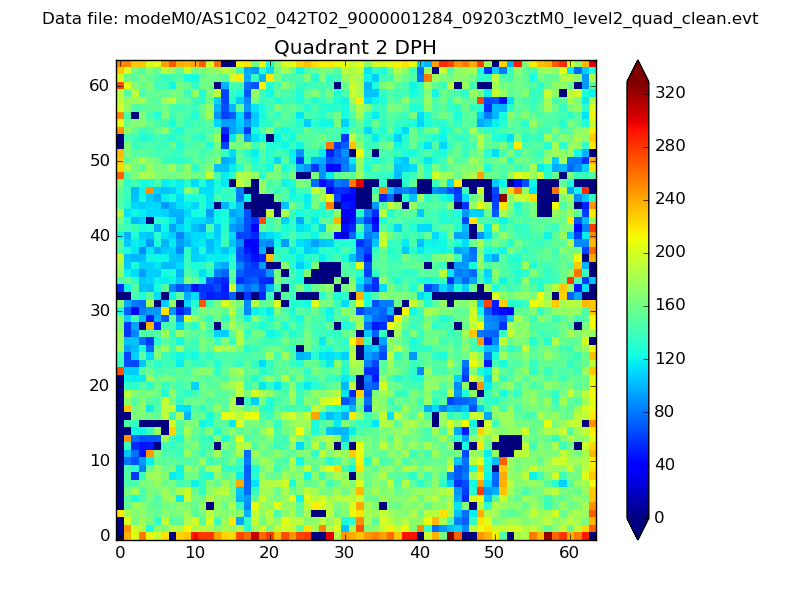 |
Quadrant C |
| Plot type | Count rate plots | Images |
|---|---|---|
| Comparison with Poisson distribution Blue bars denote a histogram of data divided into 1 sec bins. Red curve is a Poisson curve with rate = median count rate of data. |
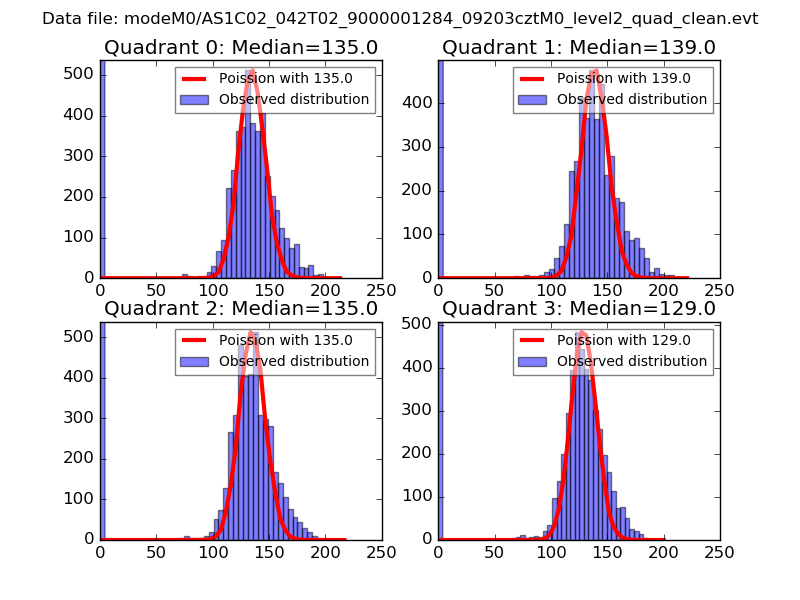 |
 |
| Quadrant-wise count rates Data is divided into 100 sec bins |
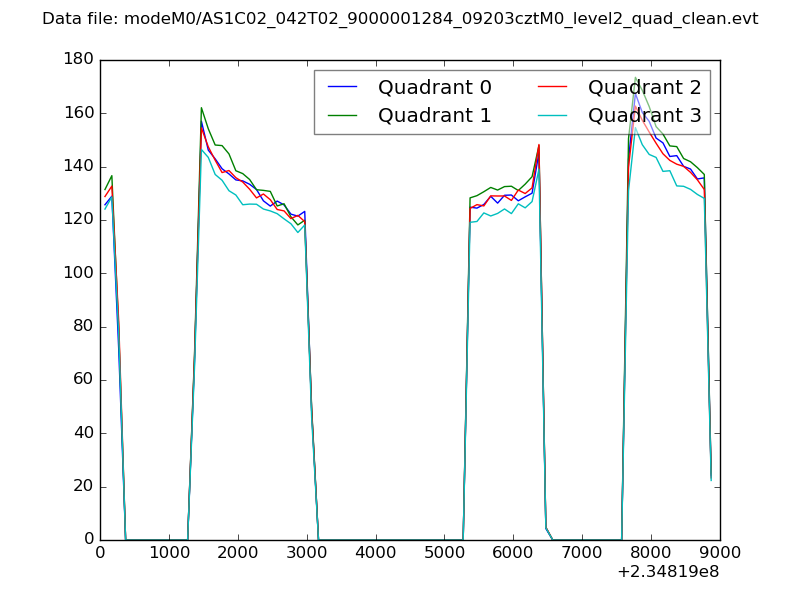 |
|
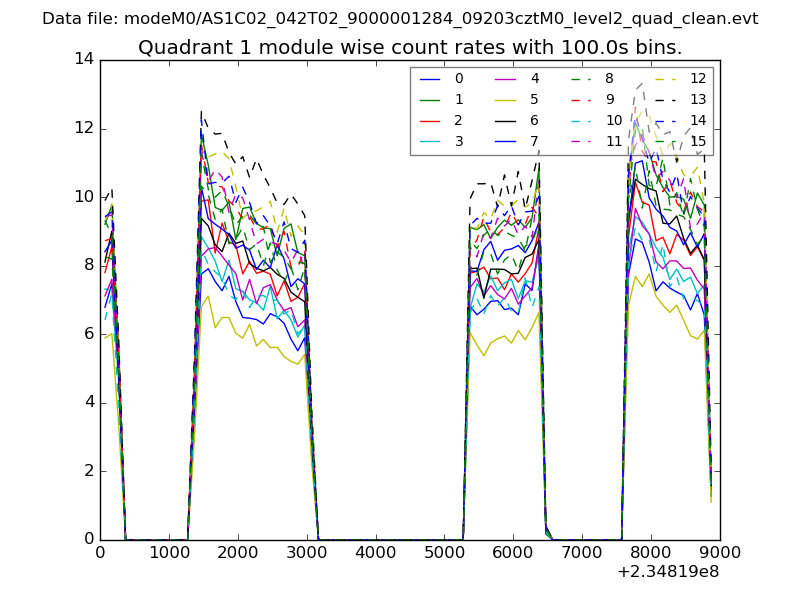
| Module-wise count rates for Quadrant A Data is divided into 100 sec bins |
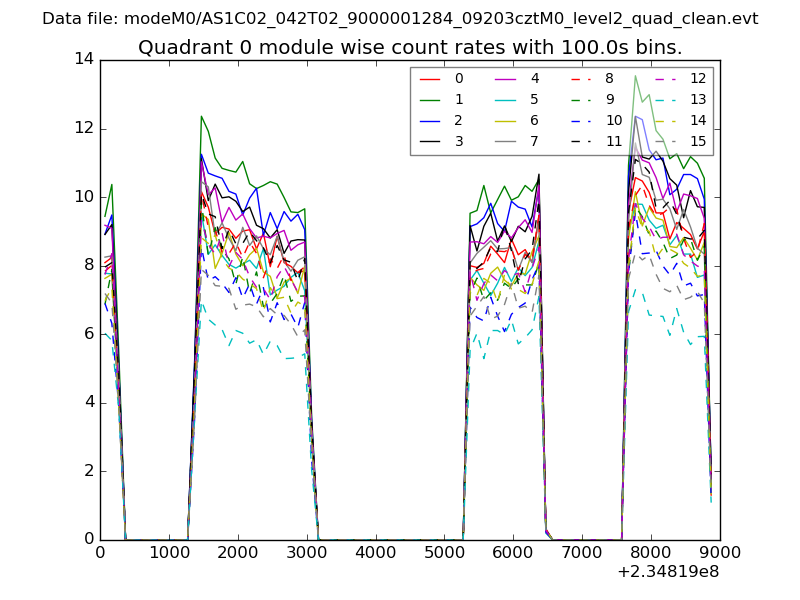 |
 |
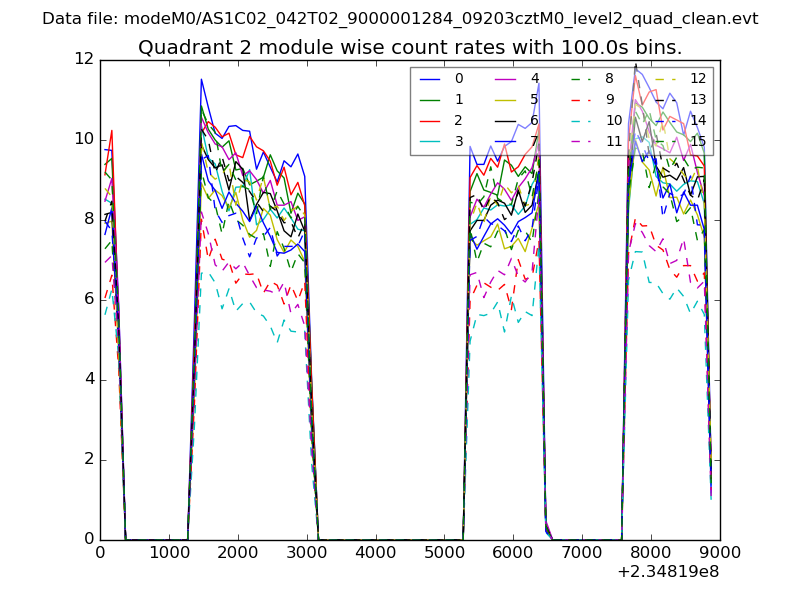
| Module-wise count rates for Quadrant B Data is divided into 100 sec bins |
 |
 |
| Module-wise count rates for Quadrant C Data is divided into 100 sec bins |
 |
 |
| Module-wise count rates for Quadrant D Data is divided into 100 sec bins |
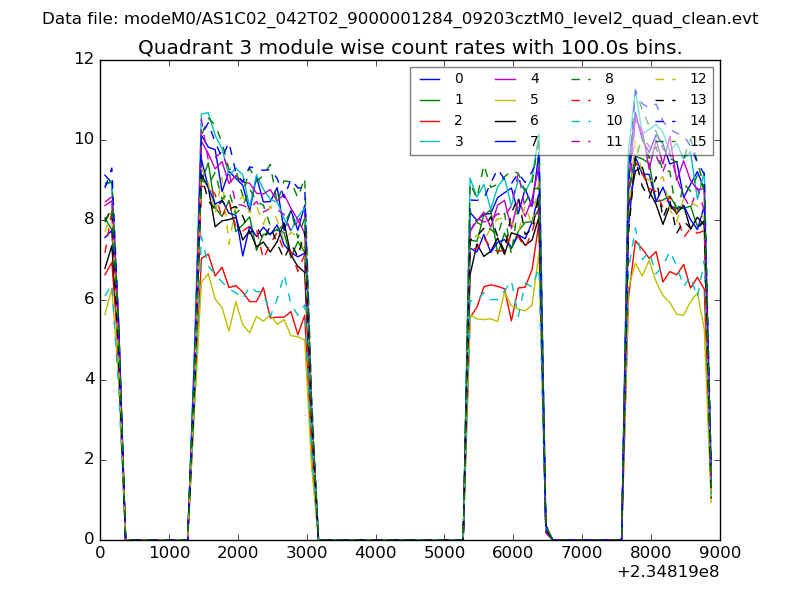 |
 |
| Parameter | Plot |
|---|---|
| CZT HV Monitor | 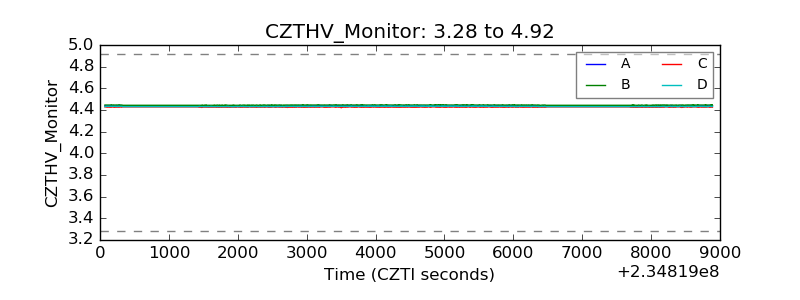 |
| D_VDD | 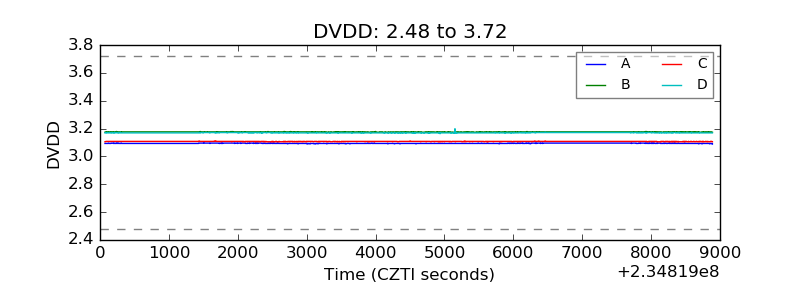 |
| Temperature 1 | 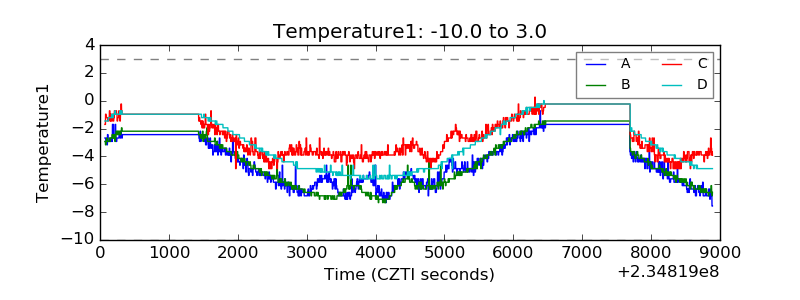 |
| Veto HV Monitor | 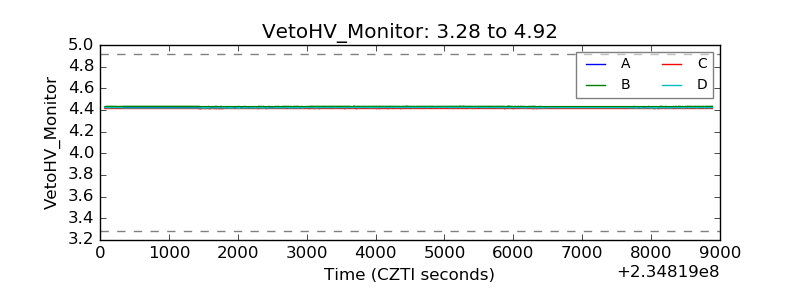 |
| Veto LLD | 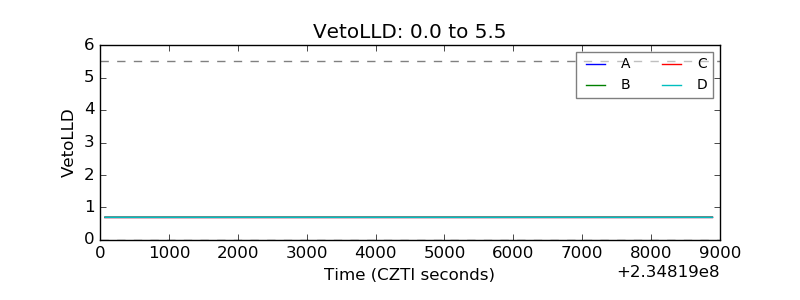 |
| Alpha Counter | 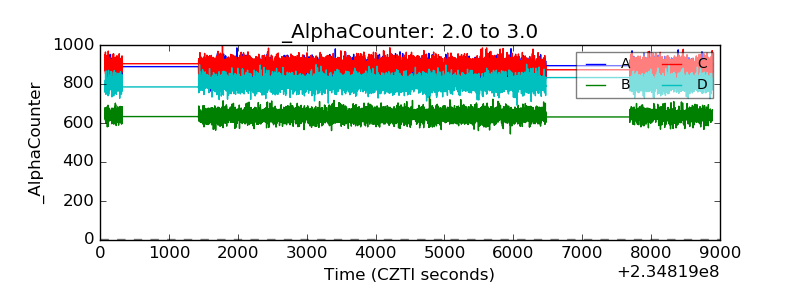 |
| _CPM_Rate | 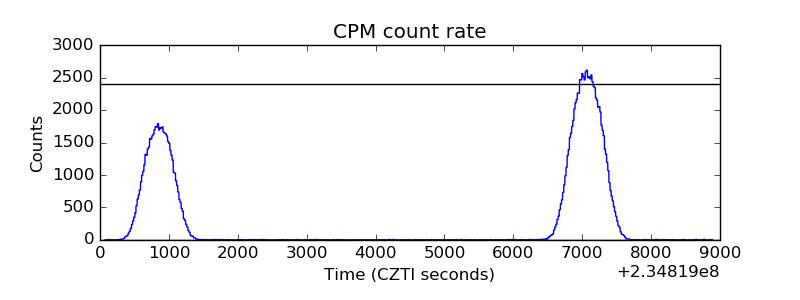 |
| CZT Counter |  |
| +2.5 Volts monitor |  |
| +5 Volts monitor |  |
| _ROLL_ROT | 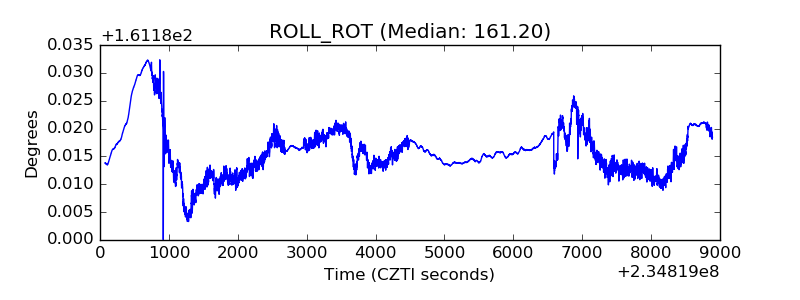 |
| _Roll_DEC | 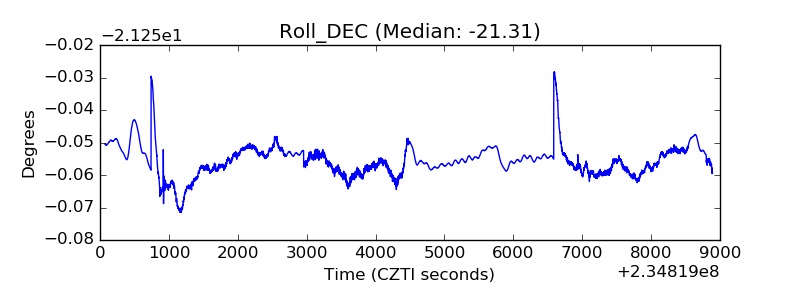 |
| _Roll_RA | 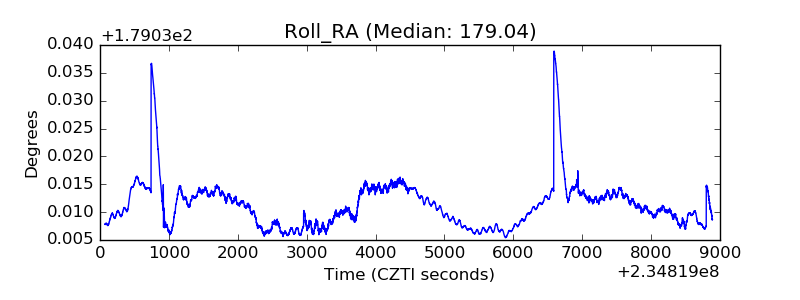 |
| Veto Counter | 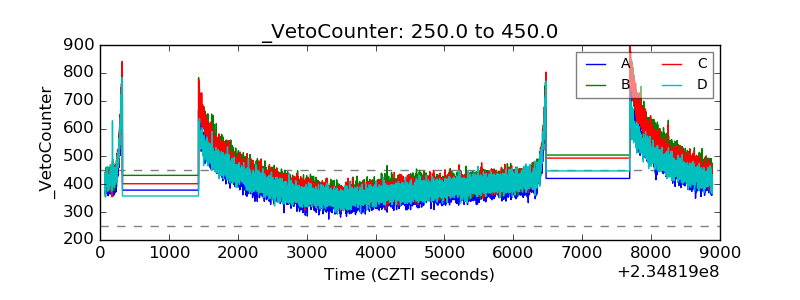 |