| Param | Original file | Final file |
|---|---|---|
| Filename | modeM0/AS1C02_042T02_9000001284_09204cztM0_level2.evt | modeM0/AS1C02_042T02_9000001284_09204cztM0_level2_quad_clean.evt |
| Size (bytes) | 450,080,640 | 80,910,720 |
| Size | 429.2 MB | 77.2 MB |
| Events in quadrant A | 3,429,321 | 511,307 |
| Events in quadrant B | 3,578,310 | 521,610 |
| Events in quadrant C | 3,018,877 | 505,757 |
| Events in quadrant D | 3,186,438 | 482,118 |
| Mode M9 | |||
|---|---|---|---|
| Quadrant | BADHDUFLAG | Total packets | Discarded packets |
| A | 0 | 19 | 0 |
| B | 0 | 19 | 0 |
| C | 0 | 19 | 0 |
| D | 0 | 20 | 0 |
| Mode SS | |||
|---|---|---|---|
| Quadrant | BADHDUFLAG | Total packets | Discarded packets |
| A | 0 | 126 | 0 |
| B | 0 | 126 | 0 |
| C | 0 | 126 | 0 |
| D | 0 | 126 | 0 |
| Mode M0 | |||
|---|---|---|---|
| Quadrant | BADHDUFLAG | Total packets | Discarded packets |
| A | 0 | 14011 | 3 |
| B | 0 | 14477 | 9 |
| C | 0 | 12761 | 7 |
| D | 0 | 13494 | 4 |
| Quadrant | Total seconds | Saturated seconds | Saturation percentage |
|---|---|---|---|
| A | 6148 | 38 | 0.618087% |
| B | 6144 | 182 | 2.962240% |
| C | 6146 | 13 | 0.211520% |
| D | 6147 | 31 | 0.504311% |
Noise dominated data is calculated using 1-second bins in cleaned event files. If a bin has >2000 counts, and if more than 50% of those come from <1% of pixels, then it is considered to be noise-dominated and hence unusable.
| Quadrant | # 1 sec bins | Bins with >0 counts | Bins with >2000 counts | High rate bins dominated by noise | Noise dominated (total time) | Noise dominated (detector-on time) | Marked lightcurve |
|---|---|---|---|---|---|---|---|
| A | 7467 | 6147 | 8 | 8 | 0.11% | 0.13% | 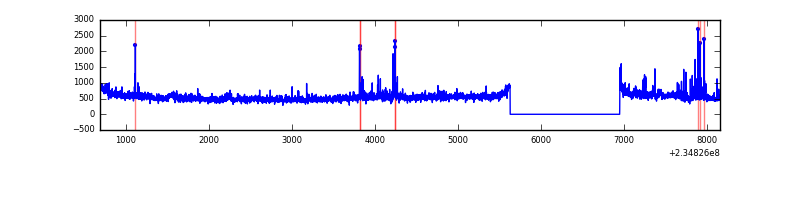 |
| B | 7467 | 6145 | 91 | 91 | 1.22% | 1.48% | 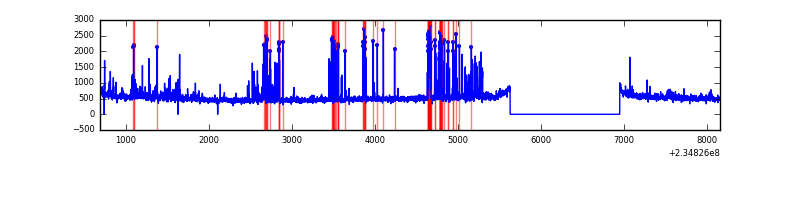 |
| C | 7467 | 6148 | 2 | 2 | 0.03% | 0.03% | 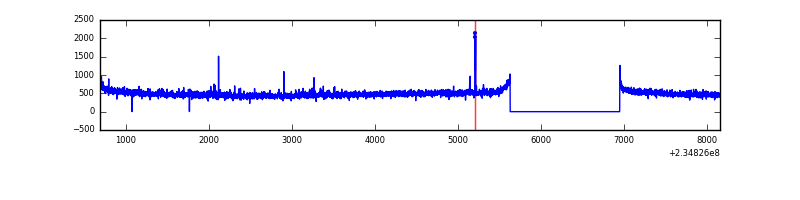 |
| D | 7467 | 6147 | 38 | 38 | 0.51% | 0.62% | 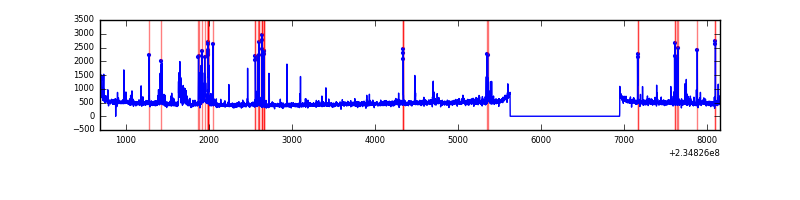 |
Top three noisy pixels from each quadrant. If the there are fewer than three noisy pixels in the level2.evt file, extra rows are filled as -1
| Pixel properties | Quadrant properties | ||||||
|---|---|---|---|---|---|---|---|
| Quadrant | DetID | PixID | Counts | Sigma | Mean | Median | Sigma |
| A | 8 | 5 | 260968 | 1647.52 | 773 | 760 | 157.9 |
| A | 1 | 162 | 106633 | 670.34 | 773 | 760 | 157.9 |
| A | 1 | 178 | 22805 | 139.58 | 773 | 760 | 157.9 |
| B | 10 | 252 | 434680 | 2939.98 | 775 | 758 | 147.6 |
| B | 4 | 48 | 66339 | 444.34 | 775 | 758 | 147.6 |
| B | 0 | 214 | 19887 | 129.61 | 775 | 758 | 147.6 |
| C | 3 | 233 | 114413 | 664.41 | 744 | 749 | 171.1 |
| C | 13 | 61 | 5618 | 28.46 | 744 | 749 | 171.1 |
| C | 12 | 4 | 2682 | 11.3 | 744 | 749 | 171.1 |
| D | 4 | 95 | 207762 | 1069.1 | 734 | 714 | 193.7 |
| D | 7 | 71 | 65250 | 333.23 | 734 | 714 | 193.7 |
| D | 2 | 14 | 39053 | 197.96 | 734 | 714 | 193.7 |
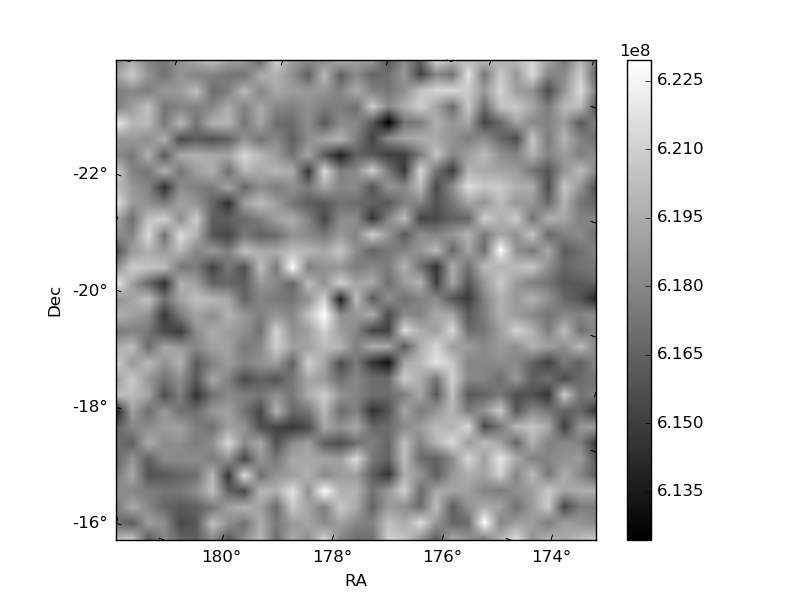
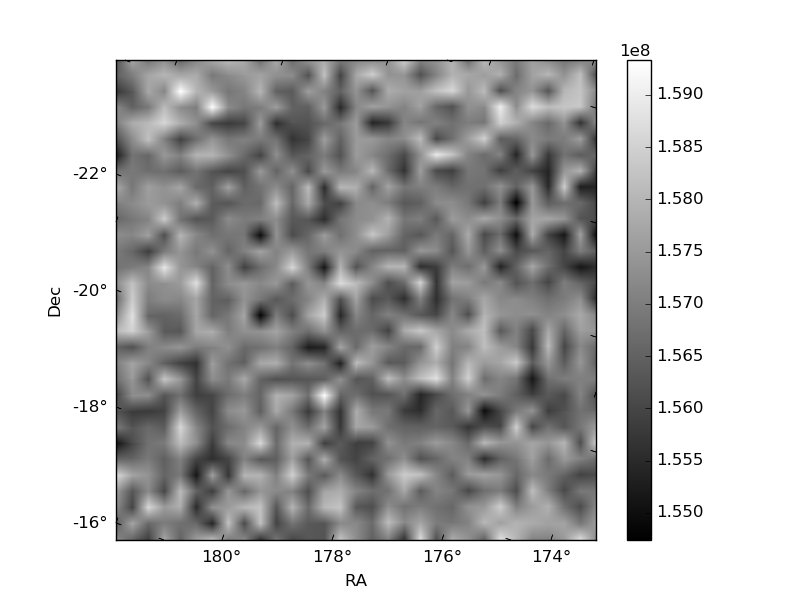
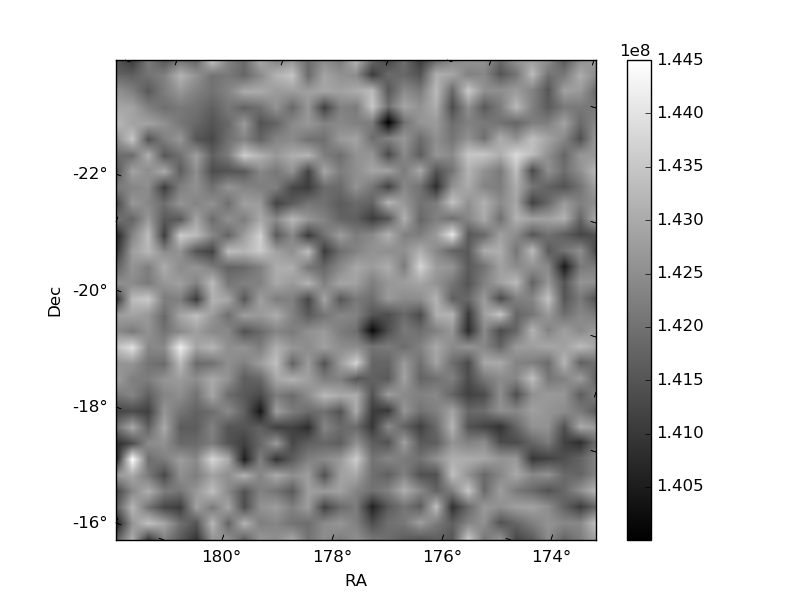
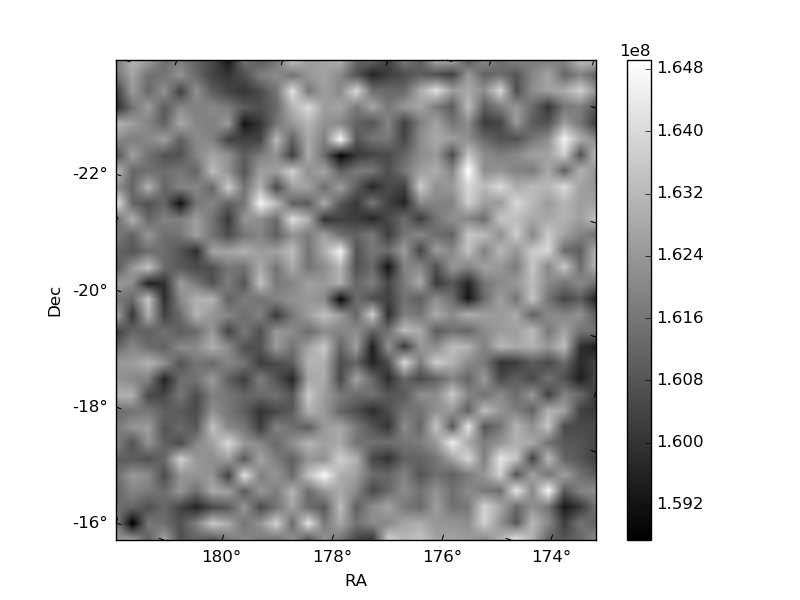
Histogram calculated using DETX and DETY for each event in the final _common_clean file
| Quadrant A | 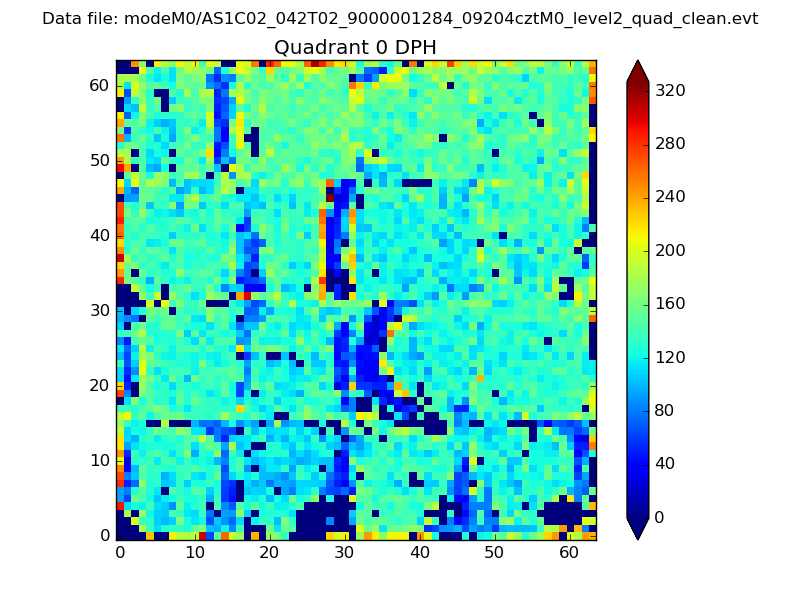 |
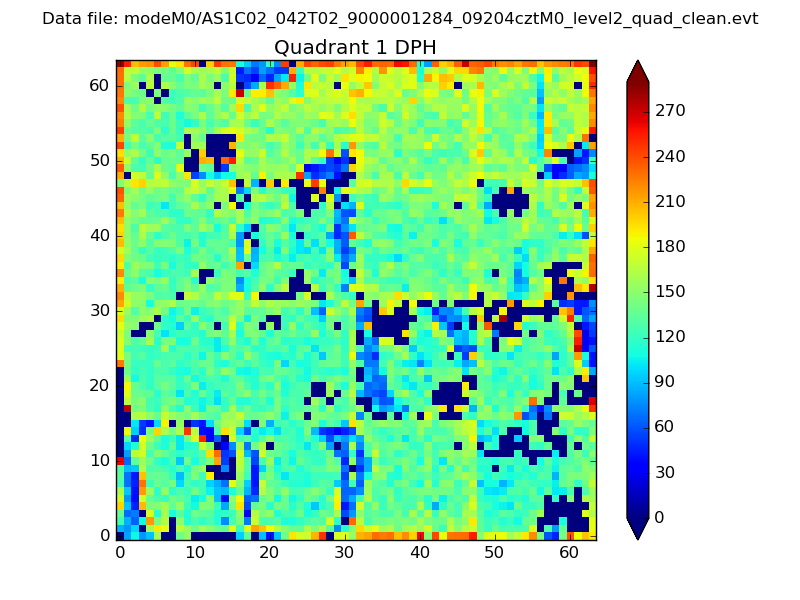 |
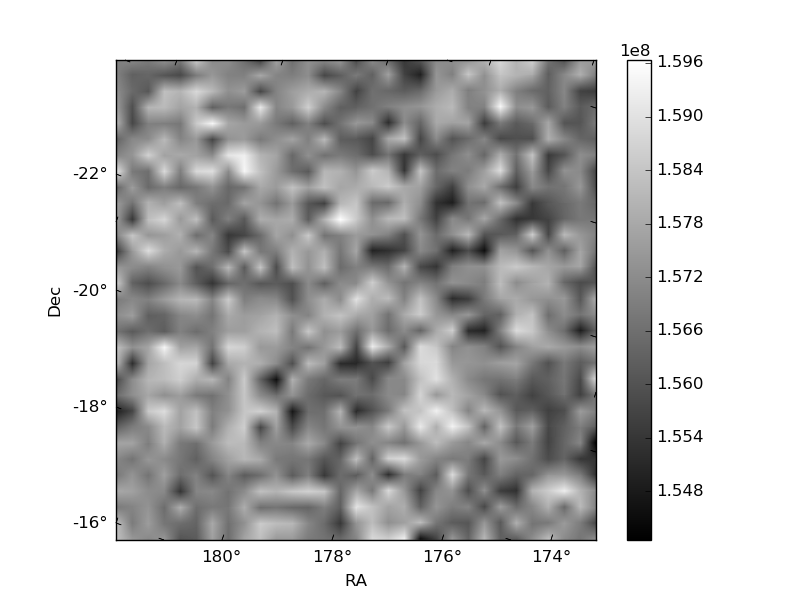
Quadrant B |
|---|---|---|---|
| Quadrant D | 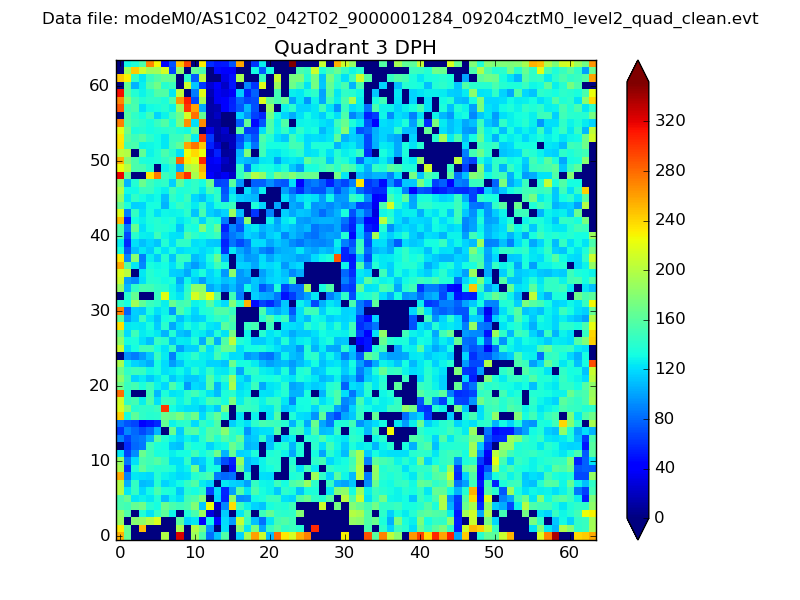 |
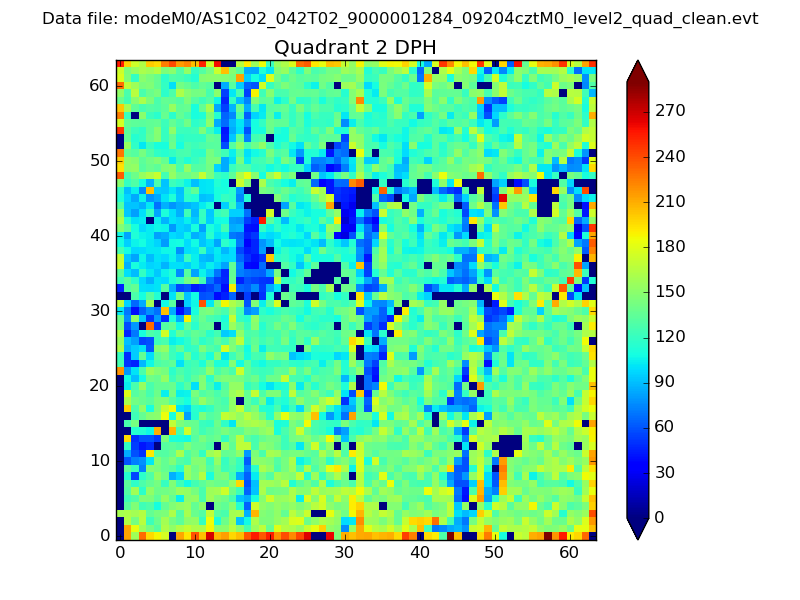 |
Quadrant C |
| Plot type | Count rate plots | Images |
|---|---|---|
| Comparison with Poisson distribution Blue bars denote a histogram of data divided into 1 sec bins. Red curve is a Poisson curve with rate = median count rate of data. |
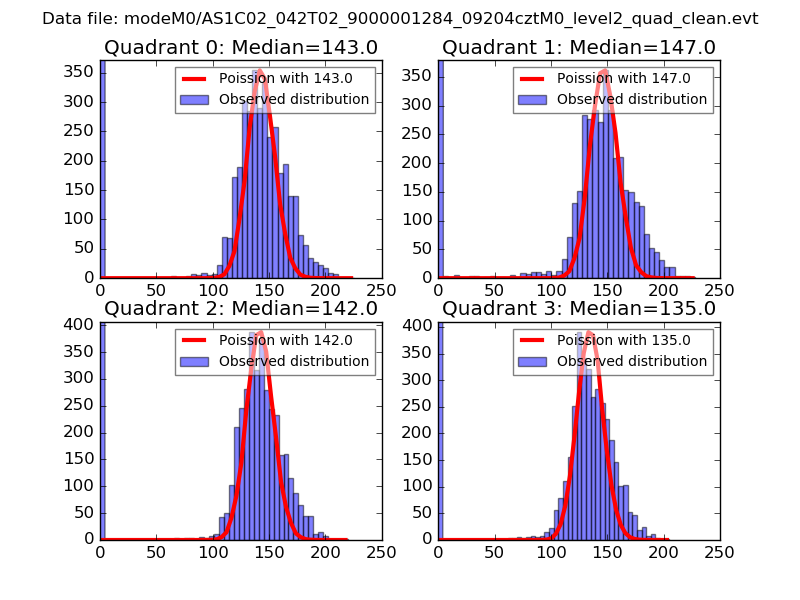 |
 |
| Quadrant-wise count rates Data is divided into 100 sec bins |
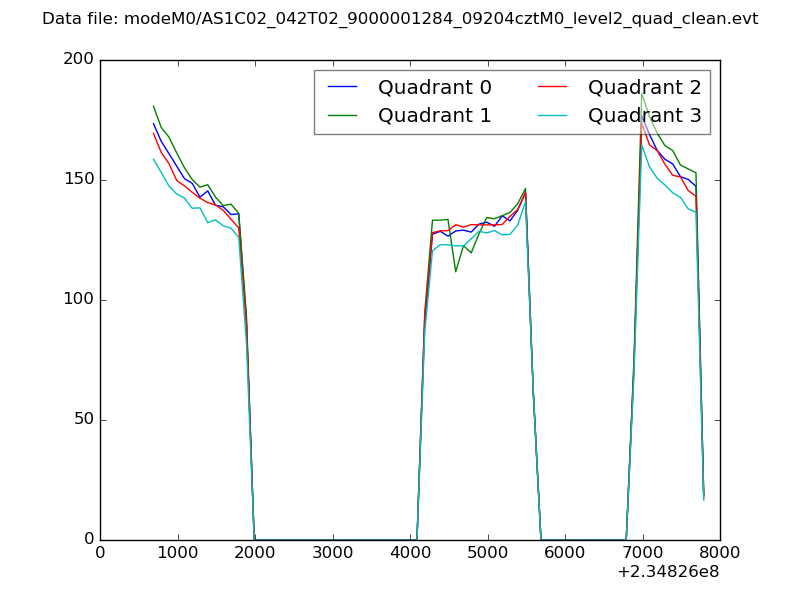 |
|
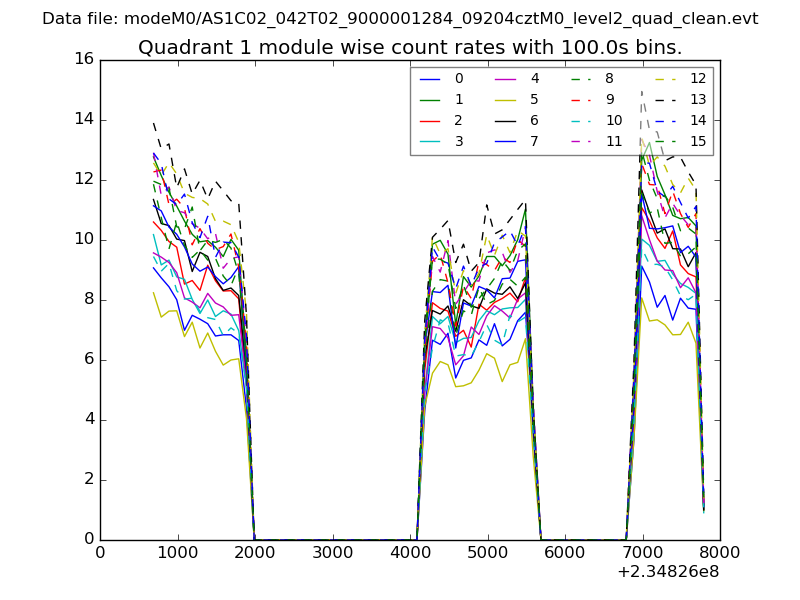
| Module-wise count rates for Quadrant A Data is divided into 100 sec bins |
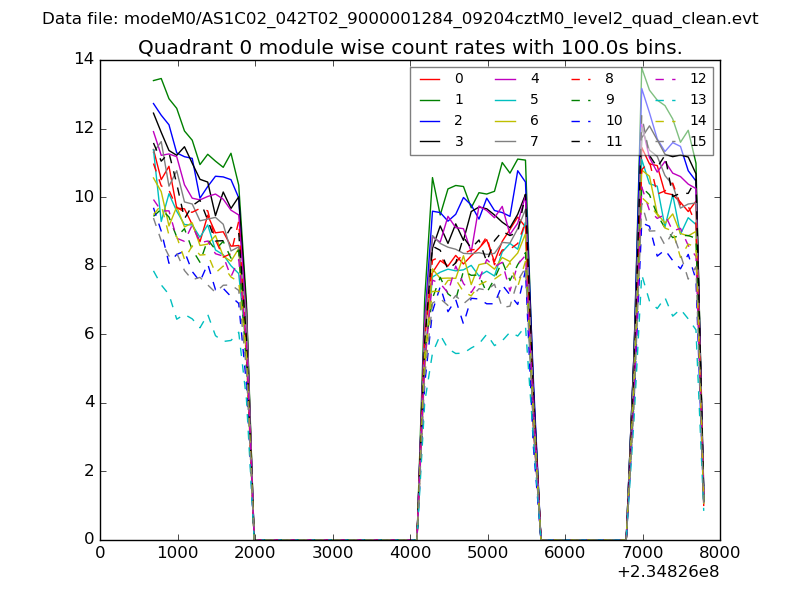 |
 |
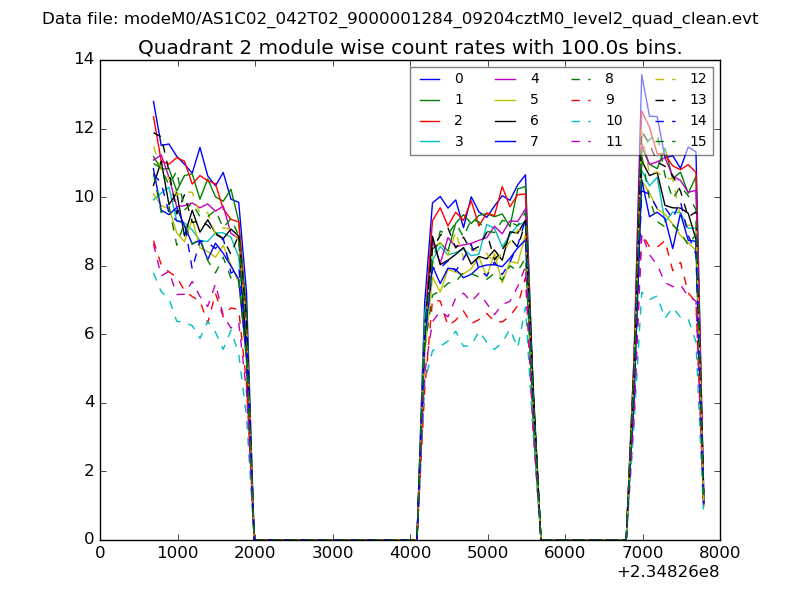
| Module-wise count rates for Quadrant B Data is divided into 100 sec bins |
 |
 |
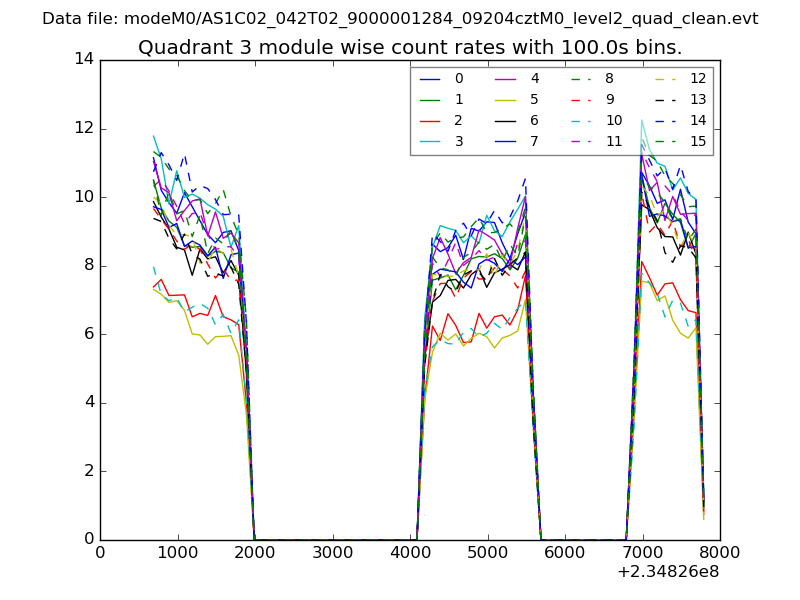
| Module-wise count rates for Quadrant C Data is divided into 100 sec bins |
 |
 |
| Module-wise count rates for Quadrant D Data is divided into 100 sec bins |
 |
 |
| Parameter | Plot |
|---|---|
| CZT HV Monitor | 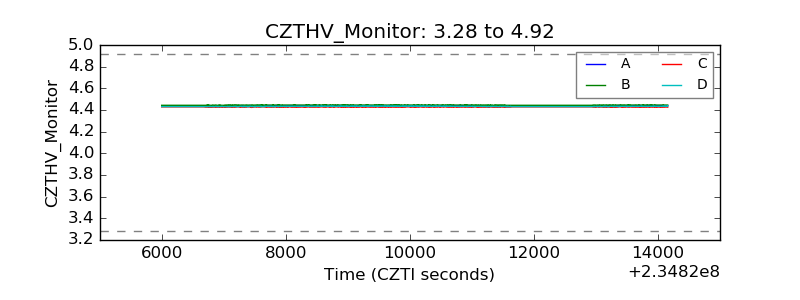 |
| D_VDD | 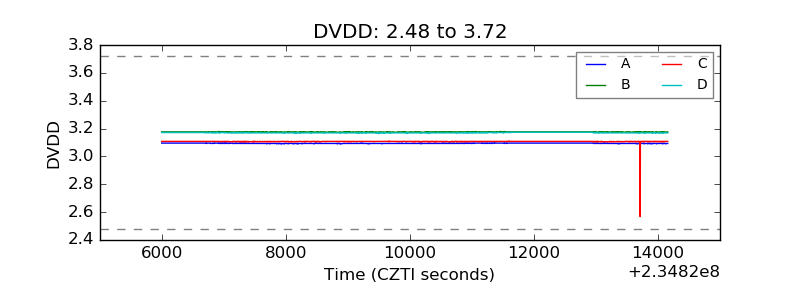 |
| Temperature 1 | 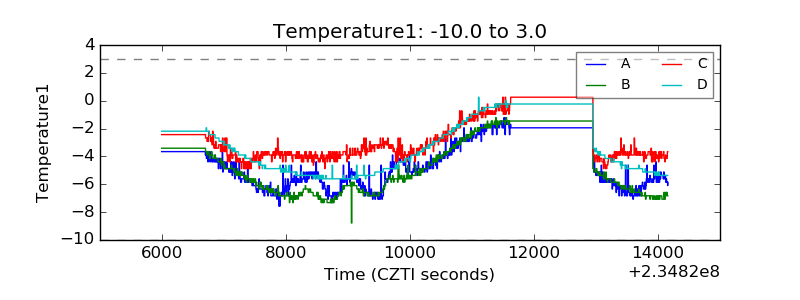 |
| Veto HV Monitor | 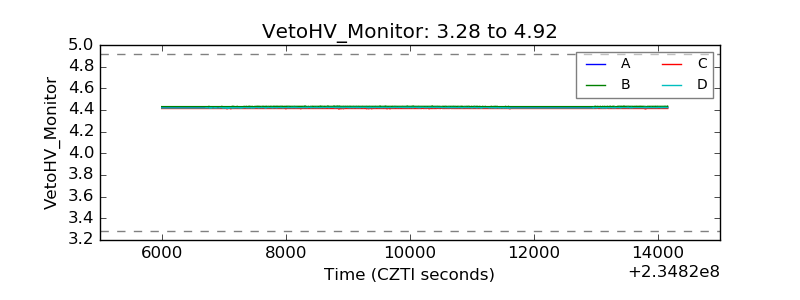 |
| Veto LLD | 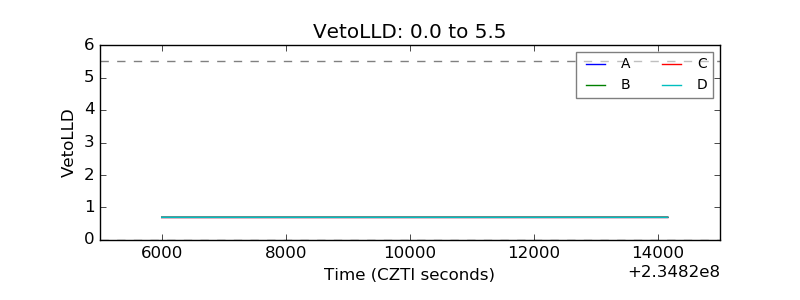 |
| Alpha Counter | 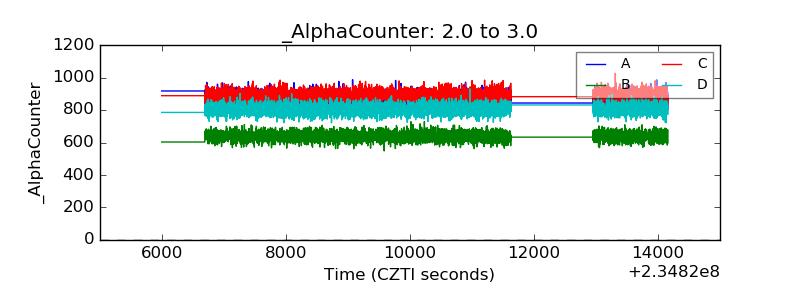 |
| _CPM_Rate | 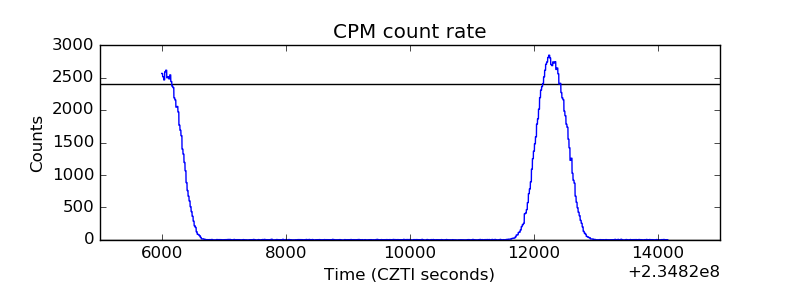 |
| CZT Counter | 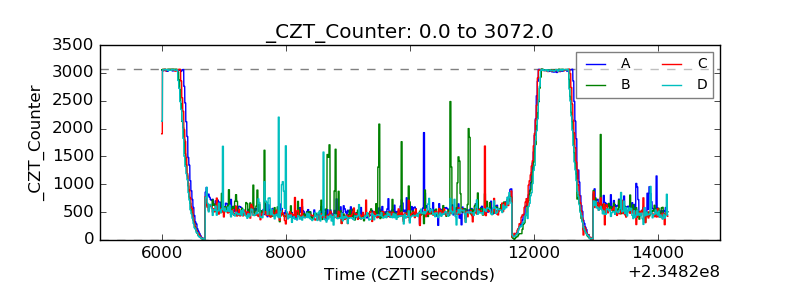 |
| +2.5 Volts monitor |  |
| +5 Volts monitor |  |
| _ROLL_ROT | 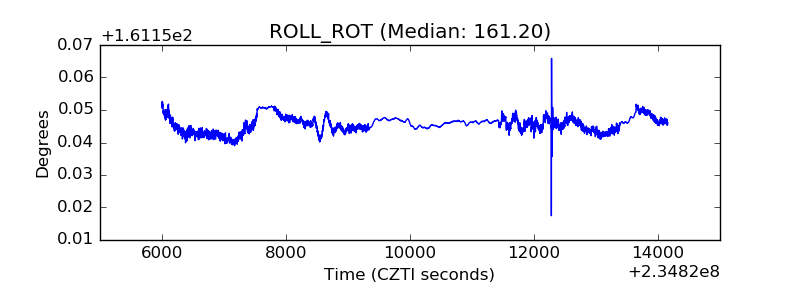 |
| _Roll_DEC | 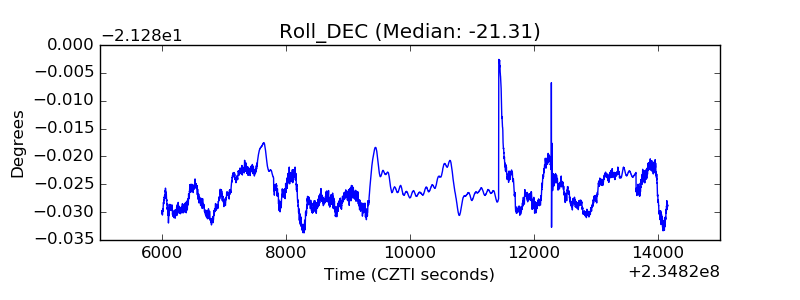 |
| _Roll_RA | 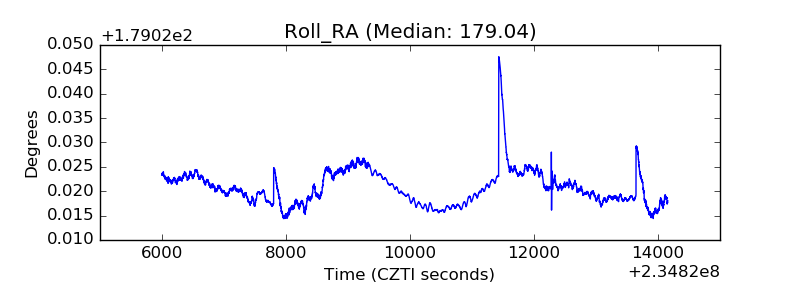 |
| Veto Counter | 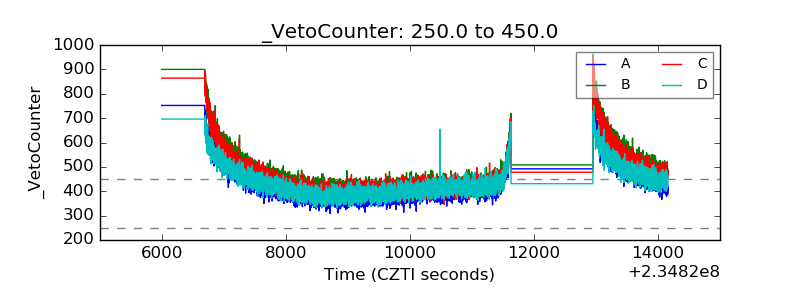 |