| Param | Original file | Final file |
|---|---|---|
| Filename | modeM0/AS1C02_042T02_9000001284_09206cztM0_level2.evt | modeM0/AS1C02_042T02_9000001284_09206cztM0_level2_quad_clean.evt |
| Size (bytes) | 491,204,160 | 63,573,120 |
| Size | 468.4 MB | 60.6 MB |
| Events in quadrant A | 3,933,966 | 376,063 |
| Events in quadrant B | 3,219,217 | 389,434 |
| Events in quadrant C | 3,022,939 | 375,215 |
| Events in quadrant D | 4,285,459 | 357,102 |
| Mode M9 | |||
|---|---|---|---|
| Quadrant | BADHDUFLAG | Total packets | Discarded packets |
| A | 0 | 27 | 0 |
| B | 0 | 27 | 0 |
| C | 0 | 27 | 0 |
| D | 0 | 27 | 0 |
| Mode SS | |||
|---|---|---|---|
| Quadrant | BADHDUFLAG | Total packets | Discarded packets |
| A | 0 | 122 | 0 |
| B | 0 | 122 | 0 |
| C | 0 | 122 | 0 |
| D | 0 | 122 | 0 |
| Mode M0 | |||
|---|---|---|---|
| Quadrant | BADHDUFLAG | Total packets | Discarded packets |
| A | 0 | 15589 | 3 |
| B | 0 | 13200 | 2 |
| C | 0 | 12695 | 5 |
| D | 0 | 16914 | 2 |
| Quadrant | Total seconds | Saturated seconds | Saturation percentage |
|---|---|---|---|
| A | 6122 | 107 | 1.747795% |
| B | 6122 | 39 | 0.637047% |
| C | 6121 | 10 | 0.163372% |
| D | 6122 | 249 | 4.067298% |
Noise dominated data is calculated using 1-second bins in cleaned event files. If a bin has >2000 counts, and if more than 50% of those come from <1% of pixels, then it is considered to be noise-dominated and hence unusable.
| Quadrant | # 1 sec bins | Bins with >0 counts | Bins with >2000 counts | High rate bins dominated by noise | Noise dominated (total time) | Noise dominated (detector-on time) | Marked lightcurve |
|---|---|---|---|---|---|---|---|
| A | 7472 | 6123 | 83 | 83 | 1.11% | 1.36% |  |
| B | 7472 | 6123 | 3 | 3 | 0.04% | 0.05% | 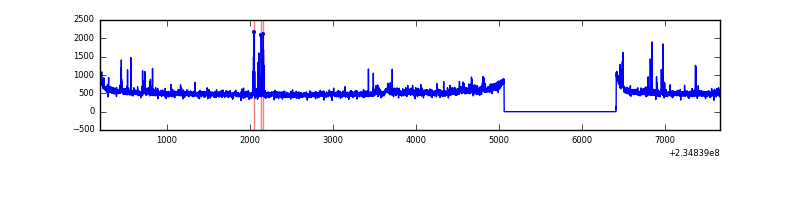 |
| C | 7471 | 6122 | 0 | 0 | 0.00% | 0.00% | 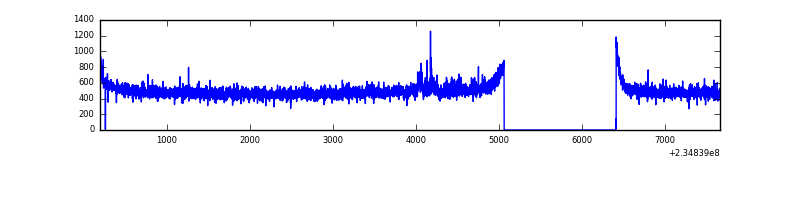 |
| D | 7471 | 6122 | 237 | 237 | 3.17% | 3.87% | 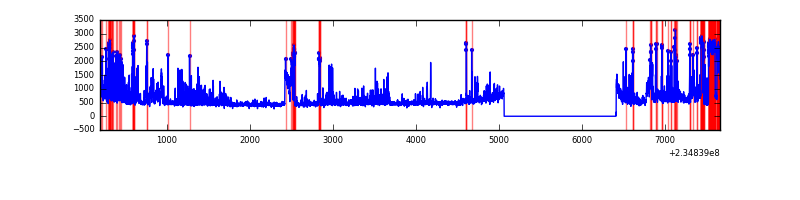 |
Top three noisy pixels from each quadrant. If the there are fewer than three noisy pixels in the level2.evt file, extra rows are filled as -1
| Pixel properties | Quadrant properties | ||||||
|---|---|---|---|---|---|---|---|
| Quadrant | DetID | PixID | Counts | Sigma | Mean | Median | Sigma |
| A | 8 | 5 | 734423 | 4650.8 | 781 | 767 | 157.7 |
| A | 1 | 162 | 117500 | 740.0 | 781 | 767 | 157.7 |
| A | 1 | 178 | 24506 | 150.49 | 781 | 767 | 157.7 |
| B | 4 | 80 | 54102 | 355.96 | 790 | 774 | 149.8 |
| B | 0 | 187 | 22463 | 144.77 | 790 | 774 | 149.8 |
| B | 0 | 168 | 21466 | 138.12 | 790 | 774 | 149.8 |
| C | 3 | 233 | 64942 | 368.47 | 757 | 763 | 174.2 |
| C | 13 | 61 | 5782 | 28.82 | 757 | 763 | 174.2 |
| C | 8 | 222 | 2993 | 12.8 | 757 | 763 | 174.2 |
| D | 1 | 52 | 581317 | 3046.26 | 735 | 717 | 190.6 |
| D | 9 | 64 | 554936 | 2907.84 | 735 | 717 | 190.6 |
| D | 4 | 95 | 232973 | 1218.59 | 735 | 717 | 190.6 |
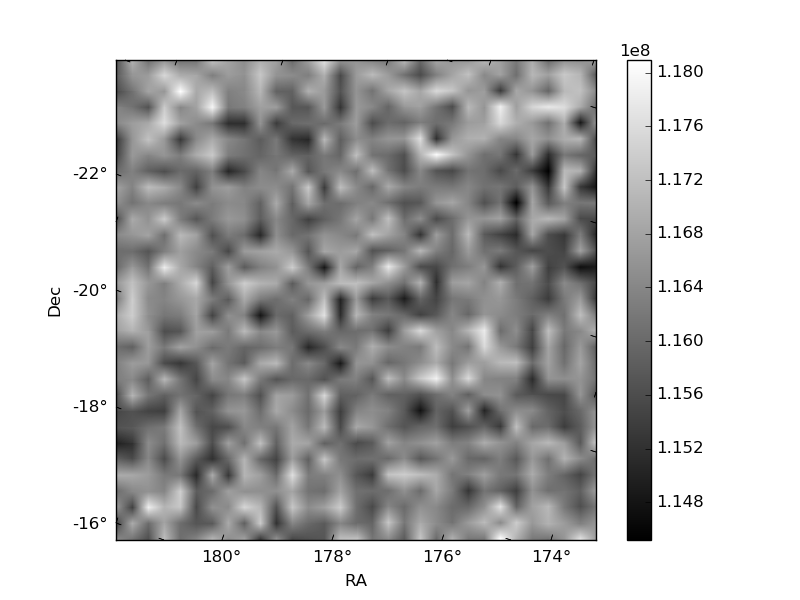
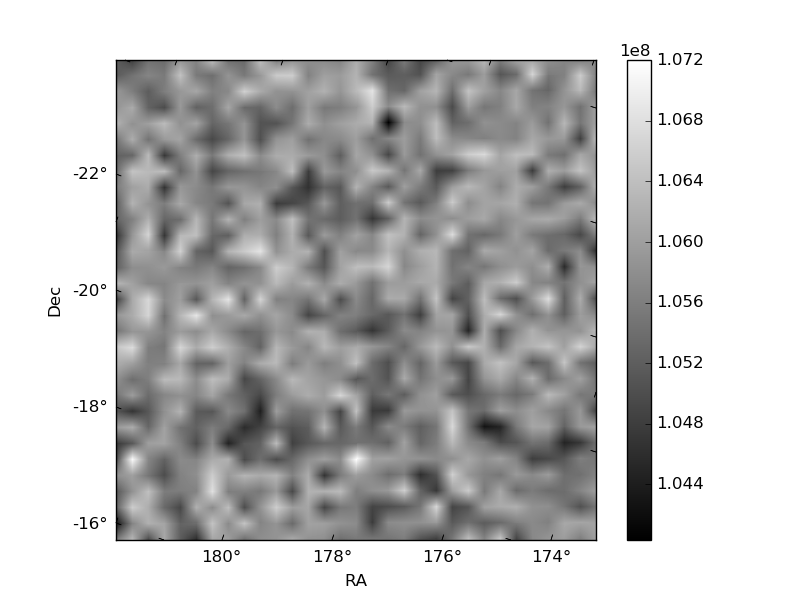
Histogram calculated using DETX and DETY for each event in the final _common_clean file
| Quadrant A | 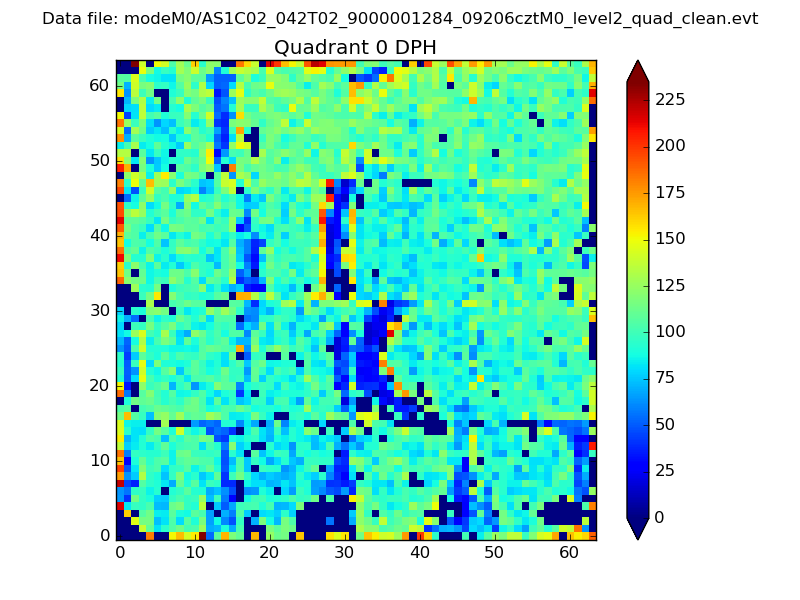 |
 |
Quadrant B |
|---|---|---|---|
| Quadrant D |  |
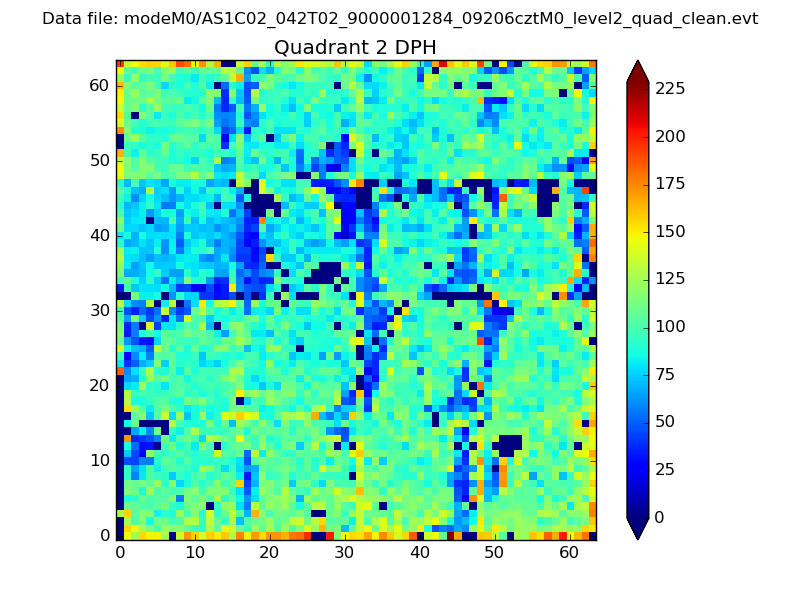 |
Quadrant C |
| Plot type | Count rate plots | Images |
|---|---|---|
| Comparison with Poisson distribution Blue bars denote a histogram of data divided into 1 sec bins. Red curve is a Poisson curve with rate = median count rate of data. |
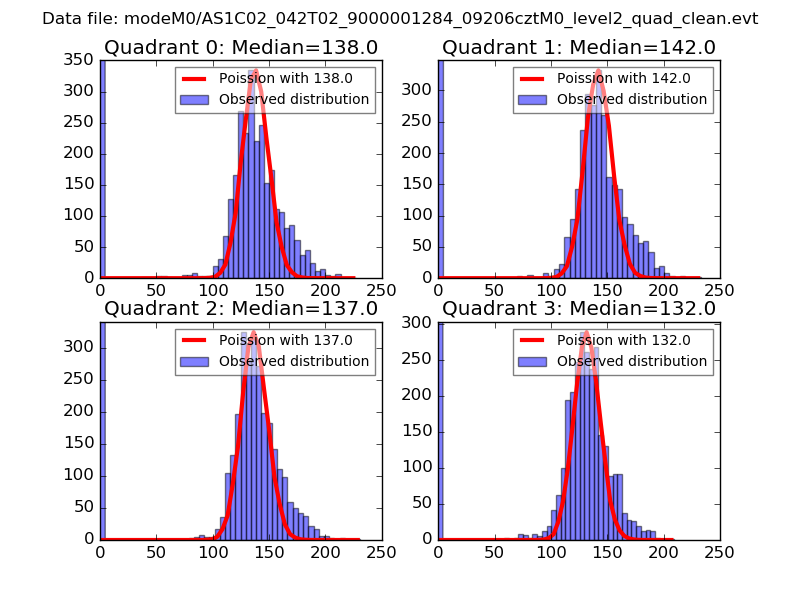 |
 |
| Quadrant-wise count rates Data is divided into 100 sec bins |
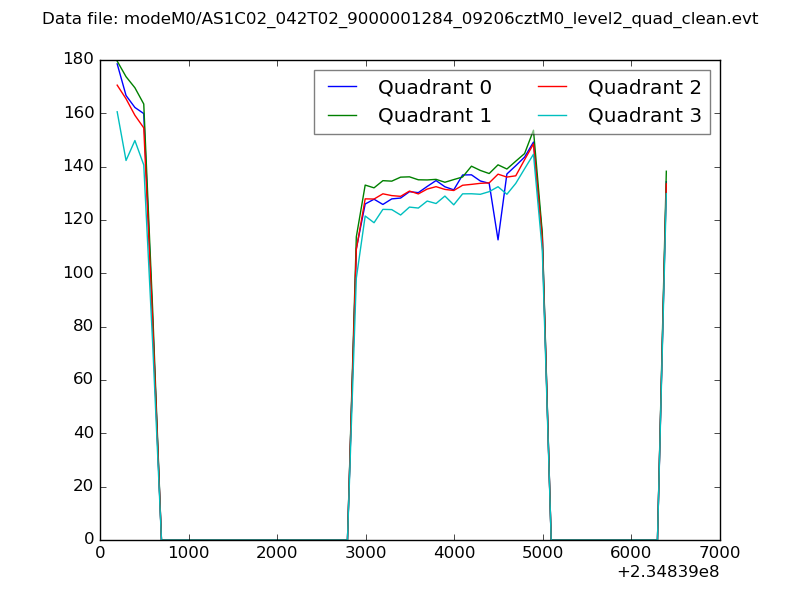 |
|
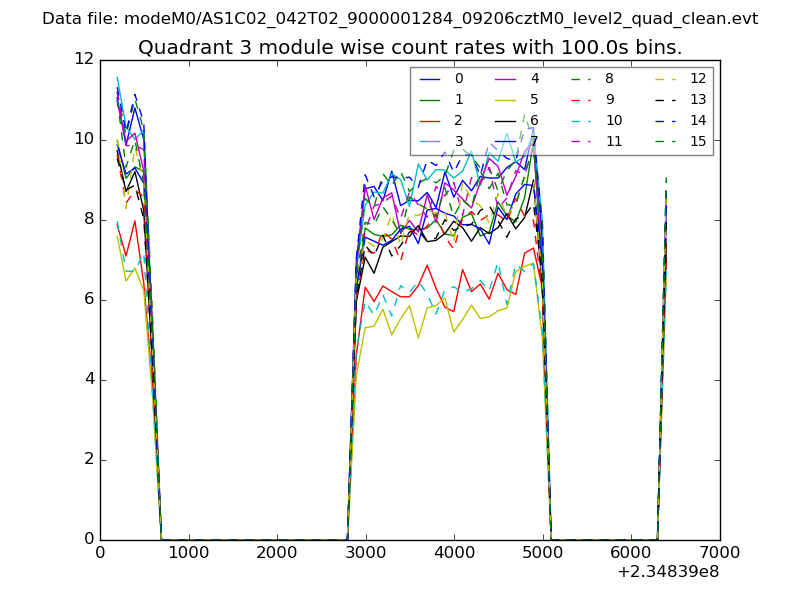
| Module-wise count rates for Quadrant A Data is divided into 100 sec bins |
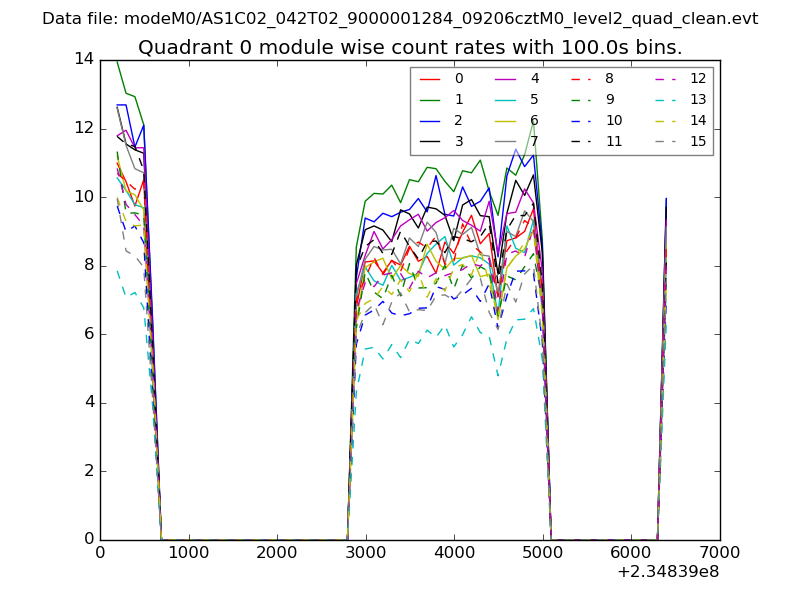 |
 |
| Module-wise count rates for Quadrant B Data is divided into 100 sec bins |
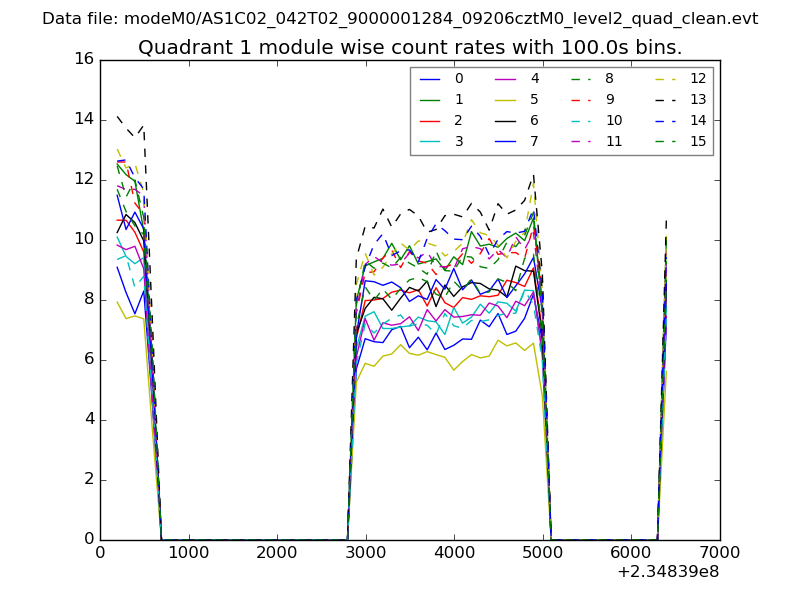 |
 |
| Module-wise count rates for Quadrant C Data is divided into 100 sec bins |
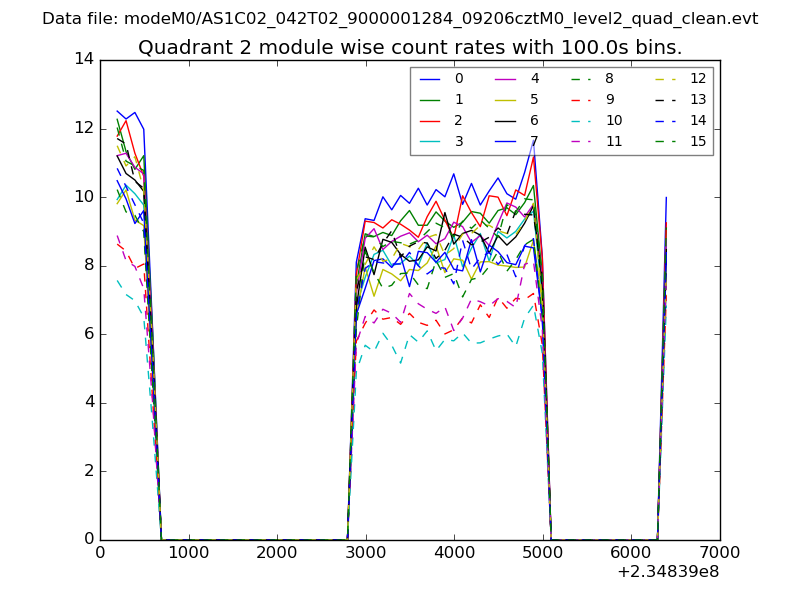 |
 |
| Module-wise count rates for Quadrant D Data is divided into 100 sec bins |
 |
 |
| Parameter | Plot |
|---|---|
| CZT HV Monitor | 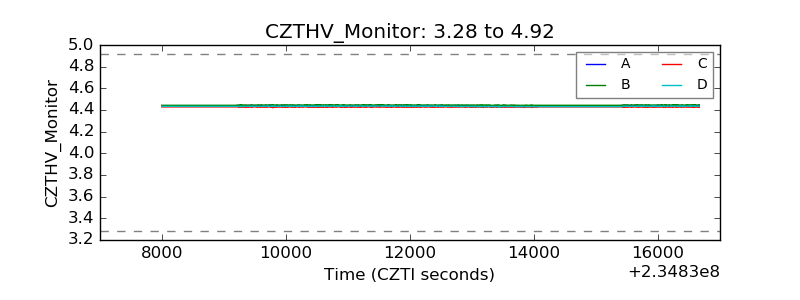 |
| D_VDD | 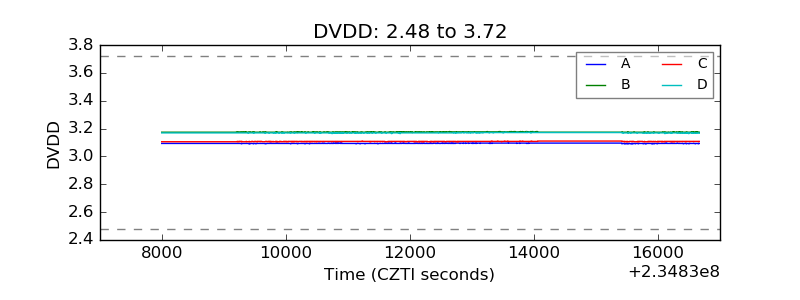 |
| Temperature 1 | 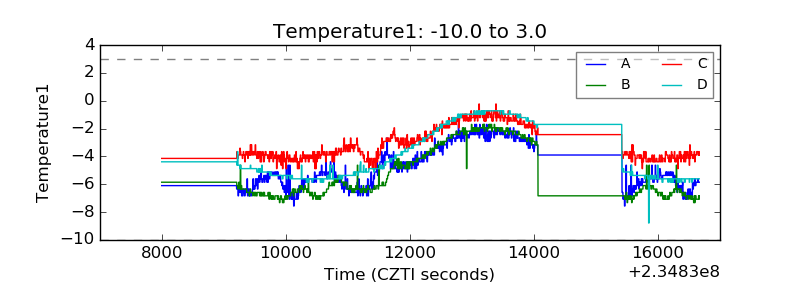 |
| Veto HV Monitor | 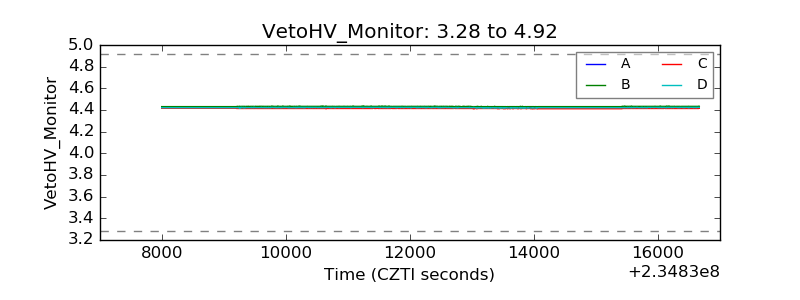 |
| Veto LLD | 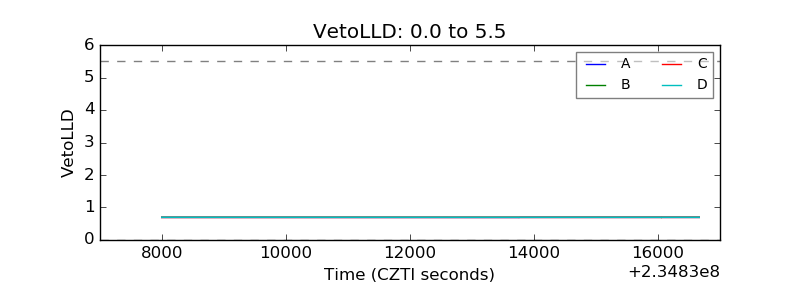 |
| Alpha Counter | 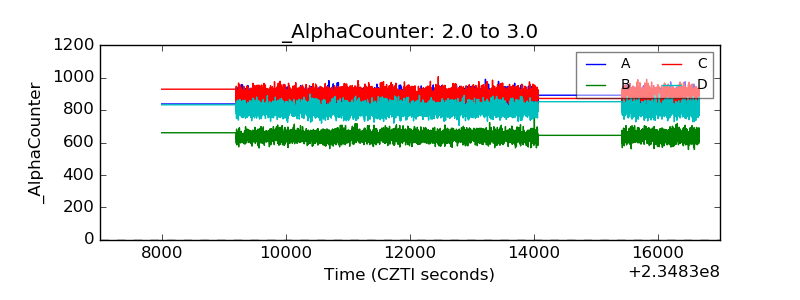 |
| _CPM_Rate | 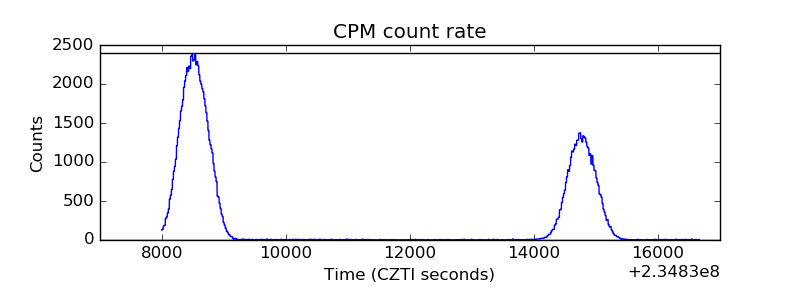 |
| CZT Counter | 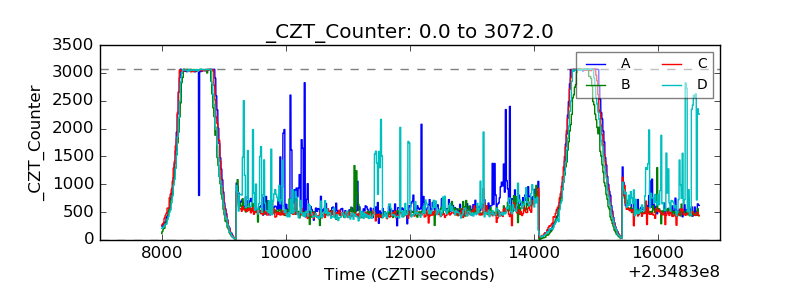 |
| +2.5 Volts monitor |  |
| +5 Volts monitor |  |
| _ROLL_ROT | 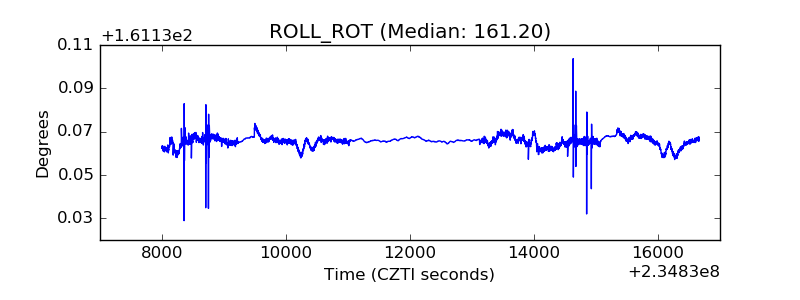 |
| _Roll_DEC | 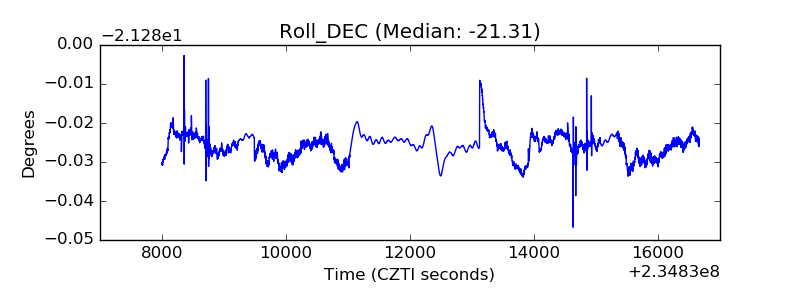 |
| _Roll_RA | 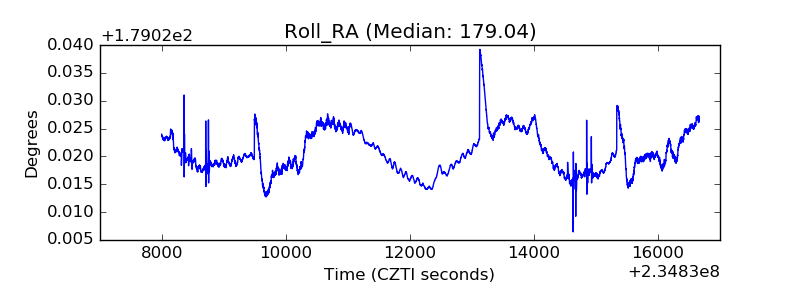 |
| Veto Counter | 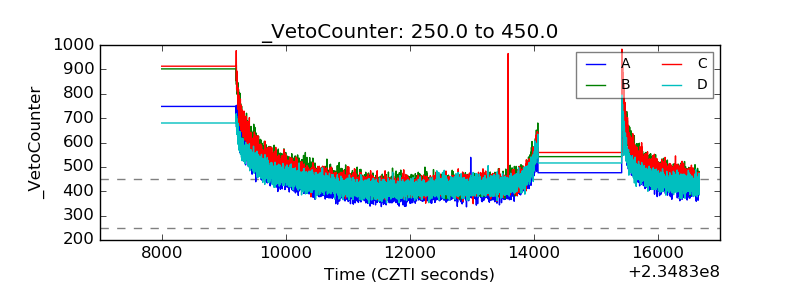 |