| Param | Original file | Final file |
|---|---|---|
| Filename | modeM0/AS1C02_042T02_9000001284_09207cztM0_level2.evt | modeM0/AS1C02_042T02_9000001284_09207cztM0_level2_quad_clean.evt |
| Size (bytes) | 553,014,720 | 60,929,280 |
| Size | 527.4 MB | 58.1 MB |
| Events in quadrant A | 4,231,725 | 346,769 |
| Events in quadrant B | 3,196,200 | 368,602 |
| Events in quadrant C | 3,008,868 | 358,119 |
| Events in quadrant D | 5,883,060 | 330,241 |
| Mode M9 | |||
|---|---|---|---|
| Quadrant | BADHDUFLAG | Total packets | Discarded packets |
| A | 0 | 11 | 0 |
| B | 0 | 11 | 0 |
| C | 0 | 11 | 0 |
| D | 0 | 11 | 0 |
| Mode SS | |||
|---|---|---|---|
| Quadrant | BADHDUFLAG | Total packets | Discarded packets |
| A | 0 | 130 | 0 |
| B | 0 | 130 | 0 |
| C | 0 | 130 | 0 |
| D | 0 | 130 | 0 |
| Mode M0 | |||
|---|---|---|---|
| Quadrant | BADHDUFLAG | Total packets | Discarded packets |
| A | 0 | 16482 | 2 |
| B | 0 | 13275 | 1 |
| C | 0 | 12958 | 1 |
| D | 0 | 21671 | 1 |
| Quadrant | Total seconds | Saturated seconds | Saturation percentage |
|---|---|---|---|
| A | 6308 | 286 | 4.533925% |
| B | 6308 | 76 | 1.204819% |
| C | 6308 | 44 | 0.697527% |
| D | 6308 | 987 | 15.646798% |
Noise dominated data is calculated using 1-second bins in cleaned event files. If a bin has >2000 counts, and if more than 50% of those come from <1% of pixels, then it is considered to be noise-dominated and hence unusable.
| Quadrant | # 1 sec bins | Bins with >0 counts | Bins with >2000 counts | High rate bins dominated by noise | Noise dominated (total time) | Noise dominated (detector-on time) | Marked lightcurve |
|---|---|---|---|---|---|---|---|
| A | 7468 | 6309 | 178 | 178 | 2.38% | 2.82% | 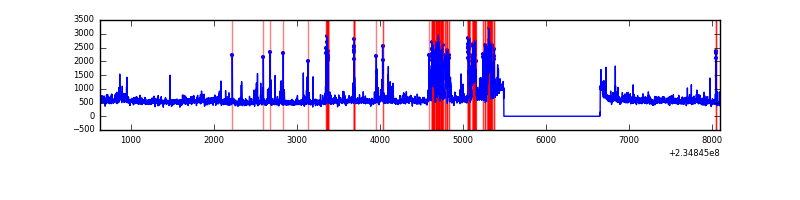 |
| B | 7468 | 6309 | 0 | 0 | 0.00% | 0.00% | 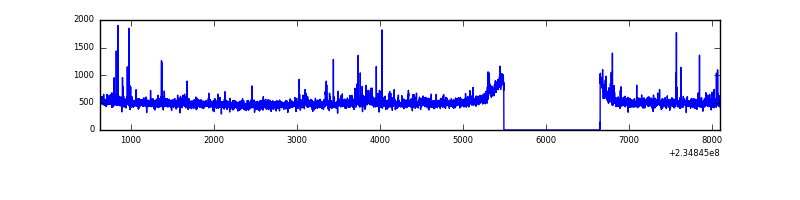 |
| C | 7468 | 6309 | 0 | 0 | 0.00% | 0.00% | 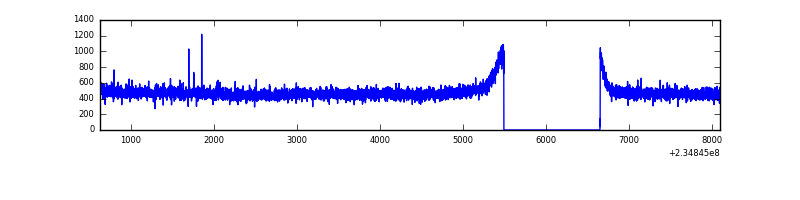 |
| D | 7468 | 6309 | 869 | 869 | 11.64% | 13.77% |  |
Top three noisy pixels from each quadrant. If the there are fewer than three noisy pixels in the level2.evt file, extra rows are filled as -1
| Pixel properties | Quadrant properties | ||||||
|---|---|---|---|---|---|---|---|
| Quadrant | DetID | PixID | Counts | Sigma | Mean | Median | Sigma |
| A | 5 | 16 | 518420 | 3280.03 | 779 | 765 | 157.8 |
| A | 8 | 5 | 462370 | 2924.88 | 779 | 765 | 157.8 |
| A | 1 | 162 | 120543 | 758.95 | 779 | 765 | 157.8 |
| B | 8 | 234 | 57049 | 370.27 | 795 | 778 | 152.0 |
| B | 4 | 80 | 25722 | 164.14 | 795 | 778 | 152.0 |
| B | 12 | 111 | 16456 | 103.16 | 795 | 778 | 152.0 |
| C | 3 | 233 | 20767 | 112.71 | 765 | 768 | 177.4 |
| C | 13 | 61 | 5764 | 28.16 | 765 | 768 | 177.4 |
| C | 8 | 222 | 3663 | 16.31 | 765 | 768 | 177.4 |
| D | 9 | 64 | 2345592 | 12672.88 | 722 | 701 | 185.0 |
| D | 4 | 95 | 420980 | 2271.38 | 722 | 701 | 185.0 |
| D | 1 | 52 | 275377 | 1484.48 | 722 | 701 | 185.0 |
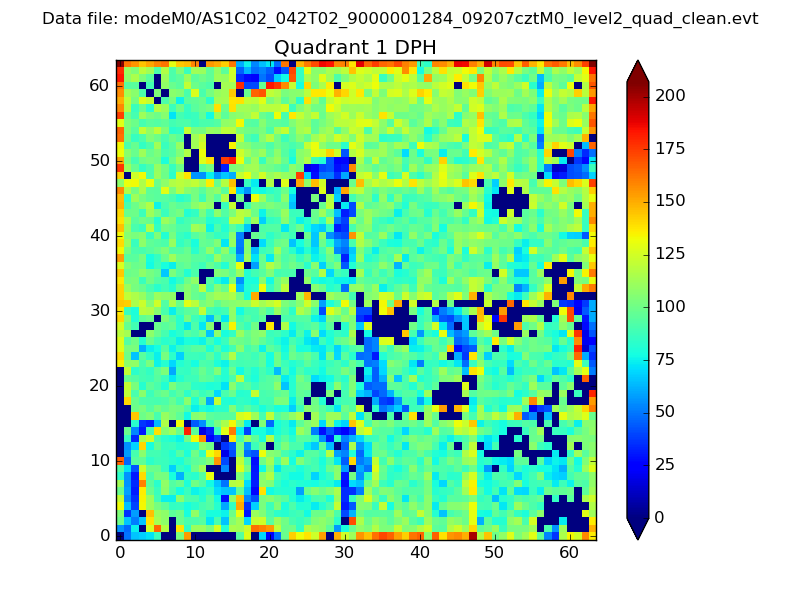
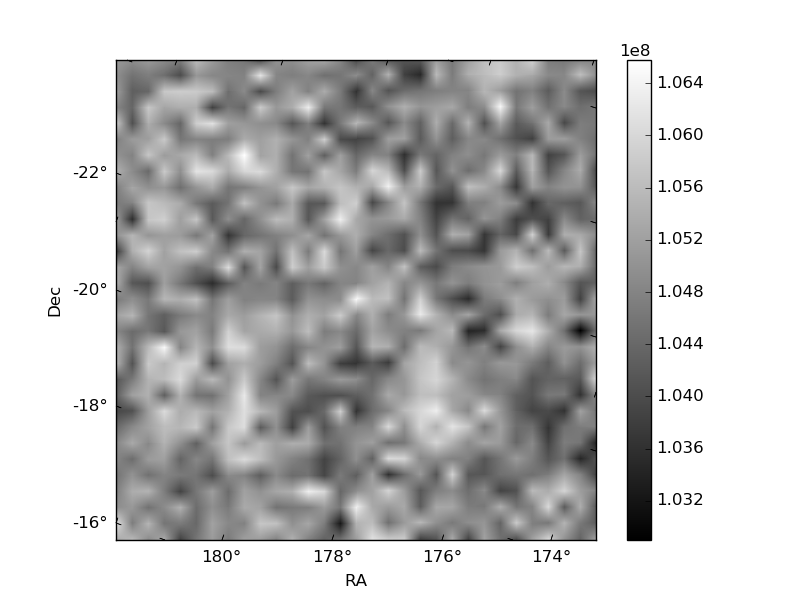
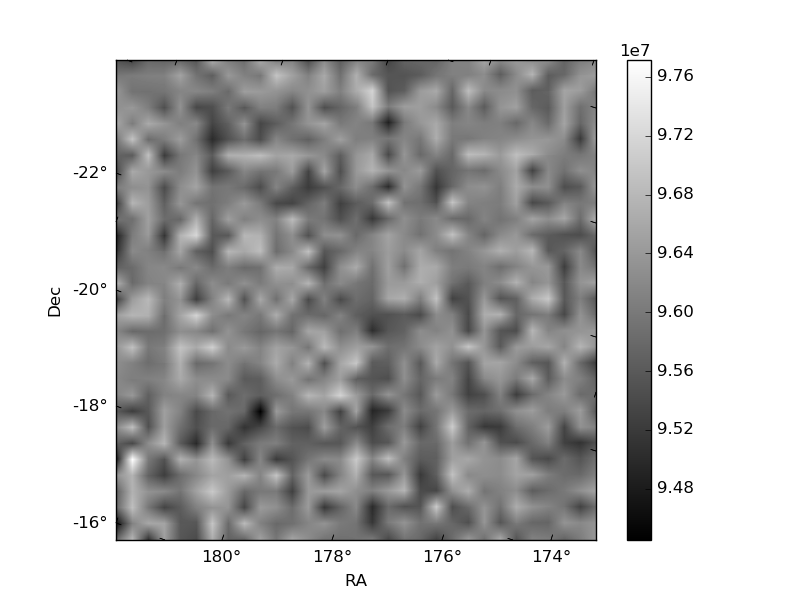
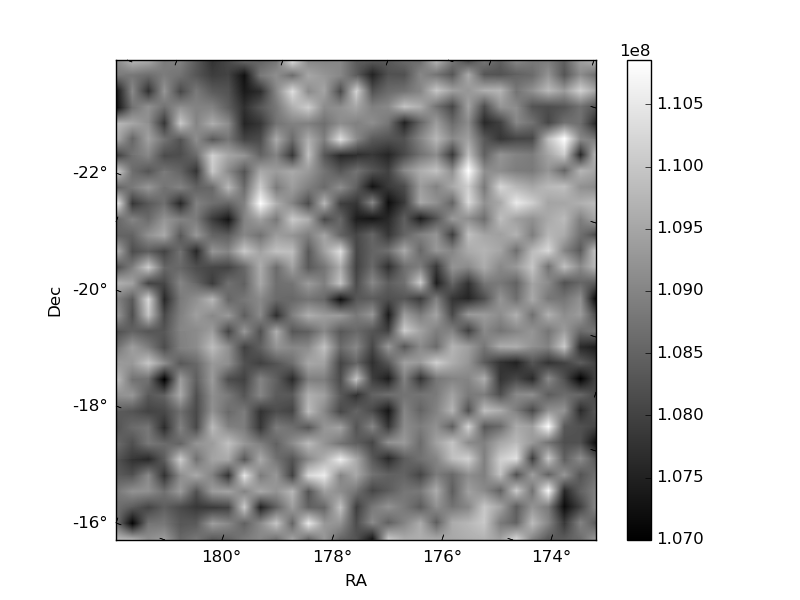
Histogram calculated using DETX and DETY for each event in the final _common_clean file
| Quadrant A |  |
 |
Quadrant B |
|---|---|---|---|
| Quadrant D | 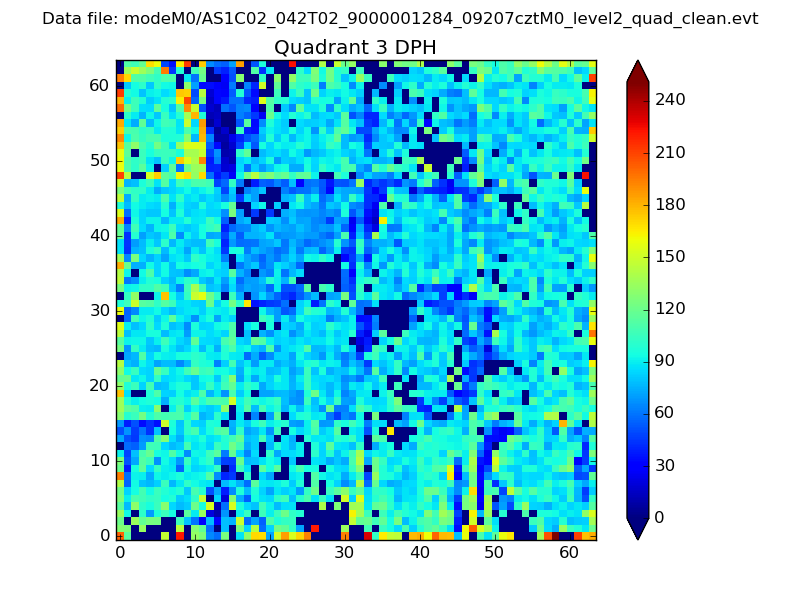 |
 |
Quadrant C |
| Plot type | Count rate plots | Images |
|---|---|---|
| Comparison with Poisson distribution Blue bars denote a histogram of data divided into 1 sec bins. Red curve is a Poisson curve with rate = median count rate of data. |
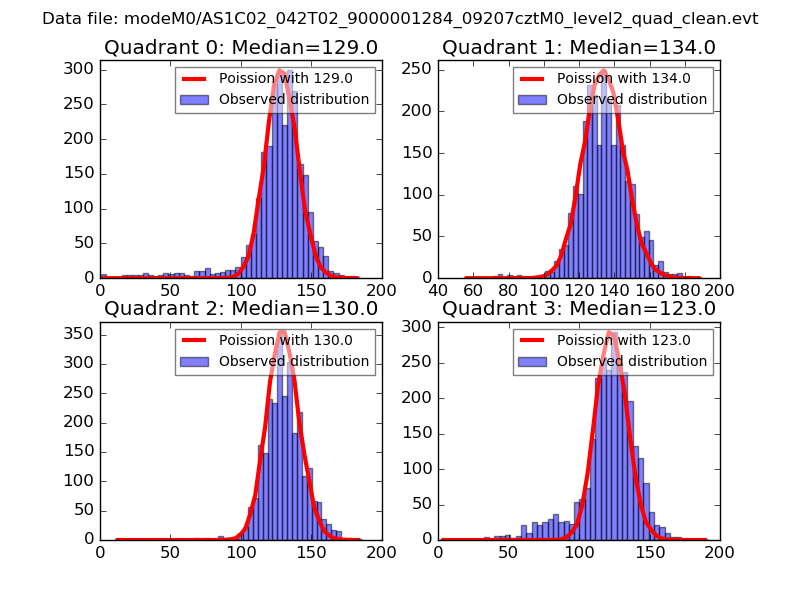 |
 |
| Quadrant-wise count rates Data is divided into 100 sec bins |
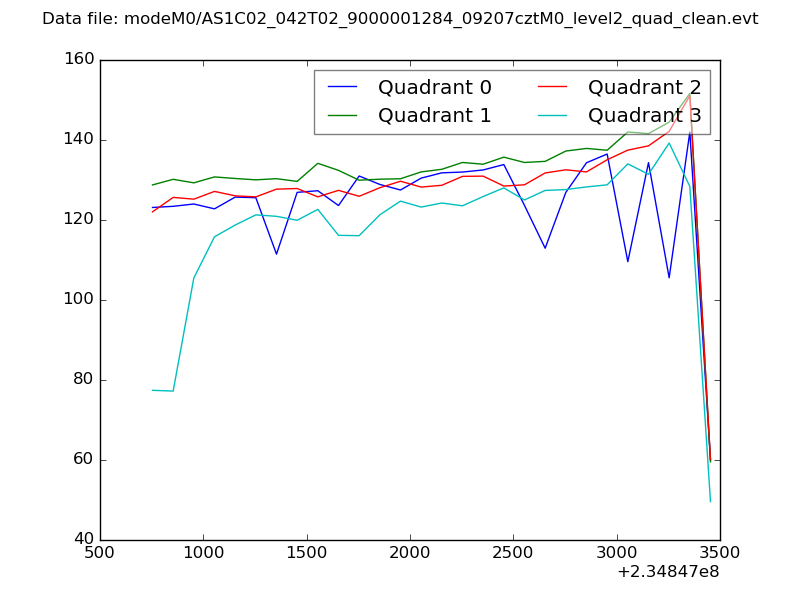 |
|
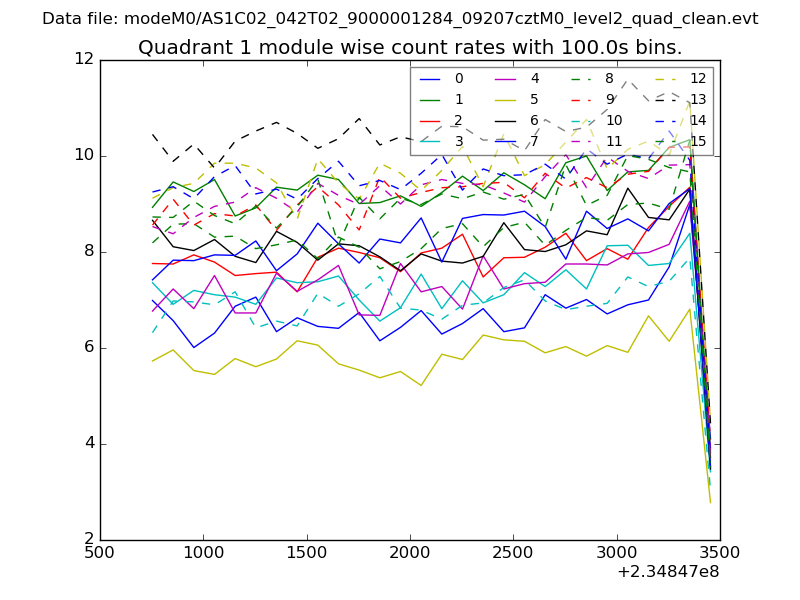
| Module-wise count rates for Quadrant A Data is divided into 100 sec bins |
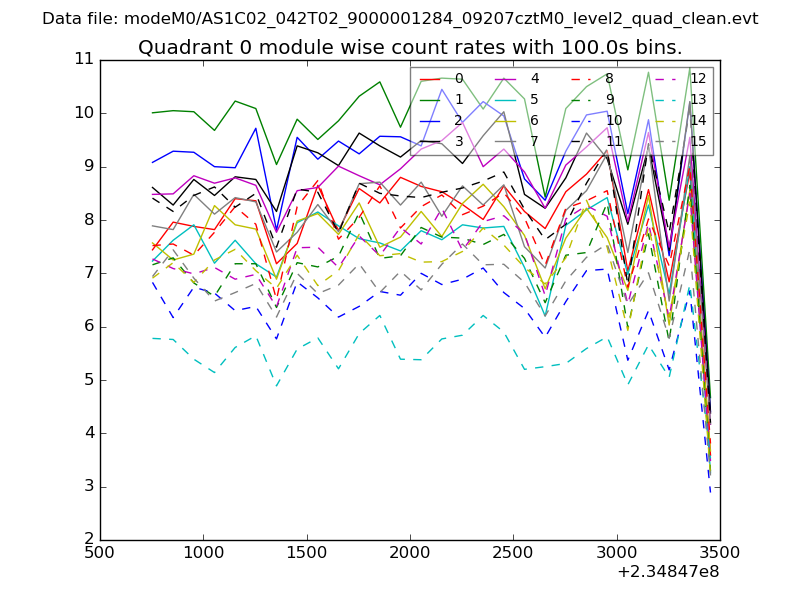 |
 |
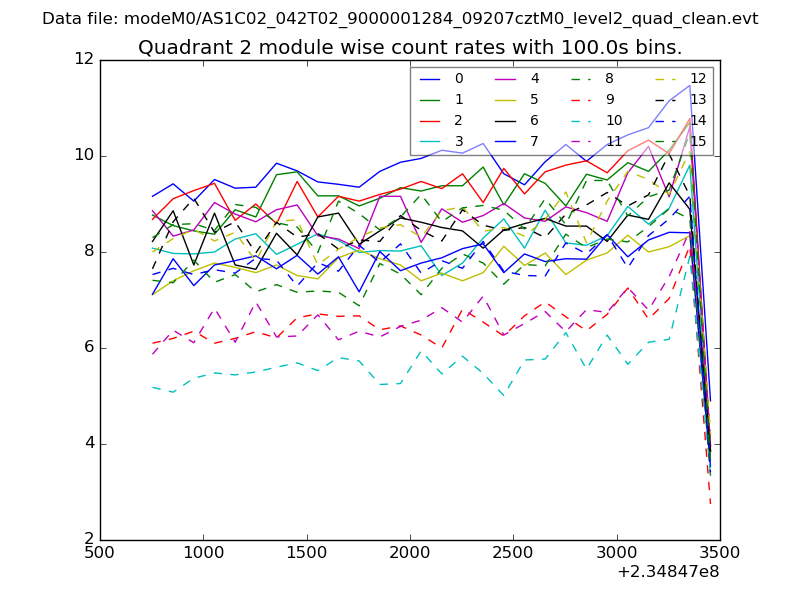
| Module-wise count rates for Quadrant B Data is divided into 100 sec bins |
 |
 |
| Module-wise count rates for Quadrant C Data is divided into 100 sec bins |
 |
 |
| Module-wise count rates for Quadrant D Data is divided into 100 sec bins |
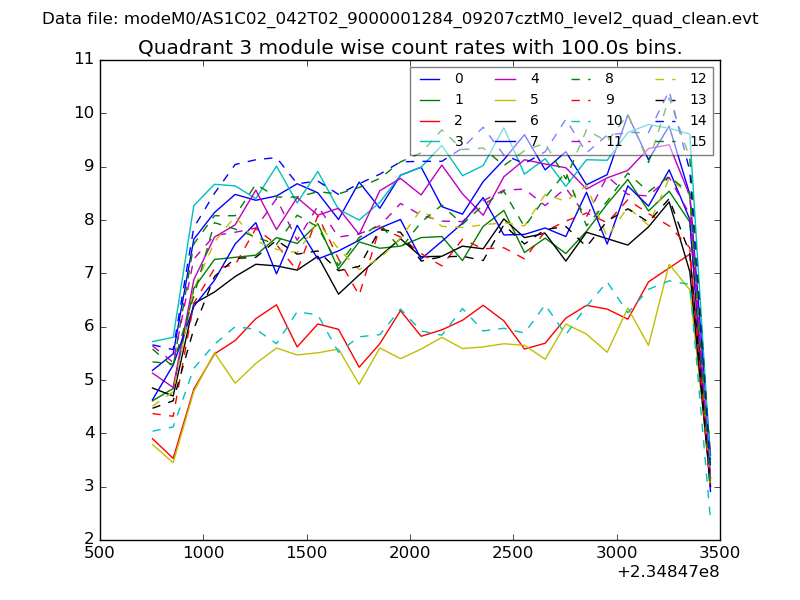 |
 |
| Parameter | Plot |
|---|---|
| CZT HV Monitor | 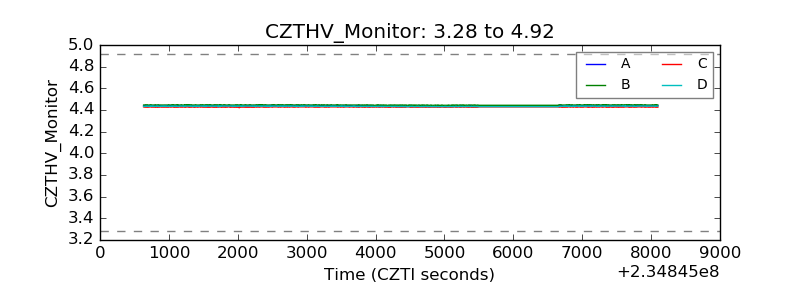 |
| D_VDD | 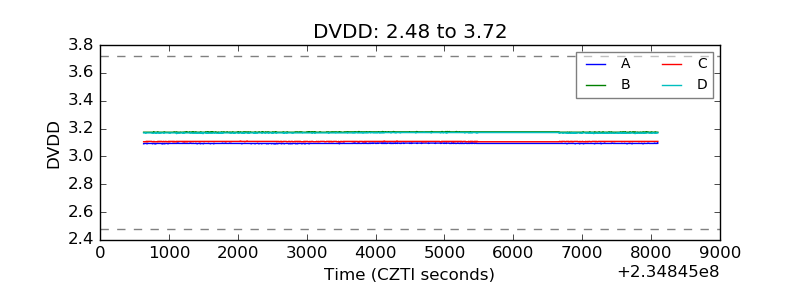 |
| Temperature 1 | 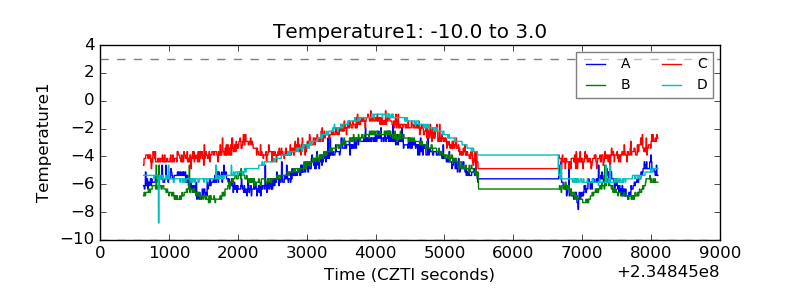 |
| Veto HV Monitor | 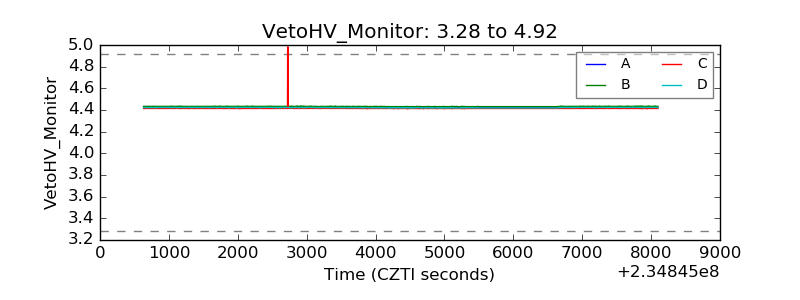 |
| Veto LLD | 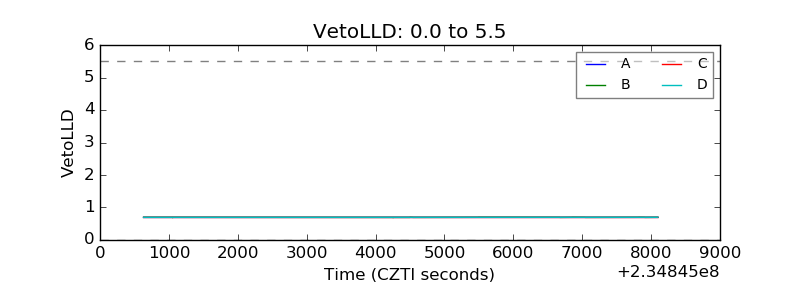 |
| Alpha Counter | 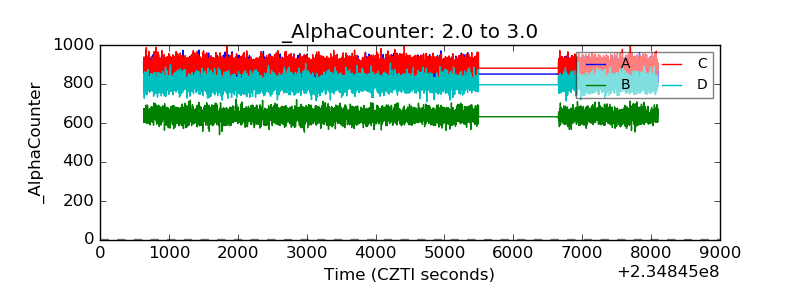 |
| _CPM_Rate | 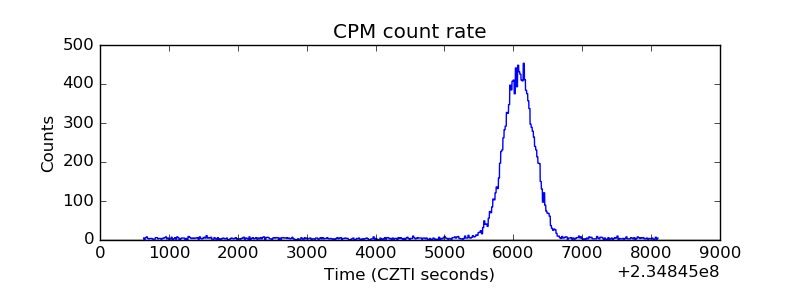 |
| CZT Counter |  |
| +2.5 Volts monitor |  |
| +5 Volts monitor |  |
| _ROLL_ROT | 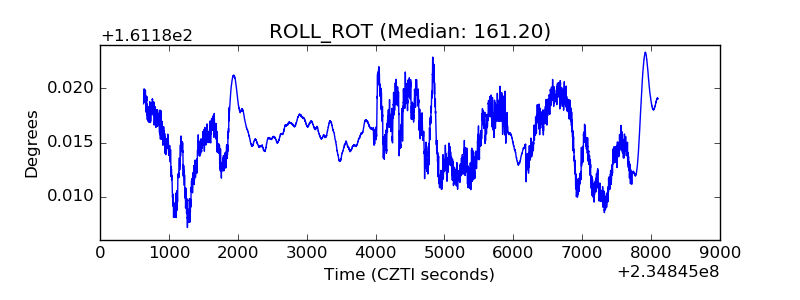 |
| _Roll_DEC | 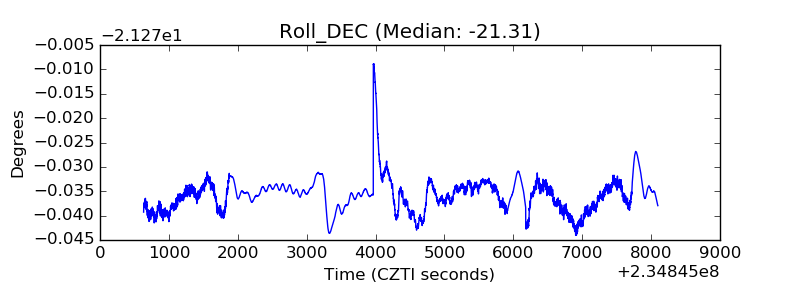 |
| _Roll_RA |  |
| Veto Counter | 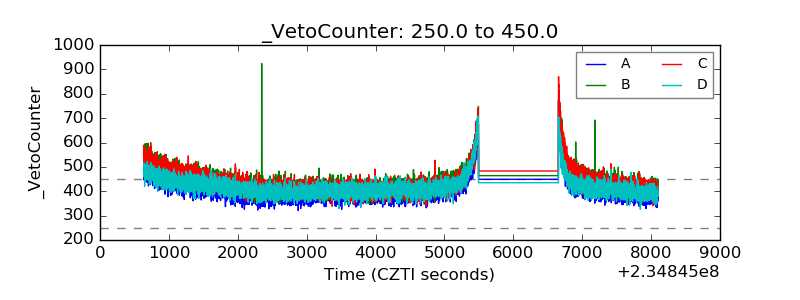 |