| Param | Original file | Final file |
|---|---|---|
| Filename | modeM0/AS1C02_042T02_9000001284_09208cztM0_level2.evt | modeM0/AS1C02_042T02_9000001284_09208cztM0_level2_quad_clean.evt |
| Size (bytes) | 560,733,120 | 72,270,720 |
| Size | 534.8 MB | 68.9 MB |
| Events in quadrant A | 4,006,021 | 438,764 |
| Events in quadrant B | 3,622,454 | 444,553 |
| Events in quadrant C | 3,229,649 | 434,479 |
| Events in quadrant D | 5,654,628 | 388,197 |
| Mode M9 | |||
|---|---|---|---|
| Quadrant | BADHDUFLAG | Total packets | Discarded packets |
| A | 0 | 8 | 0 |
| B | 0 | 8 | 0 |
| C | 0 | 8 | 0 |
| D | 0 | 8 | 0 |
| Mode SS | |||
|---|---|---|---|
| Quadrant | BADHDUFLAG | Total packets | Discarded packets |
| A | 0 | 140 | 0 |
| B | 0 | 140 | 0 |
| C | 0 | 140 | 0 |
| D | 0 | 140 | 0 |
| Mode M0 | |||
|---|---|---|---|
| Quadrant | BADHDUFLAG | Total packets | Discarded packets |
| A | 0 | 16227 | 3 |
| B | 0 | 15088 | 2 |
| C | 0 | 14244 | 2 |
| D | 0 | 21435 | 2 |
| Quadrant | Total seconds | Saturated seconds | Saturation percentage |
|---|---|---|---|
| A | 6919 | 104 | 1.503107% |
| B | 6919 | 116 | 1.676543% |
| C | 6919 | 74 | 1.069519% |
| D | 6919 | 720 | 10.406128% |
Noise dominated data is calculated using 1-second bins in cleaned event files. If a bin has >2000 counts, and if more than 50% of those come from <1% of pixels, then it is considered to be noise-dominated and hence unusable.
| Quadrant | # 1 sec bins | Bins with >0 counts | Bins with >2000 counts | High rate bins dominated by noise | Noise dominated (total time) | Noise dominated (detector-on time) | Marked lightcurve |
|---|---|---|---|---|---|---|---|
| A | 7709 | 6920 | 5 | 5 | 0.06% | 0.07% | 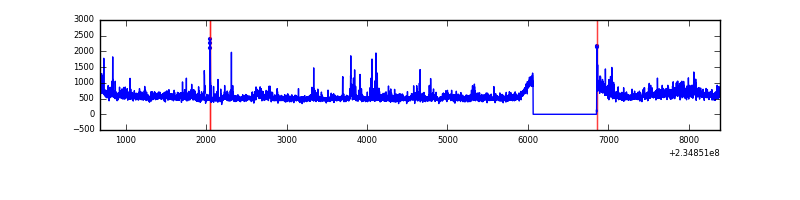 |
| B | 7709 | 6920 | 7 | 7 | 0.09% | 0.10% | 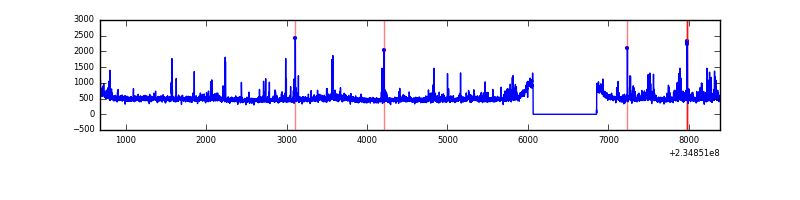 |
| C | 7709 | 6920 | 0 | 0 | 0.00% | 0.00% |  |
| D | 7709 | 6920 | 635 | 635 | 8.24% | 9.18% | 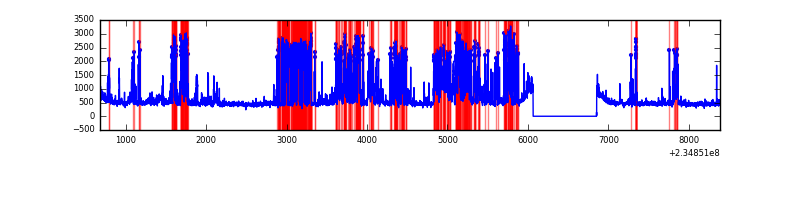 |
Top three noisy pixels from each quadrant. If the there are fewer than three noisy pixels in the level2.evt file, extra rows are filled as -1
| Pixel properties | Quadrant properties | ||||||
|---|---|---|---|---|---|---|---|
| Quadrant | DetID | PixID | Counts | Sigma | Mean | Median | Sigma |
| A | 8 | 5 | 512858 | 2945.54 | 846 | 829 | 173.8 |
| A | 1 | 162 | 121176 | 692.32 | 846 | 829 | 173.8 |
| A | 5 | 16 | 36231 | 203.66 | 846 | 829 | 173.8 |
| B | 8 | 234 | 251286 | 1516.1 | 853 | 831 | 165.2 |
| B | 0 | 187 | 26309 | 154.23 | 853 | 831 | 165.2 |
| B | 12 | 111 | 18164 | 104.92 | 853 | 831 | 165.2 |
| C | 3 | 233 | 15723 | 77.62 | 823 | 829 | 191.9 |
| C | 13 | 61 | 6318 | 28.61 | 823 | 829 | 191.9 |
| C | 8 | 222 | 2819 | 10.37 | 823 | 829 | 191.9 |
| D | 4 | 95 | 1228165 | 6209.86 | 787 | 767 | 197.7 |
| D | 1 | 52 | 1005395 | 5082.78 | 787 | 767 | 197.7 |
| D | 9 | 64 | 257273 | 1297.76 | 787 | 767 | 197.7 |
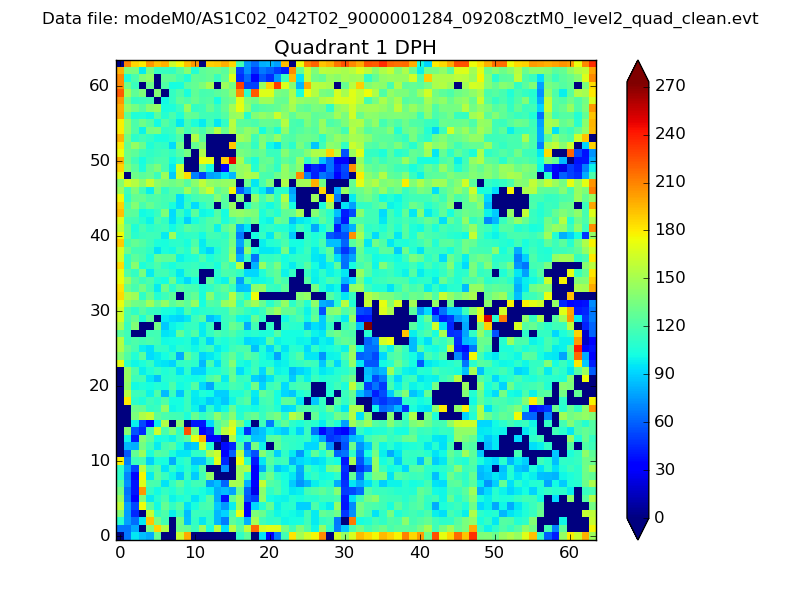
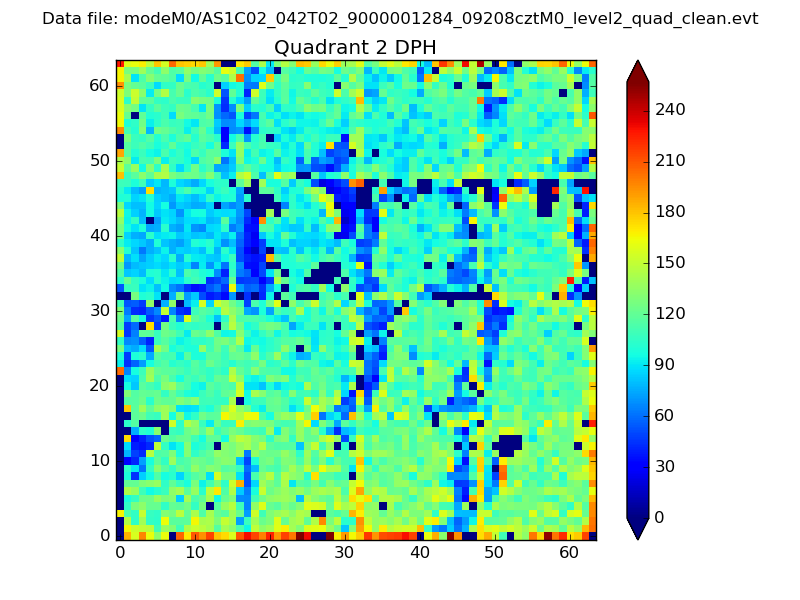
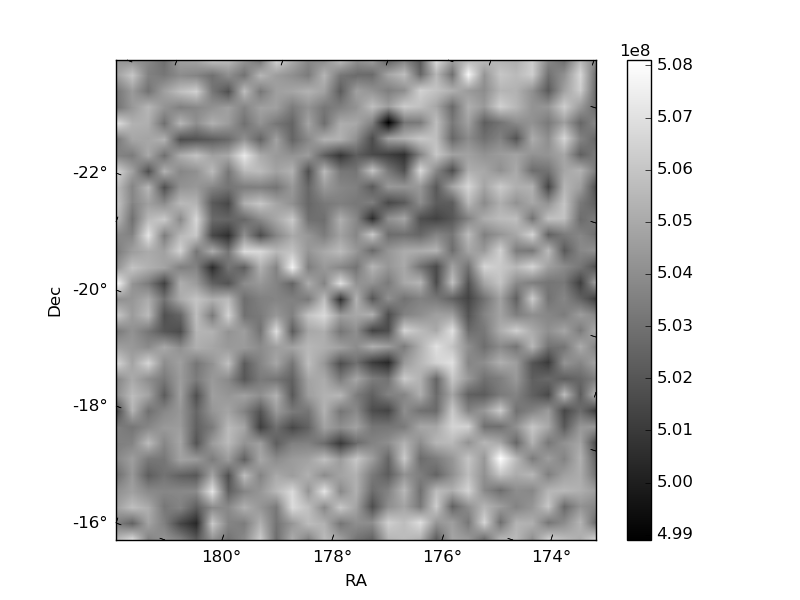
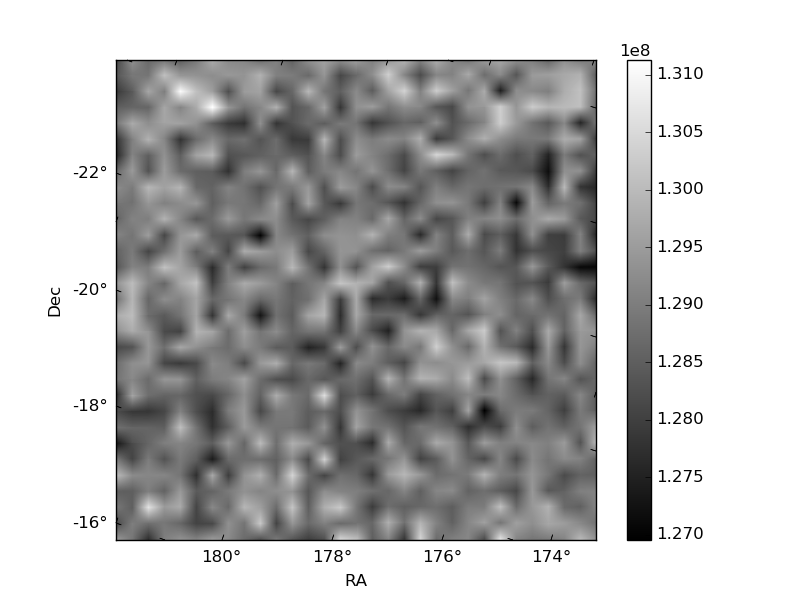
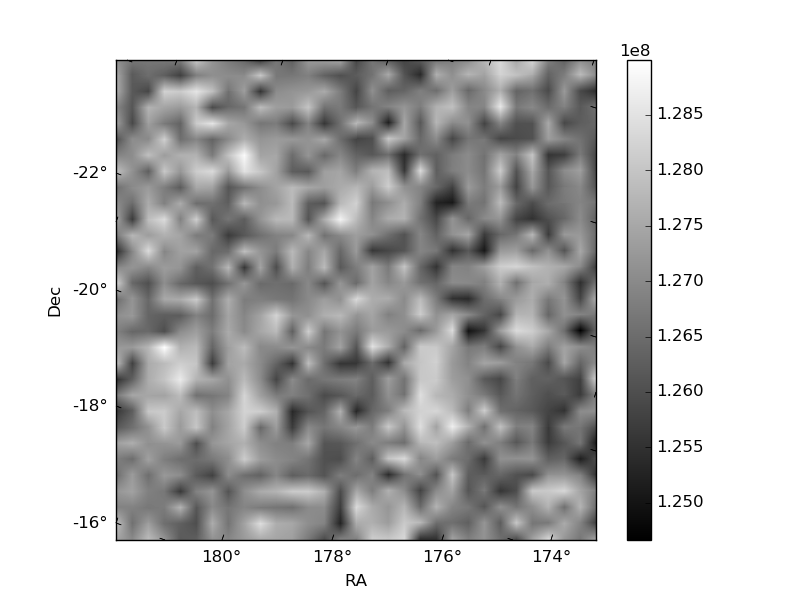
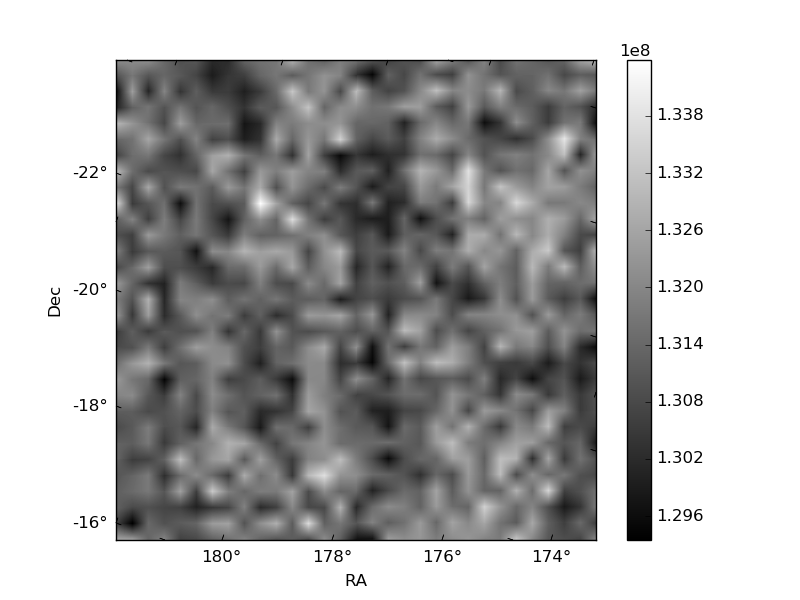
Histogram calculated using DETX and DETY for each event in the final _common_clean file
| Quadrant A | 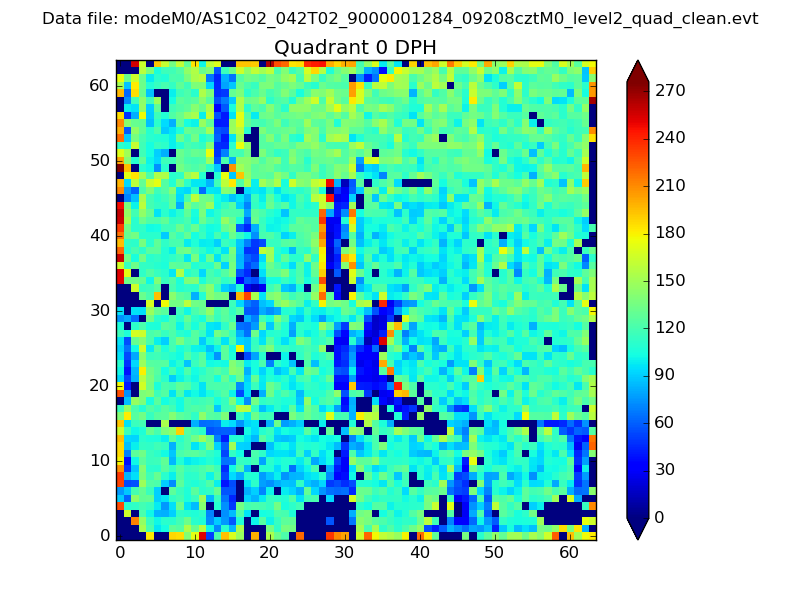 |
 |
Quadrant B |
|---|---|---|---|
| Quadrant D | 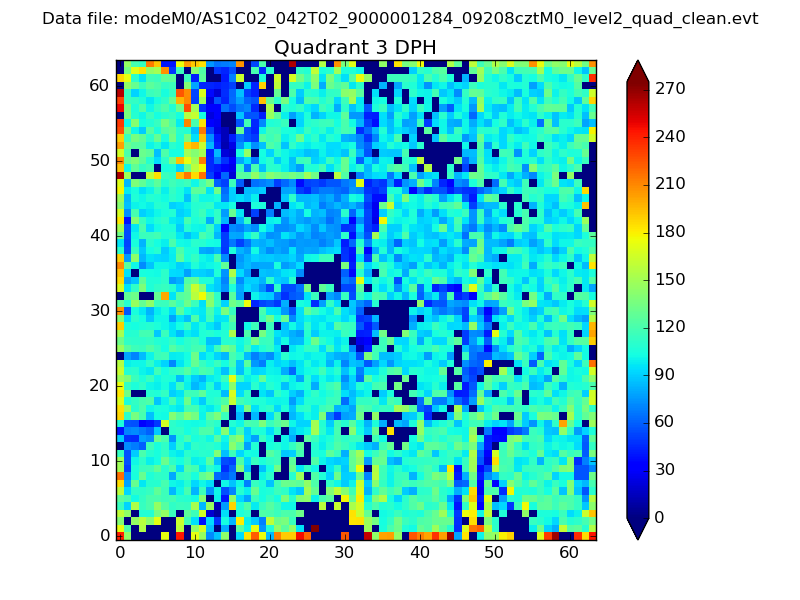 |
 |
Quadrant C |
| Plot type | Count rate plots | Images |
|---|---|---|
| Comparison with Poisson distribution Blue bars denote a histogram of data divided into 1 sec bins. Red curve is a Poisson curve with rate = median count rate of data. |
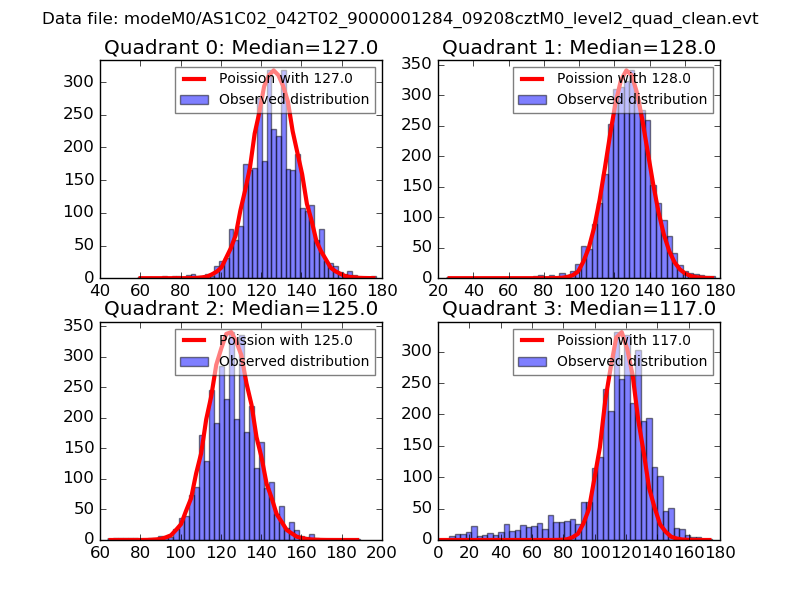 |
 |
| Quadrant-wise count rates Data is divided into 100 sec bins |
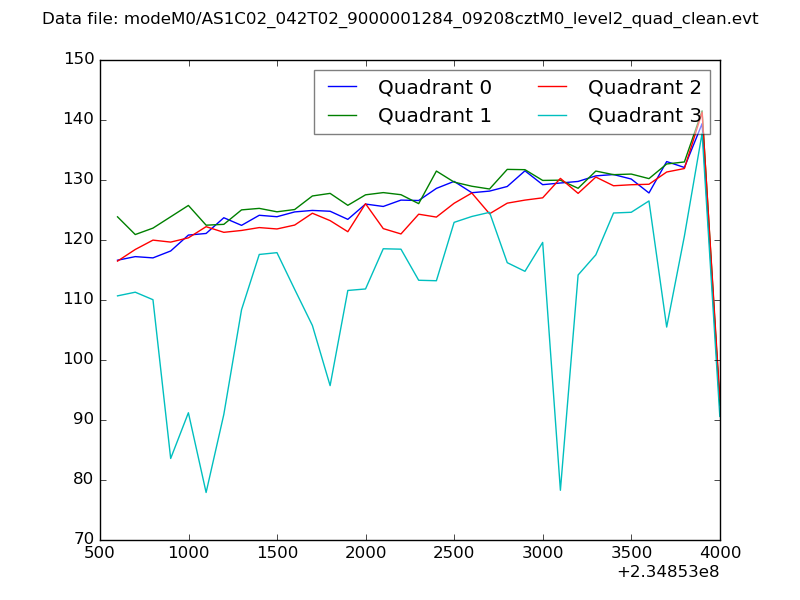 |
|
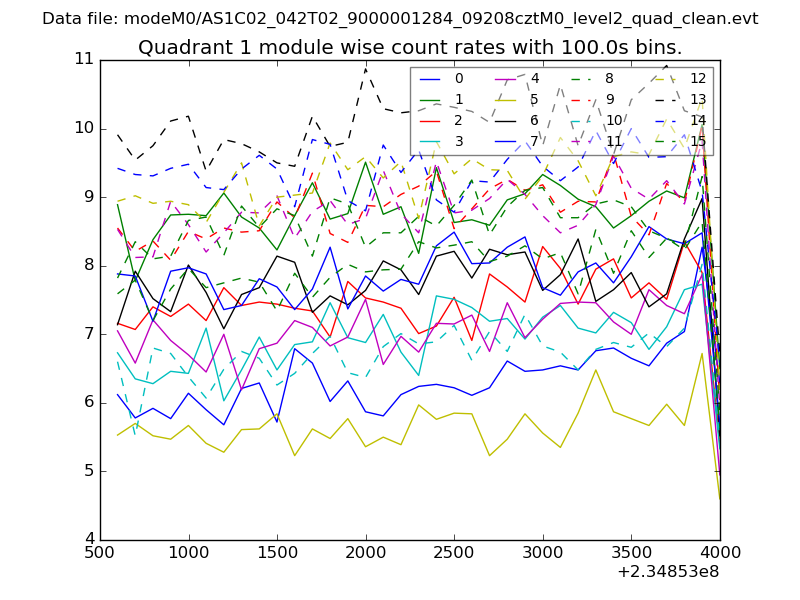
| Module-wise count rates for Quadrant A Data is divided into 100 sec bins |
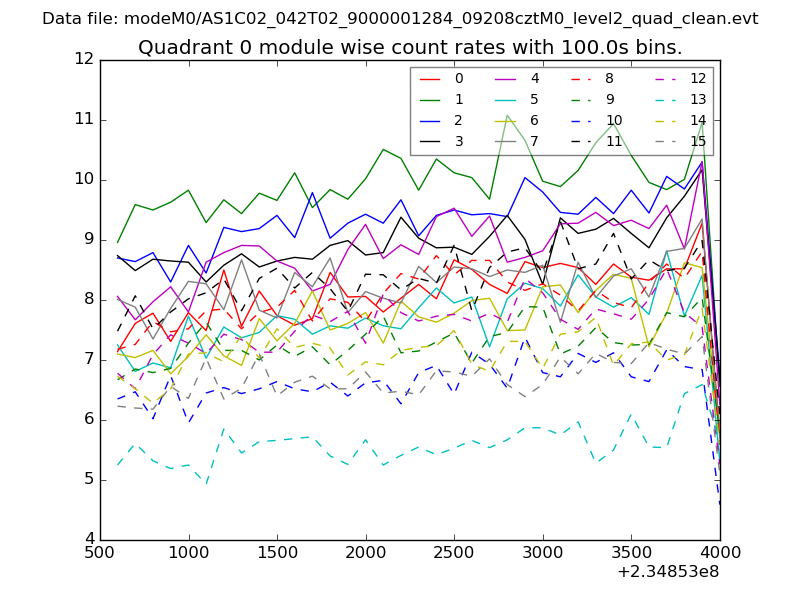 |
 |
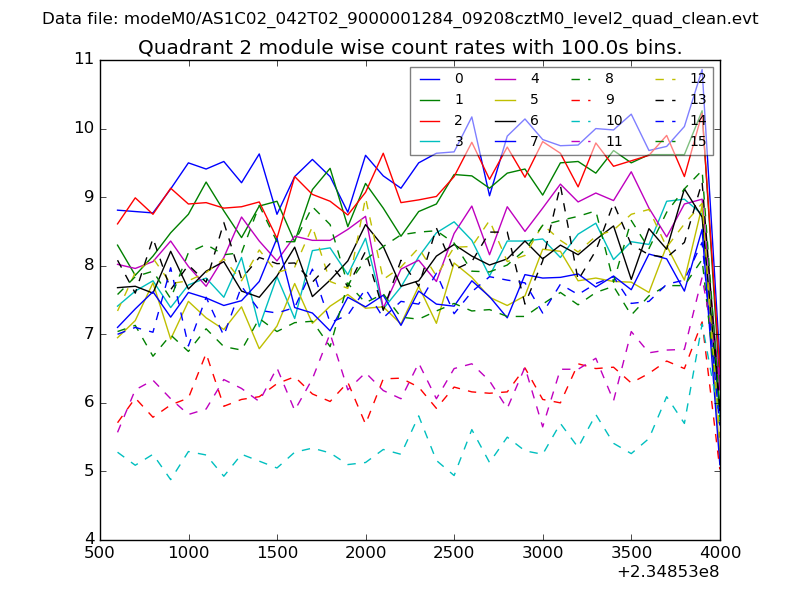
| Module-wise count rates for Quadrant B Data is divided into 100 sec bins |
 |
 |
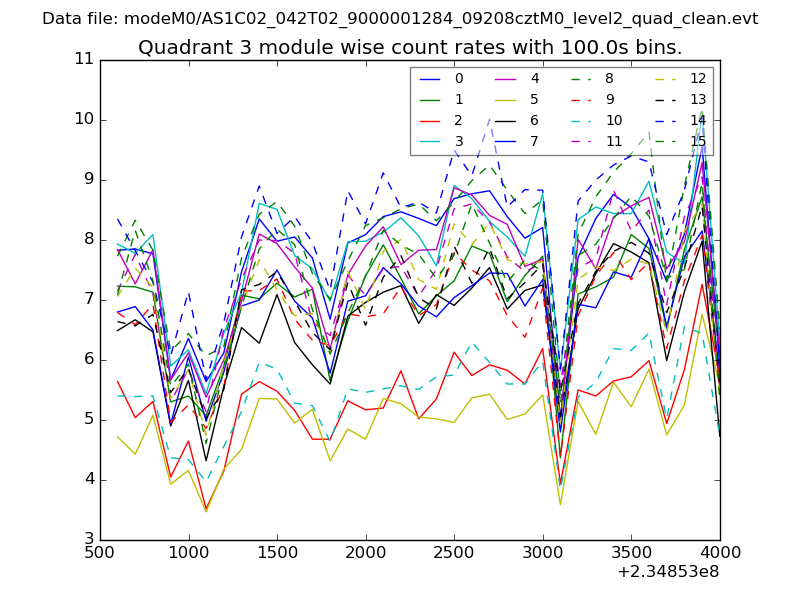
| Module-wise count rates for Quadrant C Data is divided into 100 sec bins |
 |
 |
| Module-wise count rates for Quadrant D Data is divided into 100 sec bins |
 |
 |
| Parameter | Plot |
|---|---|
| CZT HV Monitor | 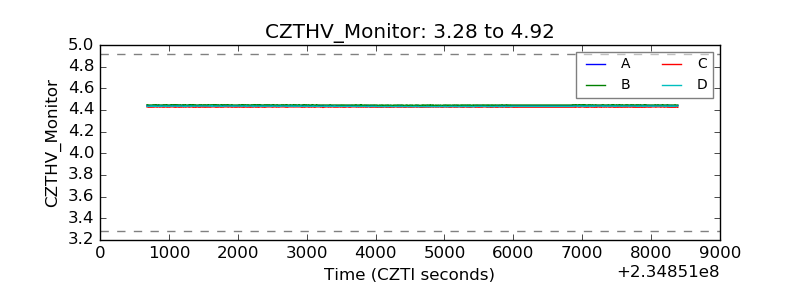 |
| D_VDD | 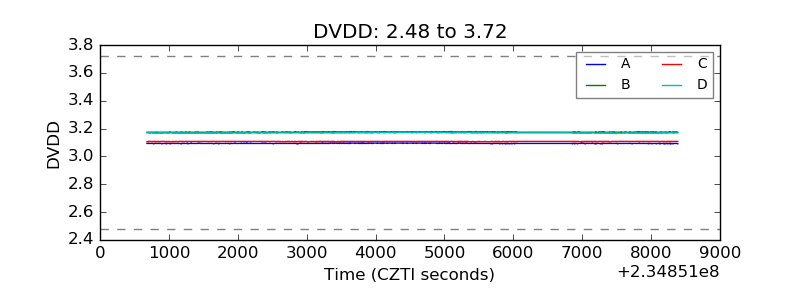 |
| Temperature 1 | 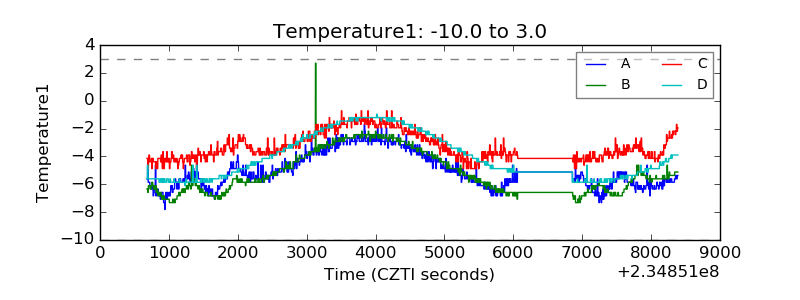 |
| Veto HV Monitor | 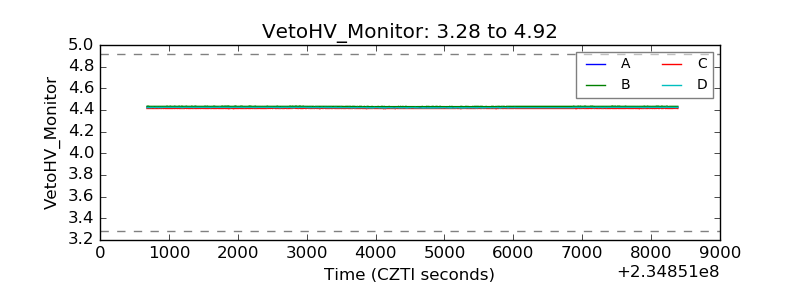 |
| Veto LLD | 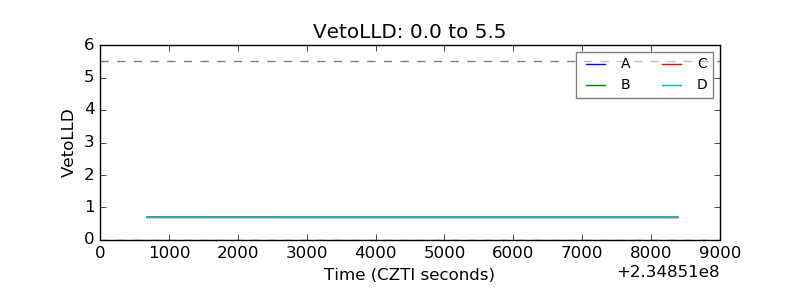 |
| Alpha Counter | 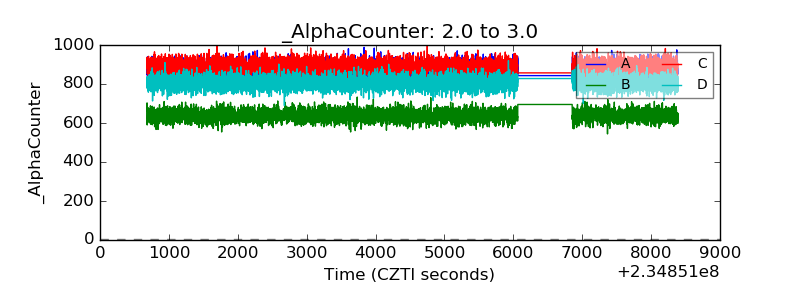 |
| _CPM_Rate | 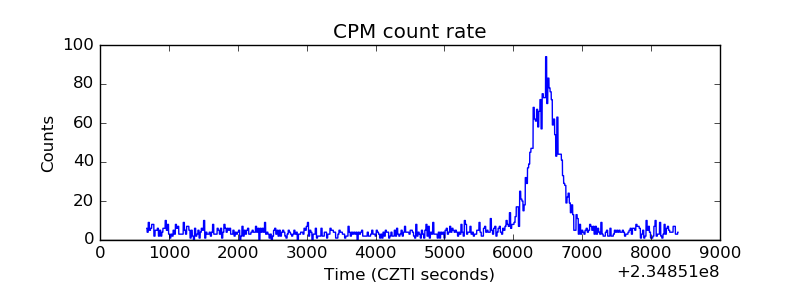 |
| CZT Counter | 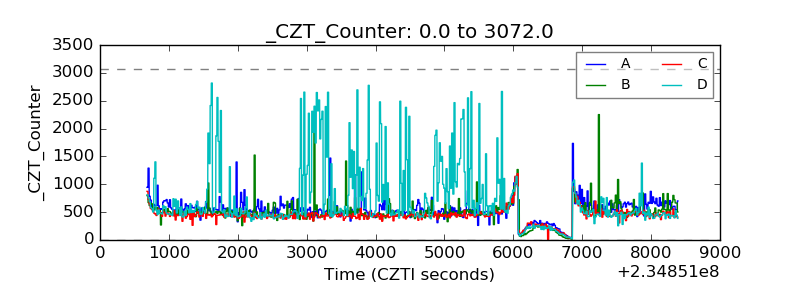 |
| +2.5 Volts monitor |  |
| +5 Volts monitor |  |
| _ROLL_ROT | 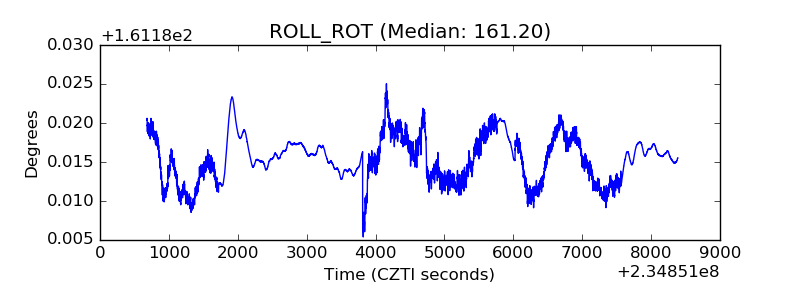 |
| _Roll_DEC | 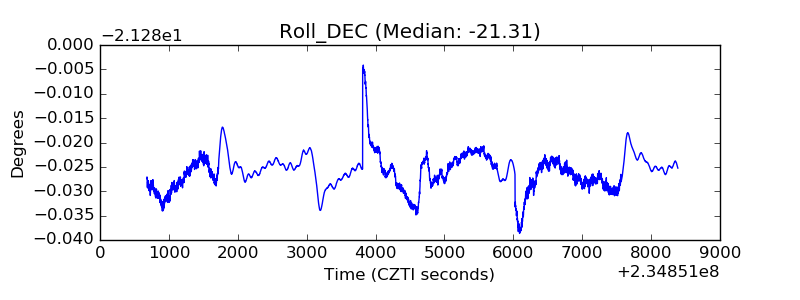 |
| _Roll_RA | 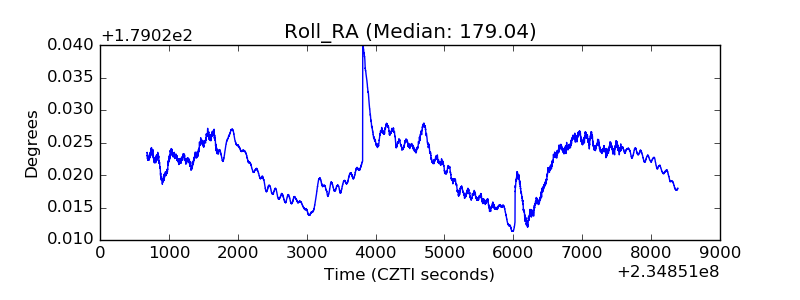 |
| Veto Counter | 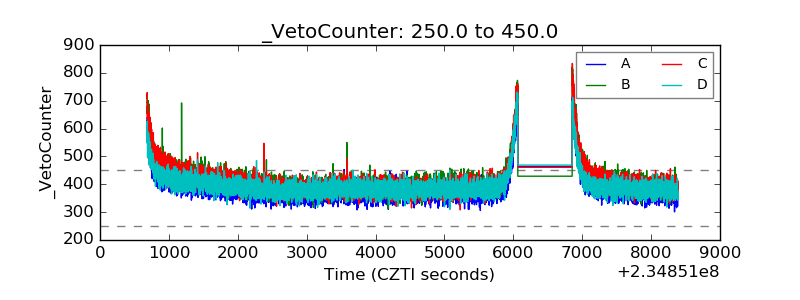 |