| Param | Original file | Final file |
|---|---|---|
| Filename | modeM0/AS1C02_042T02_9000001284_09209cztM0_level2.evt | modeM0/AS1C02_042T02_9000001284_09209cztM0_level2_quad_clean.evt |
| Size (bytes) | 581,901,120 | 78,390,720 |
| Size | 554.9 MB | 74.8 MB |
| Events in quadrant A | 4,775,325 | 467,166 |
| Events in quadrant B | 3,969,806 | 473,488 |
| Events in quadrant C | 3,544,387 | 465,472 |
| Events in quadrant D | 4,826,046 | 446,930 |
| Mode M9 | |||
|---|---|---|---|
| Quadrant | BADHDUFLAG | Total packets | Discarded packets |
| A | 0 | 3 | 0 |
| B | 0 | 3 | 0 |
| C | 0 | 3 | 0 |
| D | 0 | 4 | 0 |
| Mode SS | |||
|---|---|---|---|
| Quadrant | BADHDUFLAG | Total packets | Discarded packets |
| A | 0 | 150 | 0 |
| B | 0 | 150 | 0 |
| C | 0 | 150 | 0 |
| D | 0 | 150 | 0 |
| Mode M0 | |||
|---|---|---|---|
| Quadrant | BADHDUFLAG | Total packets | Discarded packets |
| A | 0 | 19380 | 10 |
| B | 0 | 16560 | 4 |
| C | 0 | 15593 | 6 |
| D | 0 | 19489 | 10 |
| Quadrant | Total seconds | Saturated seconds | Saturation percentage |
|---|---|---|---|
| A | 7486 | 332 | 4.434945% |
| B | 7487 | 304 | 4.060371% |
| C | 7486 | 224 | 2.992252% |
| D | 7485 | 322 | 4.301937% |
Noise dominated data is calculated using 1-second bins in cleaned event files. If a bin has >2000 counts, and if more than 50% of those come from <1% of pixels, then it is considered to be noise-dominated and hence unusable.
| Quadrant | # 1 sec bins | Bins with >0 counts | Bins with >2000 counts | High rate bins dominated by noise | Noise dominated (total time) | Noise dominated (detector-on time) | Marked lightcurve |
|---|---|---|---|---|---|---|---|
| A | 7718 | 7489 | 7 | 7 | 0.09% | 0.09% | 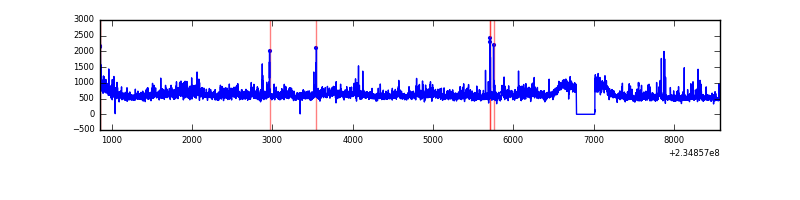 |
| B | 7718 | 7489 | 9 | 9 | 0.12% | 0.12% | 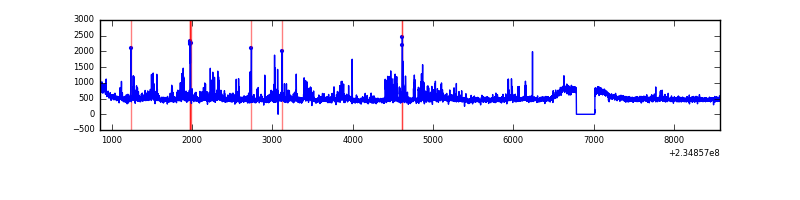 |
| C | 7718 | 7489 | 0 | 0 | 0.00% | 0.00% | 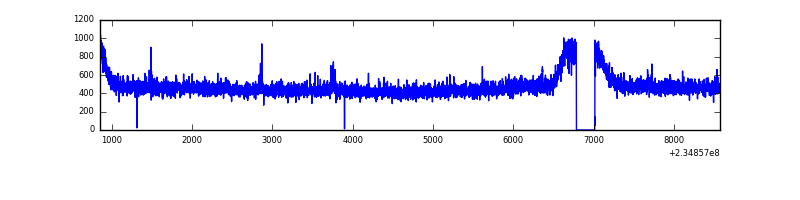 |
| D | 7718 | 7489 | 41 | 41 | 0.53% | 0.55% | 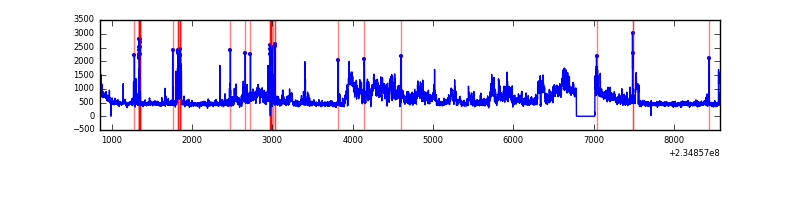 |
Top three noisy pixels from each quadrant. If the there are fewer than three noisy pixels in the level2.evt file, extra rows are filled as -1
| Pixel properties | Quadrant properties | ||||||
|---|---|---|---|---|---|---|---|
| Quadrant | DetID | PixID | Counts | Sigma | Mean | Median | Sigma |
| A | 8 | 5 | 980023 | 5153.26 | 916 | 896 | 190.0 |
| A | 1 | 162 | 129962 | 679.29 | 916 | 896 | 190.0 |
| A | 13 | 251 | 42019 | 216.44 | 916 | 896 | 190.0 |
| B | 8 | 234 | 311411 | 1733.69 | 922 | 900 | 179.1 |
| B | 12 | 111 | 19904 | 106.11 | 922 | 900 | 179.1 |
| B | 4 | 48 | 19885 | 106.0 | 922 | 900 | 179.1 |
| C | 3 | 233 | 48302 | 226.14 | 896 | 899 | 209.6 |
| C | 13 | 61 | 6838 | 28.33 | 896 | 899 | 209.6 |
| C | 8 | 222 | 2873 | 9.42 | 896 | 899 | 209.6 |
| D | 1 | 52 | 1231032 | 5602.53 | 882 | 857 | 219.6 |
| D | 9 | 64 | 126915 | 574.1 | 882 | 857 | 219.6 |
| D | 12 | 233 | 62019 | 278.55 | 882 | 857 | 219.6 |
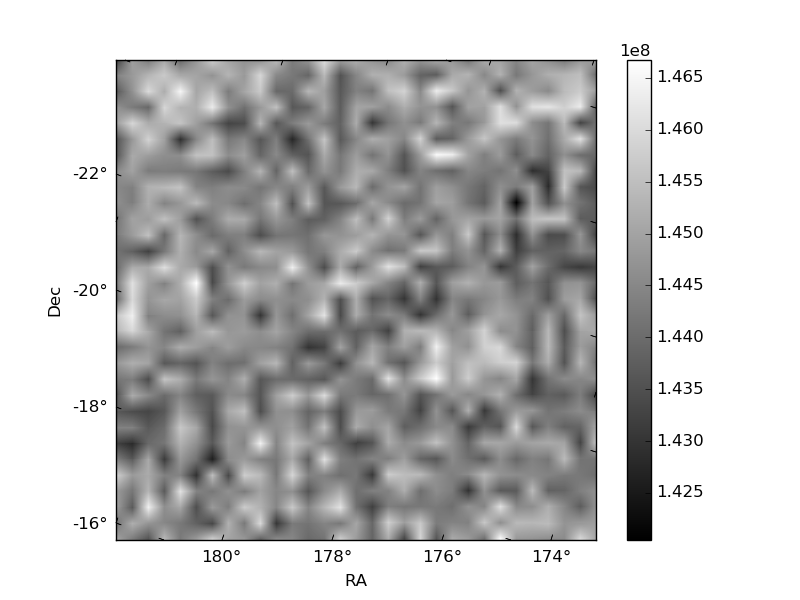
Histogram calculated using DETX and DETY for each event in the final _common_clean file
| Quadrant A | 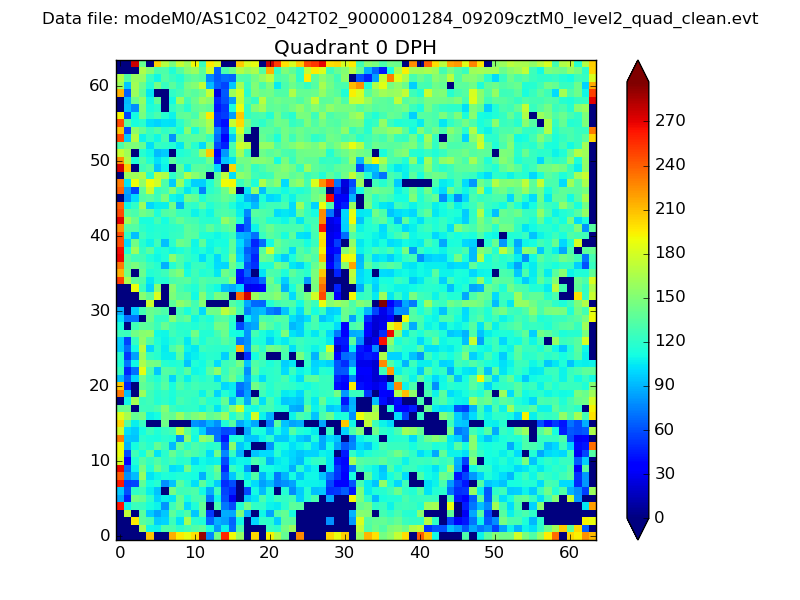 |
 |
Quadrant B |
|---|---|---|---|
| Quadrant D |  |
 |
Quadrant C |
| Plot type | Count rate plots | Images |
|---|---|---|
| Comparison with Poisson distribution Blue bars denote a histogram of data divided into 1 sec bins. Red curve is a Poisson curve with rate = median count rate of data. |
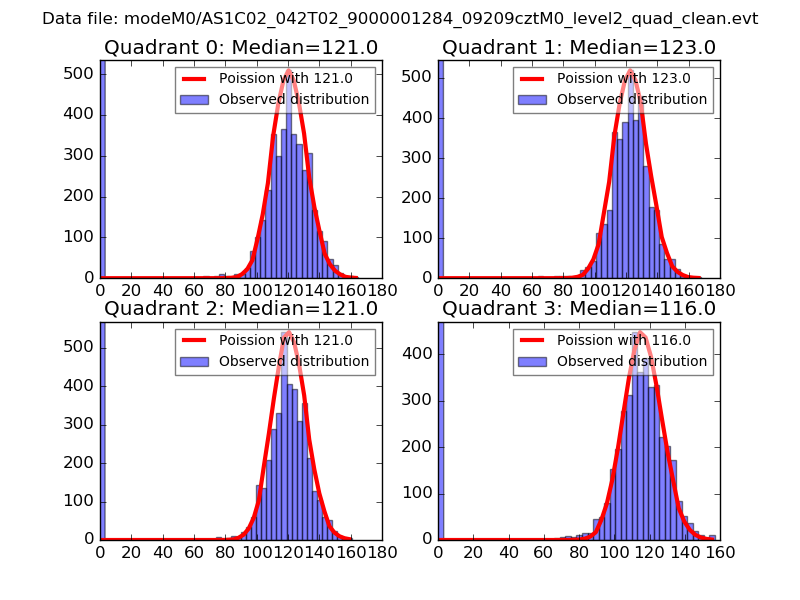 |
 |
| Quadrant-wise count rates Data is divided into 100 sec bins |
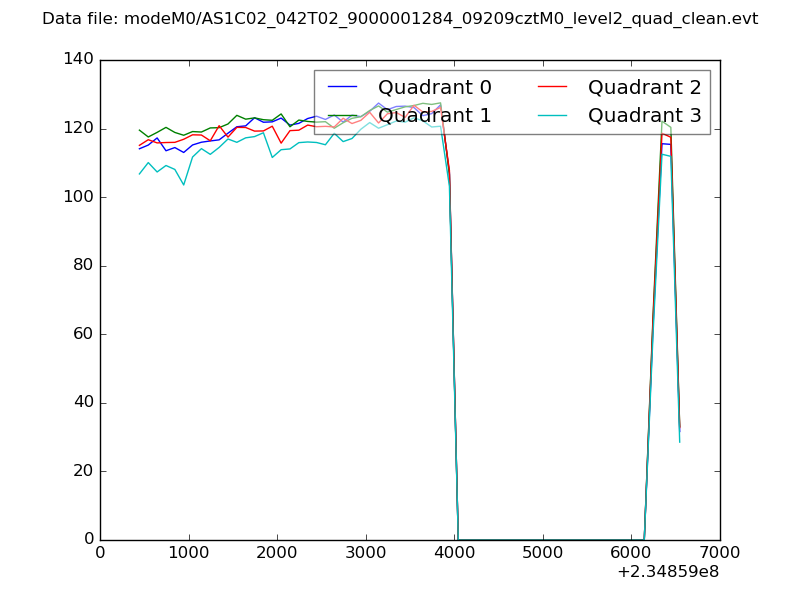 |
|
| Module-wise count rates for Quadrant A Data is divided into 100 sec bins |
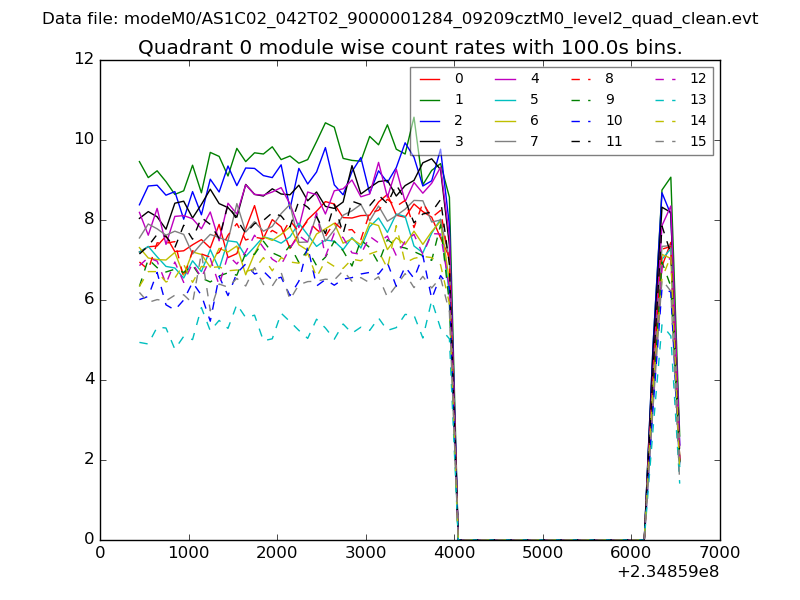 |
 |
| Module-wise count rates for Quadrant B Data is divided into 100 sec bins |
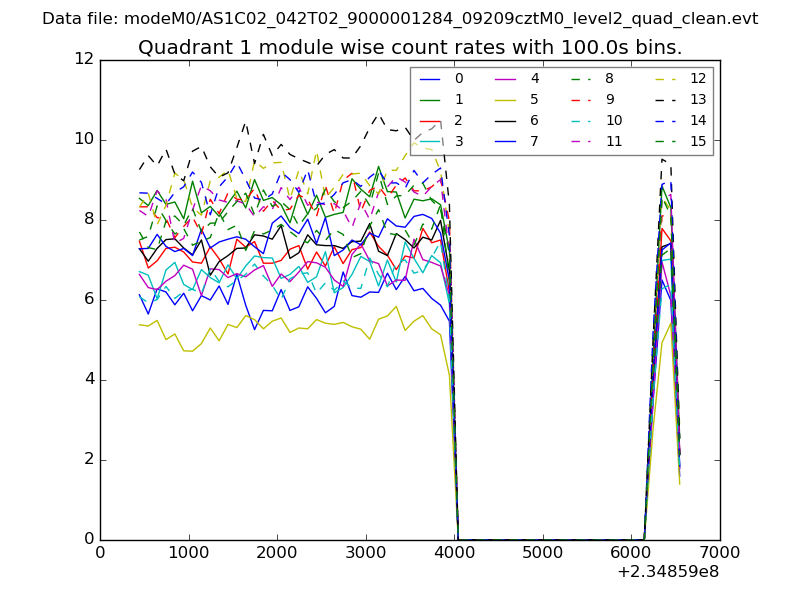 |
 |
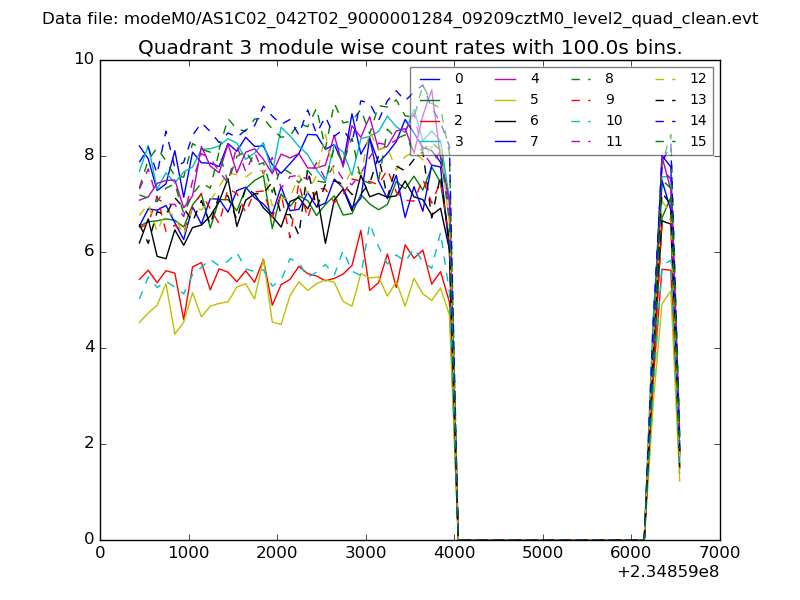
| Module-wise count rates for Quadrant C Data is divided into 100 sec bins |
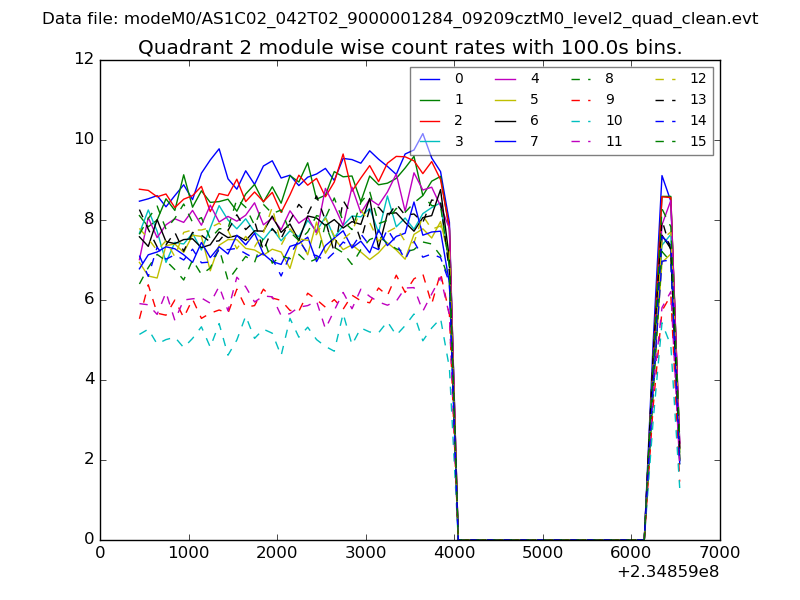 |
 |
| Module-wise count rates for Quadrant D Data is divided into 100 sec bins |
 |
 |
| Parameter | Plot |
|---|---|
| CZT HV Monitor | 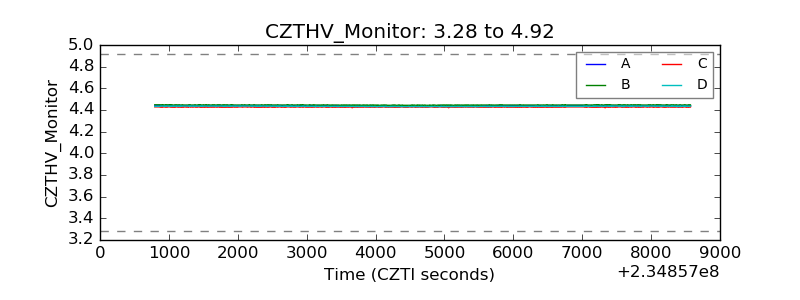 |
| D_VDD | 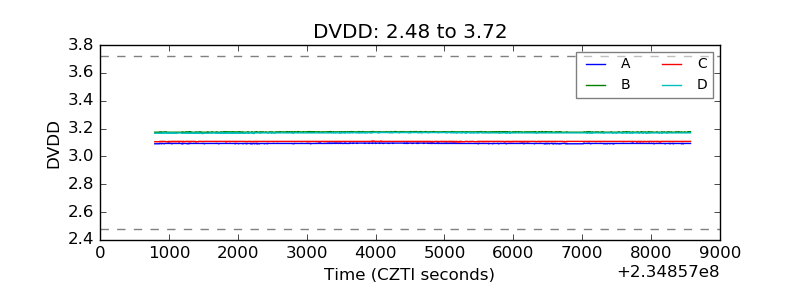 |
| Temperature 1 | 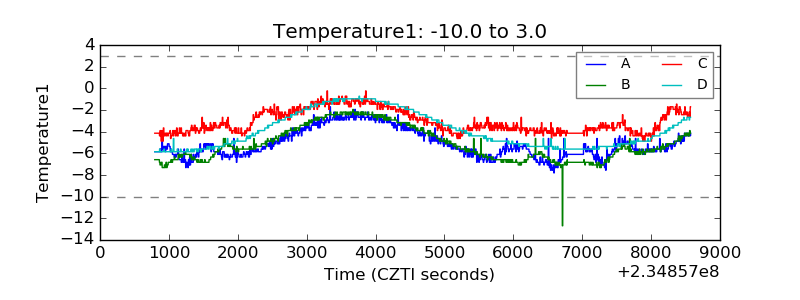 |
| Veto HV Monitor |  |
| Veto LLD | 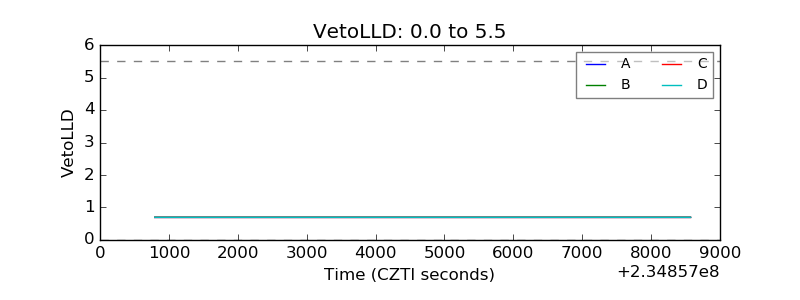 |
| Alpha Counter | 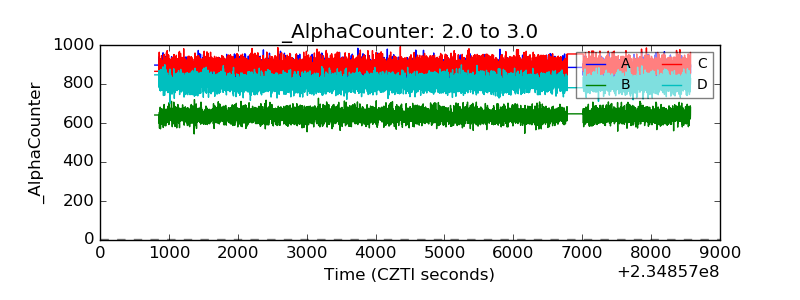 |
| _CPM_Rate | 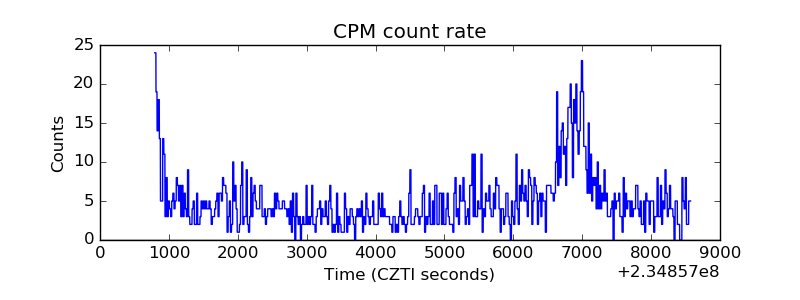 |
| CZT Counter | 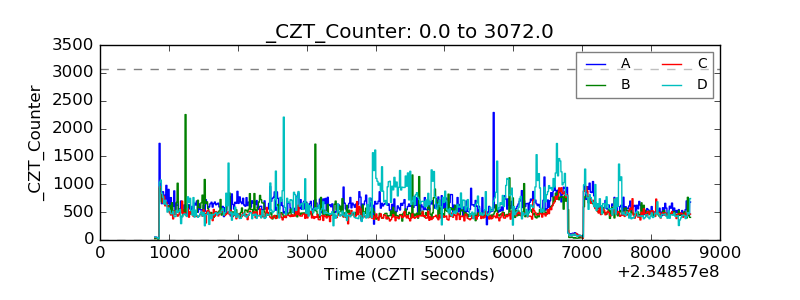 |
| +2.5 Volts monitor |  |
| +5 Volts monitor |  |
| _ROLL_ROT | 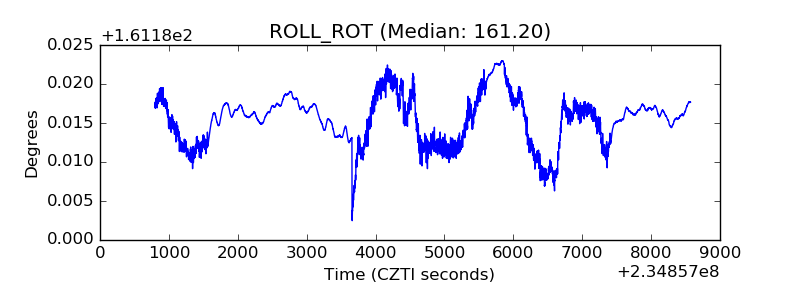 |
| _Roll_DEC | 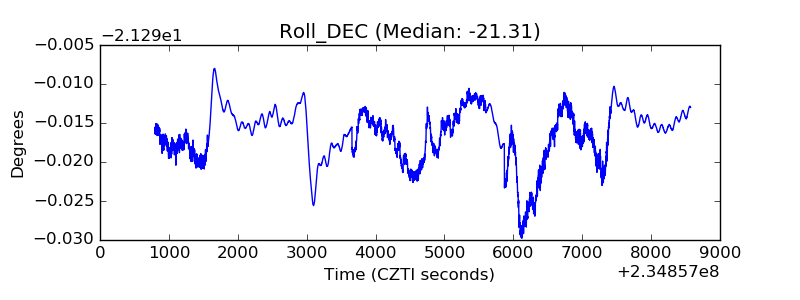 |
| _Roll_RA | 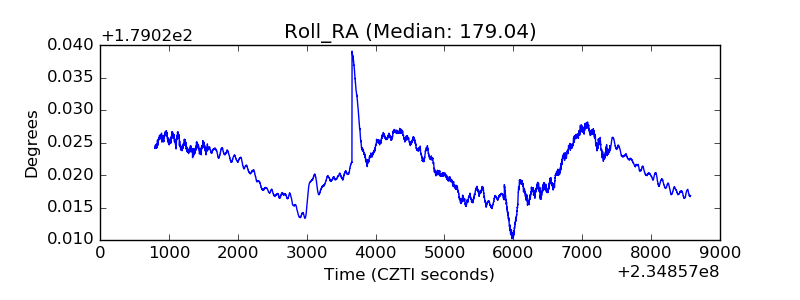 |
| Veto Counter | 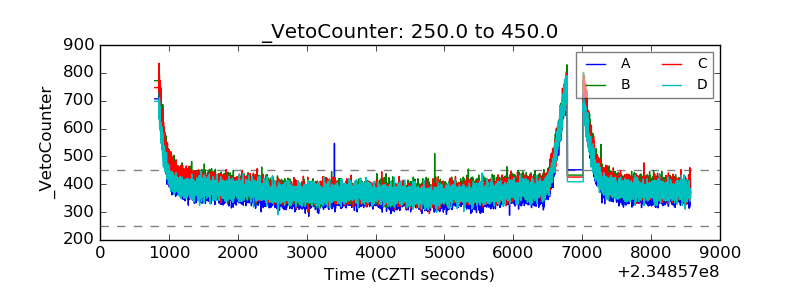 |