| Param | Original file | Final file |
|---|---|---|
| Filename | modeM0/AS1C02_042T02_9000001284_09210cztM0_level2.evt | modeM0/AS1C02_042T02_9000001284_09210cztM0_level2_quad_clean.evt |
| Size (bytes) | 222,661,440 | 37,892,160 |
| Size | 212.3 MB | 36.1 MB |
| Events in quadrant A | 1,784,903 | 230,664 |
| Events in quadrant B | 1,540,233 | 237,608 |
| Events in quadrant C | 1,583,843 | 232,900 |
| Events in quadrant D | 1,618,326 | 222,742 |
| Mode M9 | |||
|---|---|---|---|
| Quadrant | BADHDUFLAG | Total packets | Discarded packets |
| A | 0 | 3 | 0 |
| B | 0 | 3 | 0 |
| C | 0 | 3 | 0 |
| D | 0 | 3 | 1 |
| Mode SS | |||
|---|---|---|---|
| Quadrant | BADHDUFLAG | Total packets | Discarded packets |
| A | 0 | 84 | 18 |
| B | 0 | 84 | 18 |
| C | 0 | 84 | 26 |
| D | 0 | 84 | 18 |
| Mode M0 | |||
|---|---|---|---|
| Quadrant | BADHDUFLAG | Total packets | Discarded packets |
| A | 0 | 9563 | 2384 |
| B | 0 | 8799 | 2148 |
| C | 0 | 8983 | 2145 |
| D | 0 | 9513 | 2500 |
| Quadrant | Total seconds | Saturated seconds | Saturation percentage |
|---|---|---|---|
| A | 3111 | 225 | 7.232401% |
| B | 3150 | 194 | 6.158730% |
| C | 3161 | 149 | 4.713698% |
| D | 3076 | 177 | 5.754226% |
Noise dominated data is calculated using 1-second bins in cleaned event files. If a bin has >2000 counts, and if more than 50% of those come from <1% of pixels, then it is considered to be noise-dominated and hence unusable.
| Quadrant | # 1 sec bins | Bins with >0 counts | Bins with >2000 counts | High rate bins dominated by noise | Noise dominated (total time) | Noise dominated (detector-on time) | Marked lightcurve |
|---|---|---|---|---|---|---|---|
| A | 4386 | 3796 | 0 | 0 | 0.00% | 0.00% | 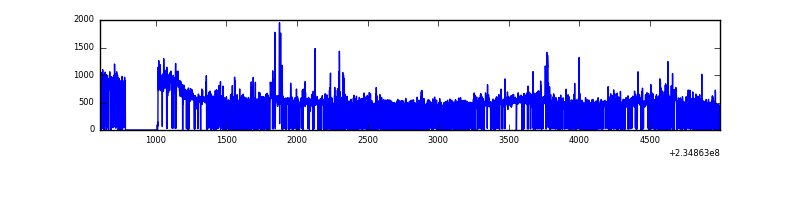 |
| B | 4388 | 3832 | 0 | 0 | 0.00% | 0.00% | 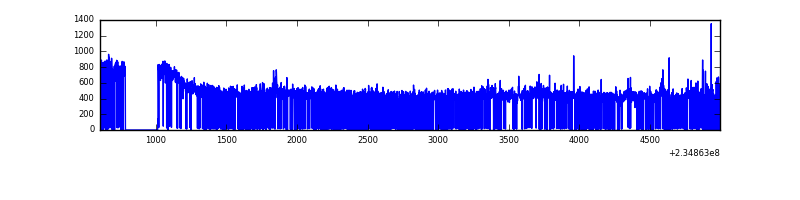 |
| C | 4387 | 3823 | 0 | 0 | 0.00% | 0.00% | 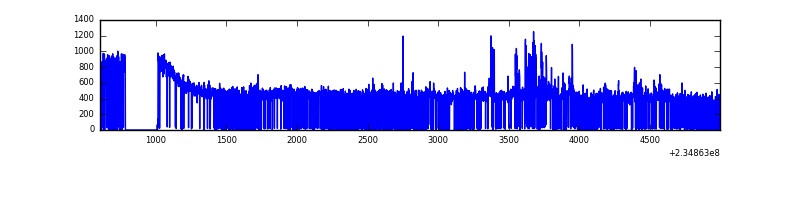 |
| D | 4387 | 3760 | 4 | 4 | 0.09% | 0.11% | 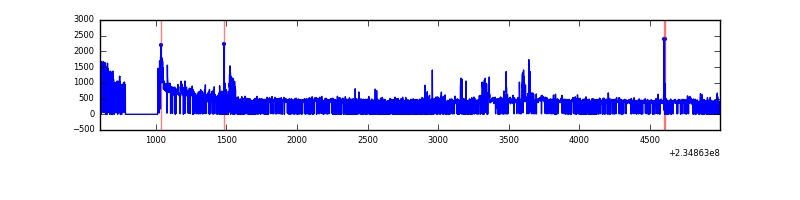 |
Top three noisy pixels from each quadrant. If the there are fewer than three noisy pixels in the level2.evt file, extra rows are filled as -1
| Pixel properties | Quadrant properties | ||||||
|---|---|---|---|---|---|---|---|
| Quadrant | DetID | PixID | Counts | Sigma | Mean | Median | Sigma |
| A | 8 | 5 | 209146 | 2615.43 | 380 | 371 | 79.8 |
| A | 1 | 162 | 44706 | 555.41 | 380 | 371 | 79.8 |
| A | 13 | 251 | 43038 | 534.51 | 380 | 371 | 79.8 |
| B | 0 | 214 | 14775 | 186.71 | 385 | 374 | 77.1 |
| B | 0 | 230 | 9895 | 123.44 | 385 | 374 | 77.1 |
| B | 12 | 111 | 8185 | 101.27 | 385 | 374 | 77.1 |
| C | 3 | 233 | 113088 | 1262.75 | 376 | 376 | 89.3 |
| C | 13 | 61 | 2898 | 28.25 | 376 | 376 | 89.3 |
| C | 12 | 4 | 1028 | 7.3 | 376 | 376 | 89.3 |
| D | 1 | 52 | 185745 | 2004.77 | 362 | 351 | 92.5 |
| D | 9 | 64 | 25586 | 272.88 | 362 | 351 | 92.5 |
| D | 2 | 234 | 16050 | 169.76 | 362 | 351 | 92.5 |
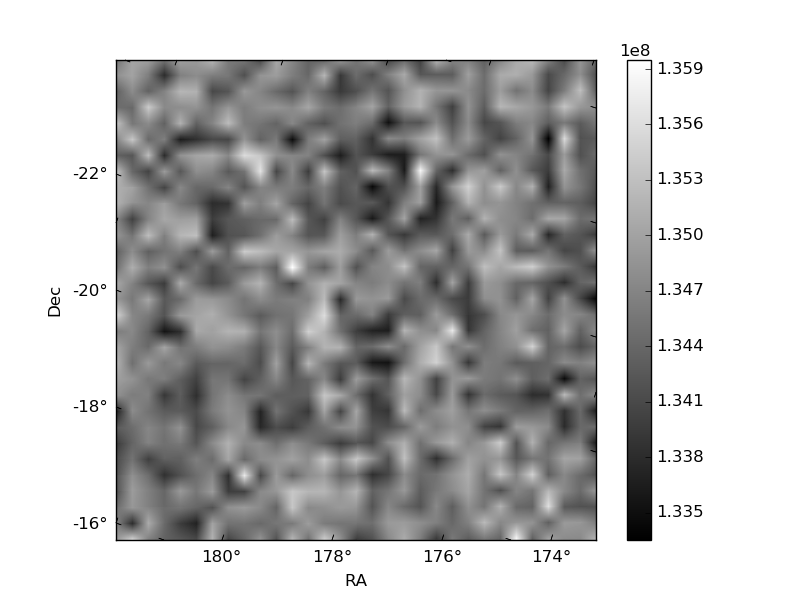
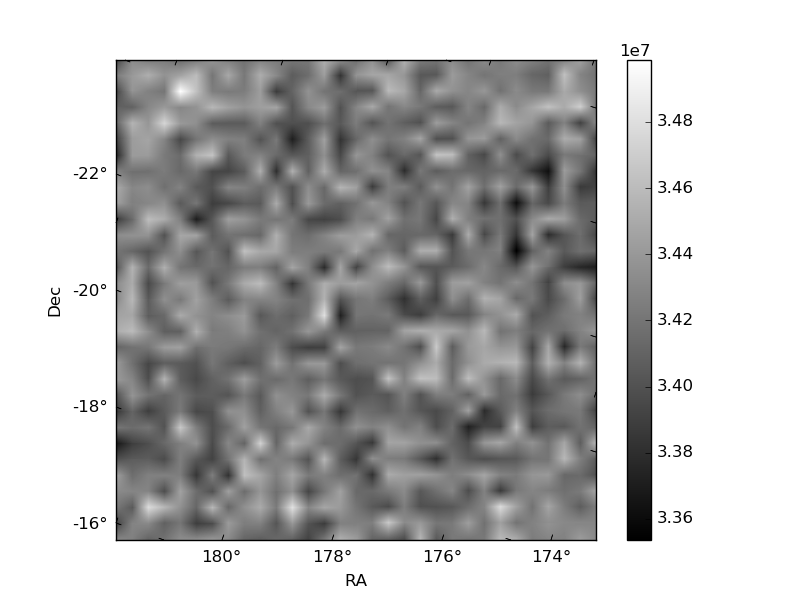
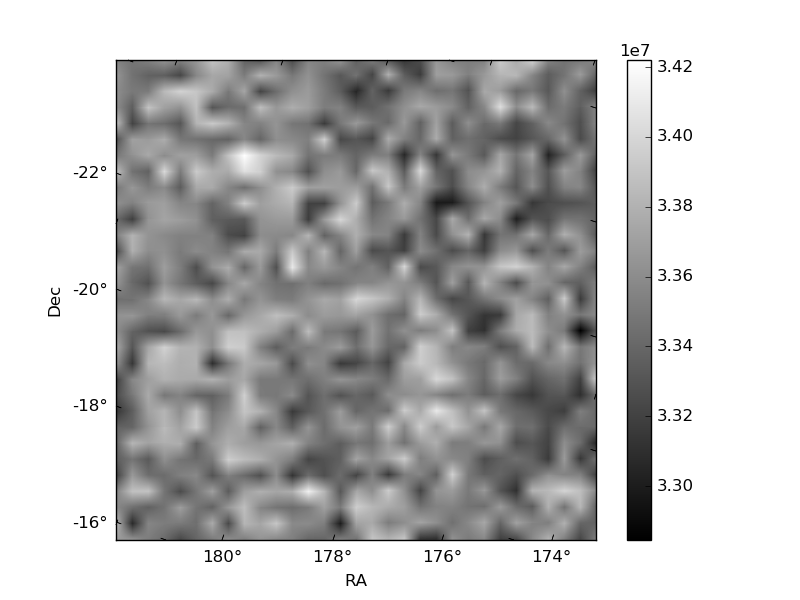
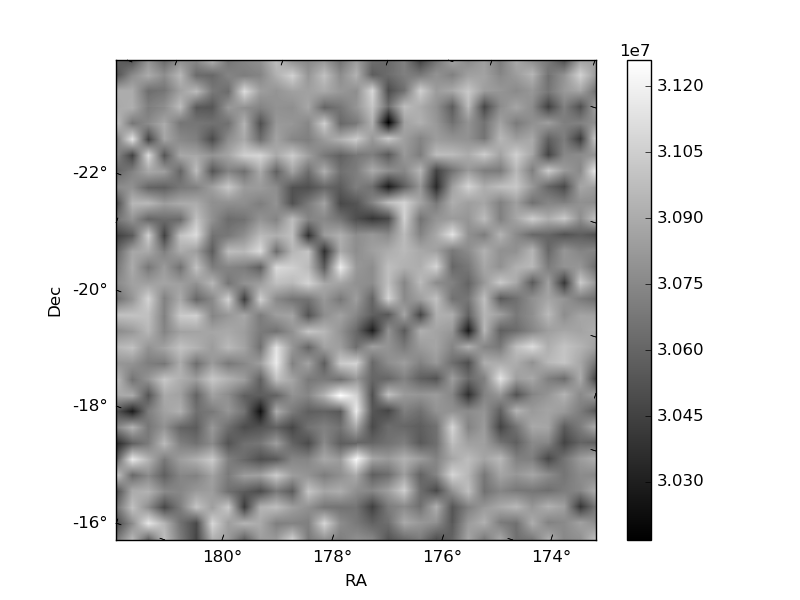
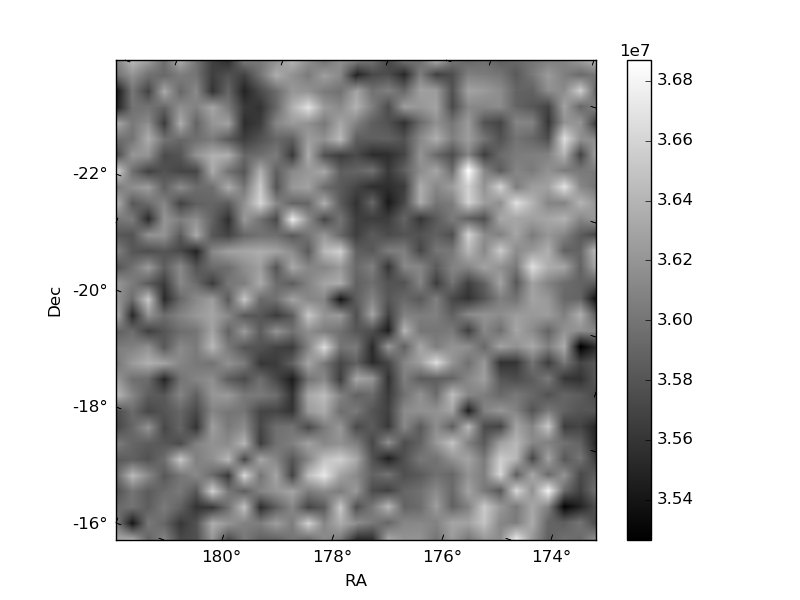
Histogram calculated using DETX and DETY for each event in the final _common_clean file
| Quadrant A | 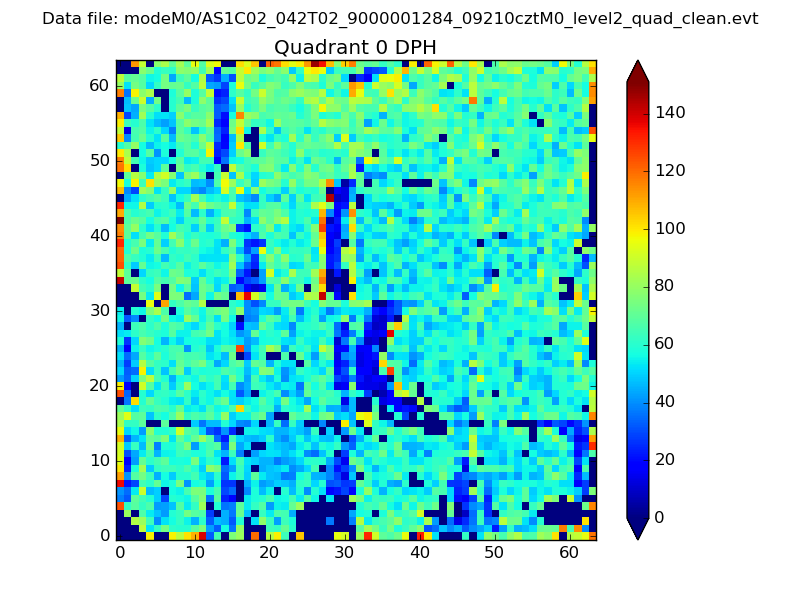 |
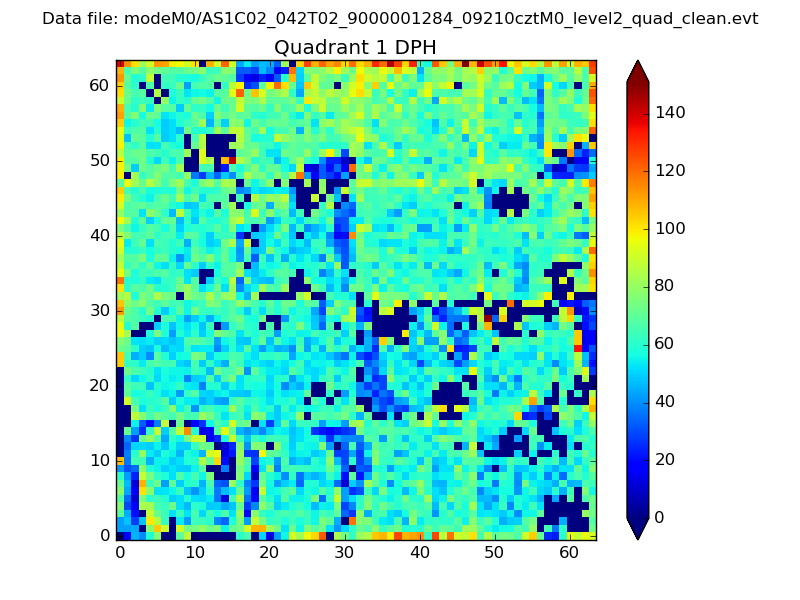 |
Quadrant B |
|---|---|---|---|
| Quadrant D | 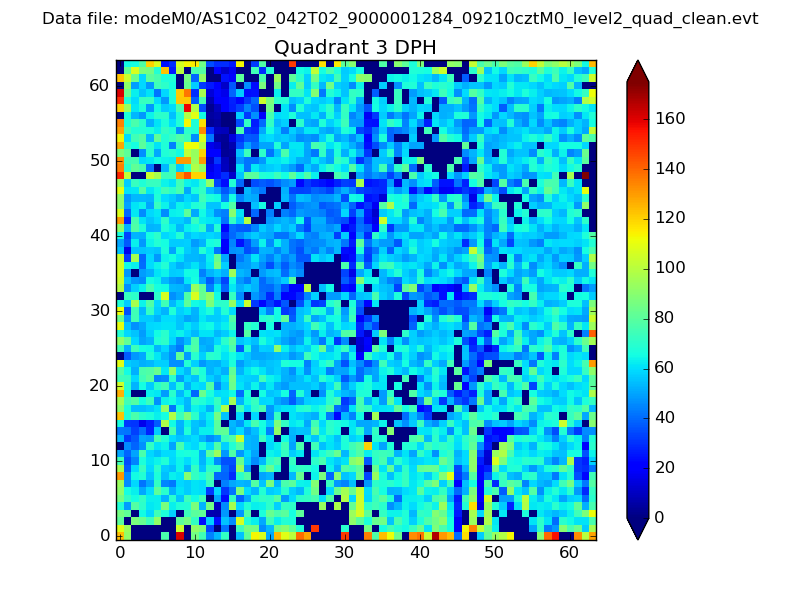 |
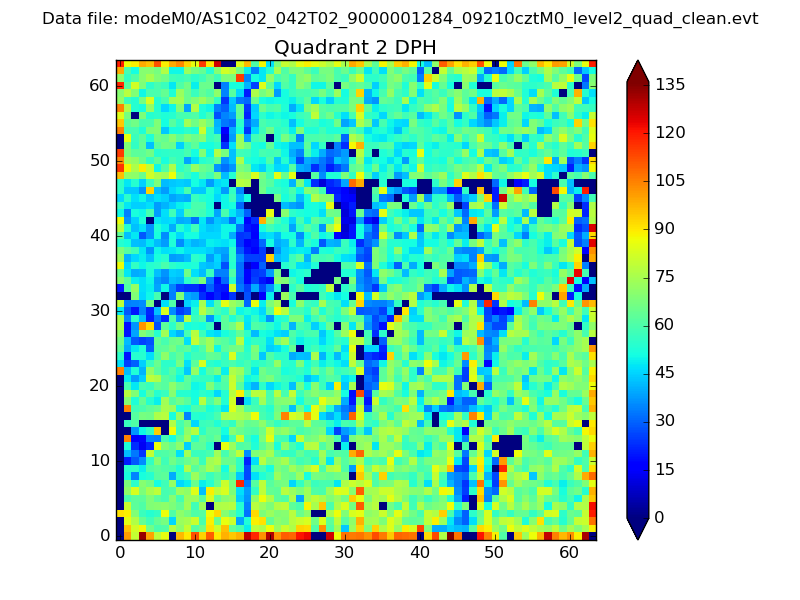 |
Quadrant C |
| Plot type | Count rate plots | Images |
|---|---|---|
| Comparison with Poisson distribution Blue bars denote a histogram of data divided into 1 sec bins. Red curve is a Poisson curve with rate = median count rate of data. |
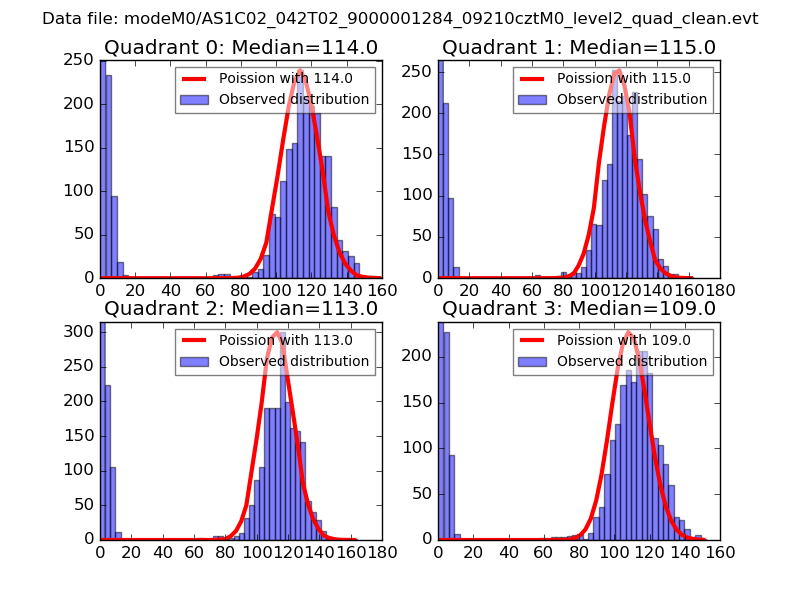 |
 |
| Quadrant-wise count rates Data is divided into 100 sec bins |
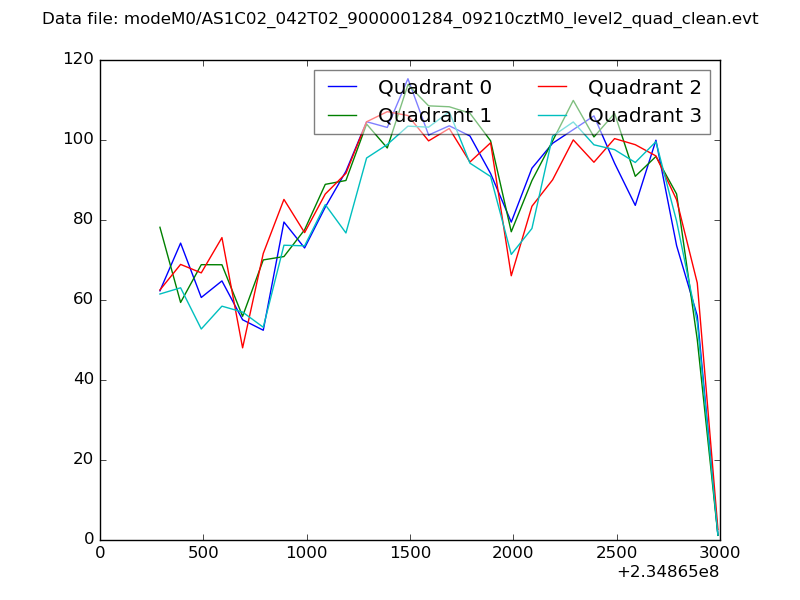 |
|
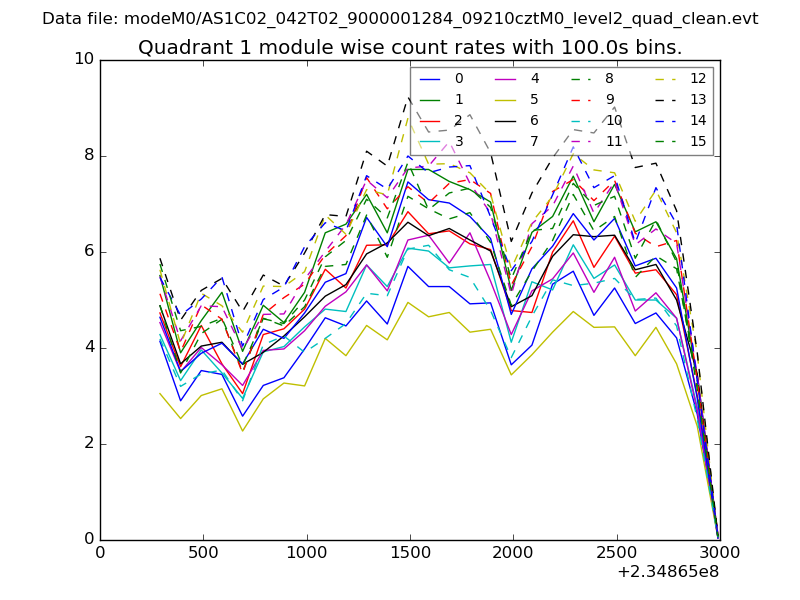
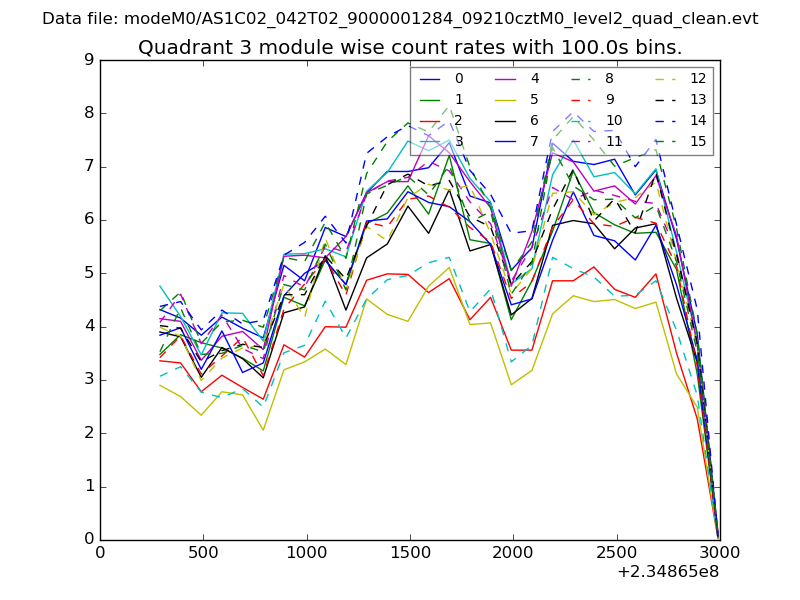
| Module-wise count rates for Quadrant A Data is divided into 100 sec bins |
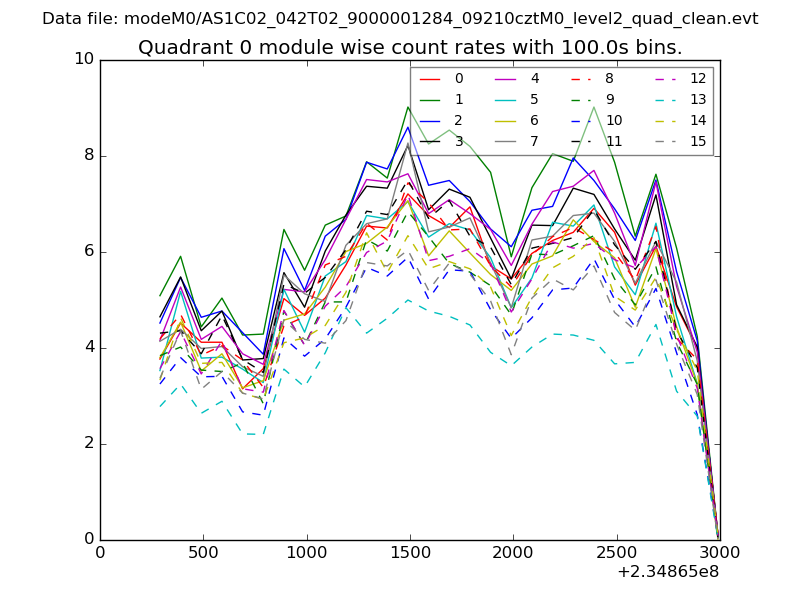 |
 |
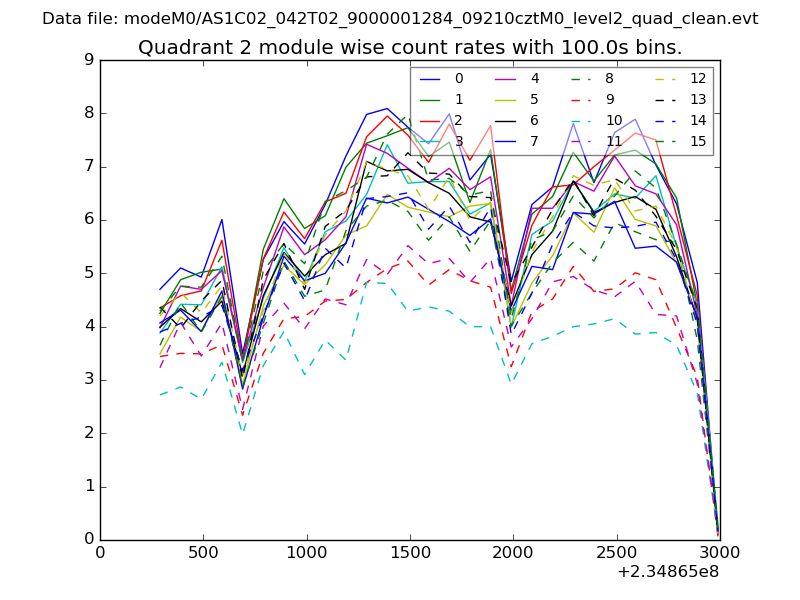
| Module-wise count rates for Quadrant B Data is divided into 100 sec bins |
 |
 |
| Module-wise count rates for Quadrant C Data is divided into 100 sec bins |
 |
 |
| Module-wise count rates for Quadrant D Data is divided into 100 sec bins |
 |
 |
| Parameter | Plot |
|---|---|
| CZT HV Monitor | 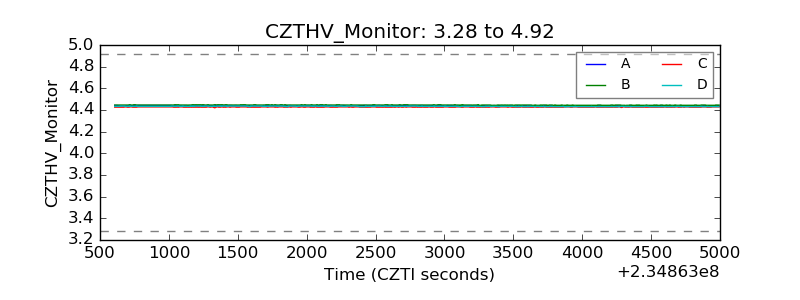 |
| D_VDD | 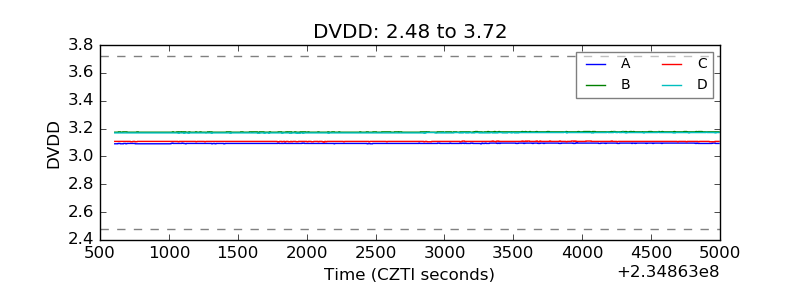 |
| Temperature 1 | 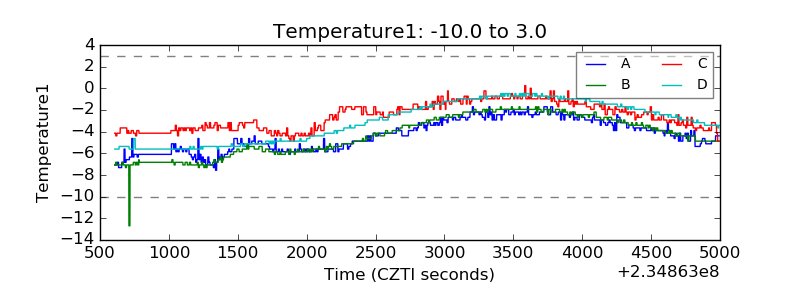 |
| Veto HV Monitor | 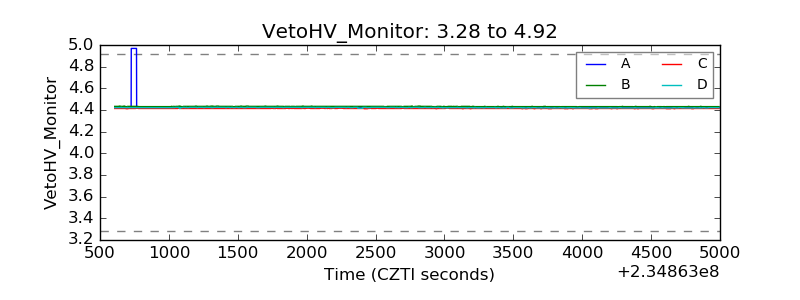 |
| Veto LLD | 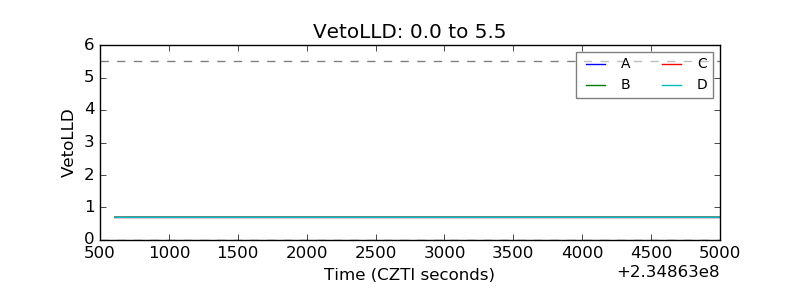 |
| Alpha Counter | 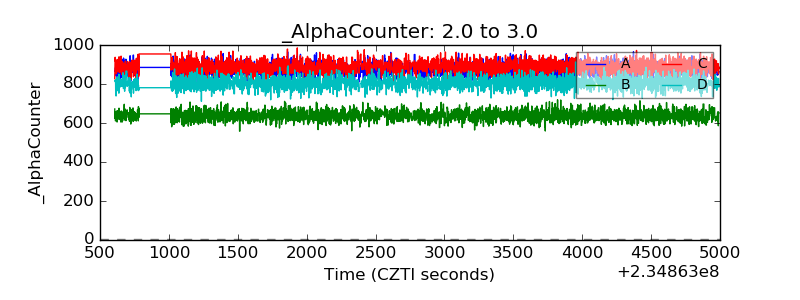 |
| _CPM_Rate | 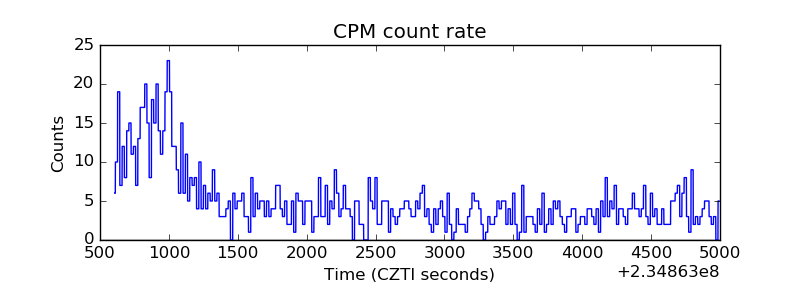 |
| CZT Counter | 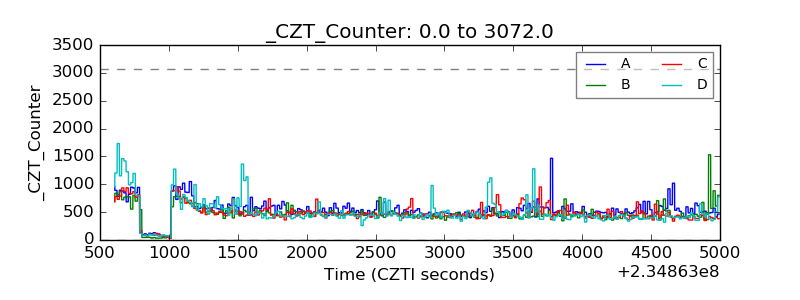 |
| +2.5 Volts monitor | 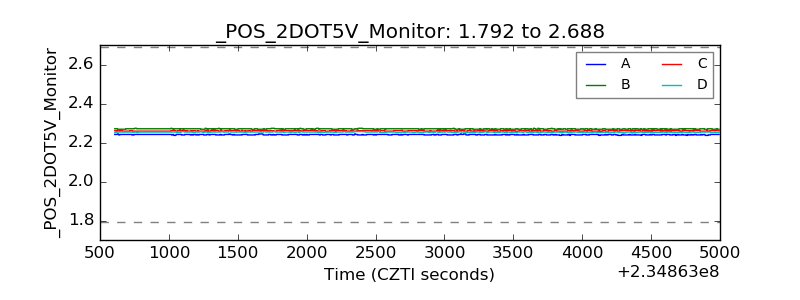 |
| +5 Volts monitor | 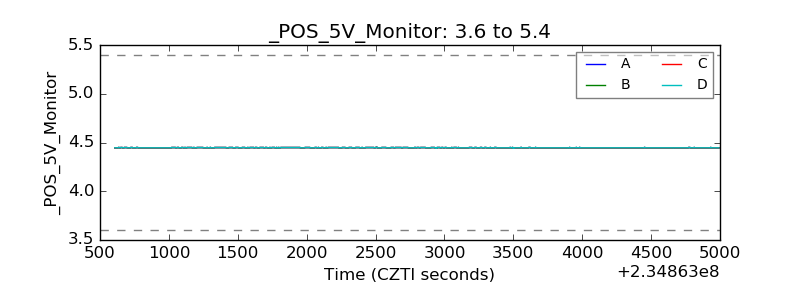 |
| _ROLL_ROT | 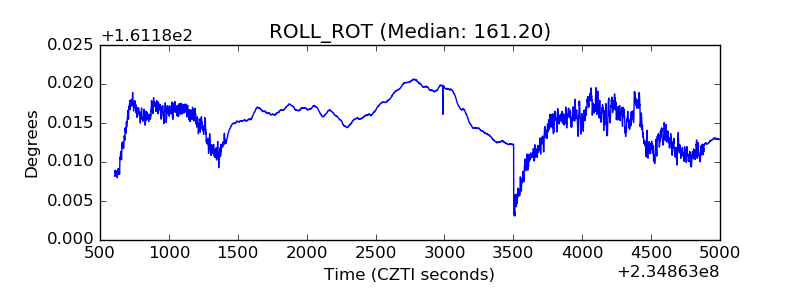 |
| _Roll_DEC | 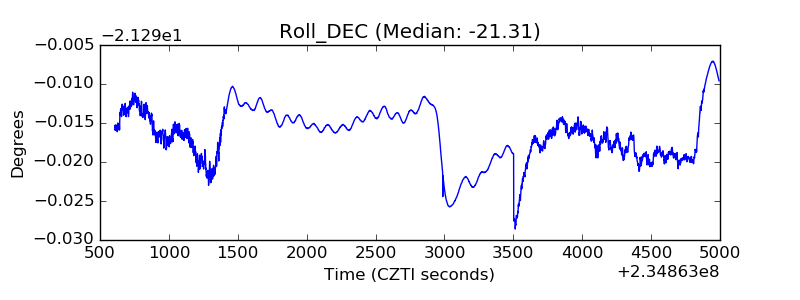 |
| _Roll_RA | 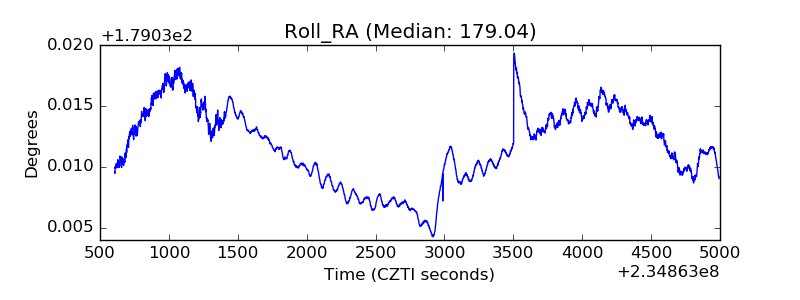 |
| Veto Counter | 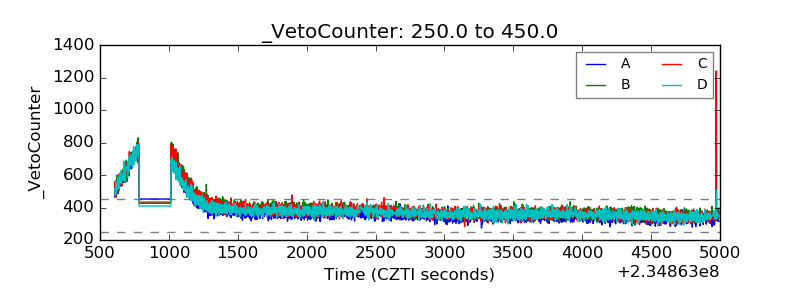 |