| Param | Original file | Final file |
|---|---|---|
| Filename | modeM0/AS1C02_042T02_9000001284_09214cztM0_level2.evt | modeM0/AS1C02_042T02_9000001284_09214cztM0_level2_quad_clean.evt |
| Size (bytes) | 200,603,520 | 48,349,440 |
| Size | 191.3 MB | 46.1 MB |
| Events in quadrant A | 1,610,404 | 313,278 |
| Events in quadrant B | 1,400,191 | 318,487 |
| Events in quadrant C | 1,438,290 | 311,413 |
| Events in quadrant D | 1,416,712 | 303,273 |
| Mode SS | |||
|---|---|---|---|
| Quadrant | BADHDUFLAG | Total packets | Discarded packets |
| A | 0 | 62 | 4 |
| B | 0 | 62 | 0 |
| C | 0 | 62 | 0 |
| D | 0 | 62 | 2 |
| Mode M0 | |||
|---|---|---|---|
| Quadrant | BADHDUFLAG | Total packets | Discarded packets |
| A | 0 | 6694 | 112 |
| B | 0 | 6308 | 87 |
| C | 0 | 6473 | 81 |
| D | 0 | 6494 | 86 |
| Quadrant | Total seconds | Saturated seconds | Saturation percentage |
|---|---|---|---|
| A | 3046 | 5 | 0.164150% |
| B | 3054 | 0 | 0.000000% |
| C | 3056 | 3 | 0.098168% |
| D | 3056 | 6 | 0.196335% |
Noise dominated data is calculated using 1-second bins in cleaned event files. If a bin has >2000 counts, and if more than 50% of those come from <1% of pixels, then it is considered to be noise-dominated and hence unusable.
| Quadrant | # 1 sec bins | Bins with >0 counts | Bins with >2000 counts | High rate bins dominated by noise | Noise dominated (total time) | Noise dominated (detector-on time) | Marked lightcurve |
|---|---|---|---|---|---|---|---|
| A | 3096 | 3093 | 0 | 0 | 0.00% | 0.00% | 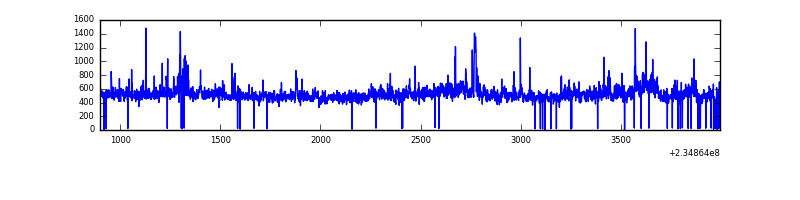 |
| B | 3096 | 3096 | 0 | 0 | 0.00% | 0.00% | 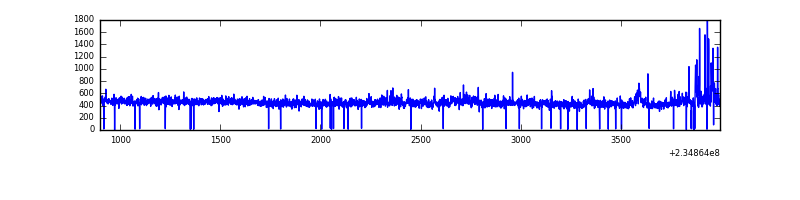 |
| C | 3096 | 3096 | 3 | 3 | 0.10% | 0.10% | 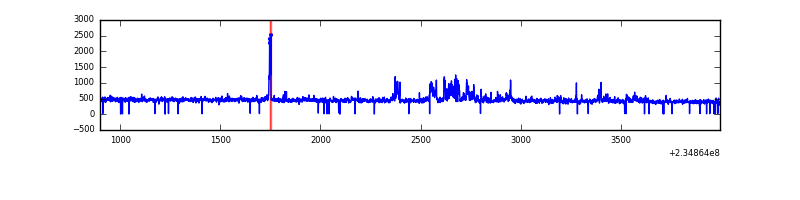 |
| D | 3096 | 3095 | 7 | 7 | 0.23% | 0.23% | 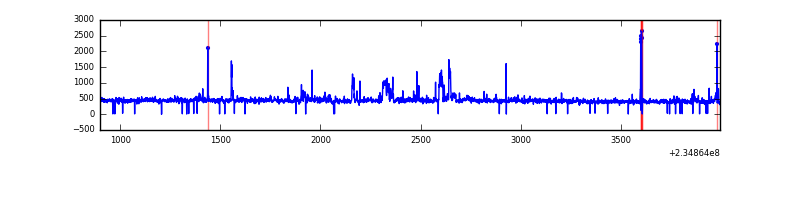 |
Top three noisy pixels from each quadrant. If the there are fewer than three noisy pixels in the level2.evt file, extra rows are filled as -1
| Pixel properties | Quadrant properties | ||||||
|---|---|---|---|---|---|---|---|
| Quadrant | DetID | PixID | Counts | Sigma | Mean | Median | Sigma |
| A | 8 | 5 | 160691 | 2235.84 | 345 | 338 | 71.7 |
| A | 13 | 251 | 49541 | 686.05 | 345 | 338 | 71.7 |
| A | 1 | 162 | 42379 | 586.19 | 345 | 338 | 71.7 |
| B | 8 | 234 | 23999 | 348.56 | 343 | 335 | 67.9 |
| B | 0 | 214 | 17686 | 255.57 | 343 | 335 | 67.9 |
| B | 0 | 230 | 11582 | 165.66 | 343 | 335 | 67.9 |
| C | 3 | 233 | 141500 | 1813.96 | 332 | 333 | 77.8 |
| C | 13 | 61 | 2588 | 28.98 | 332 | 333 | 77.8 |
| C | 12 | 4 | 921 | 7.56 | 332 | 333 | 77.8 |
| D | 1 | 52 | 98918 | 1130.52 | 335 | 326 | 87.2 |
| D | 2 | 234 | 16999 | 191.18 | 335 | 326 | 87.2 |
| D | 12 | 233 | 11108 | 123.63 | 335 | 326 | 87.2 |
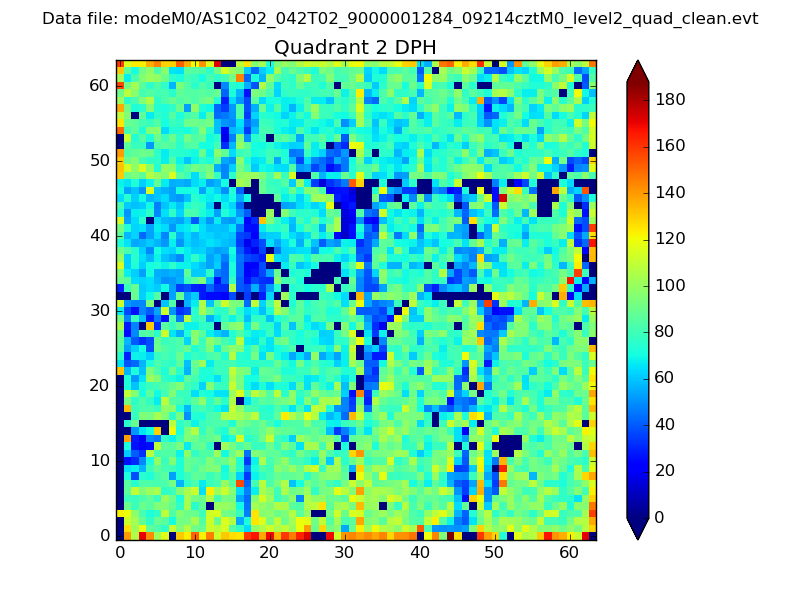
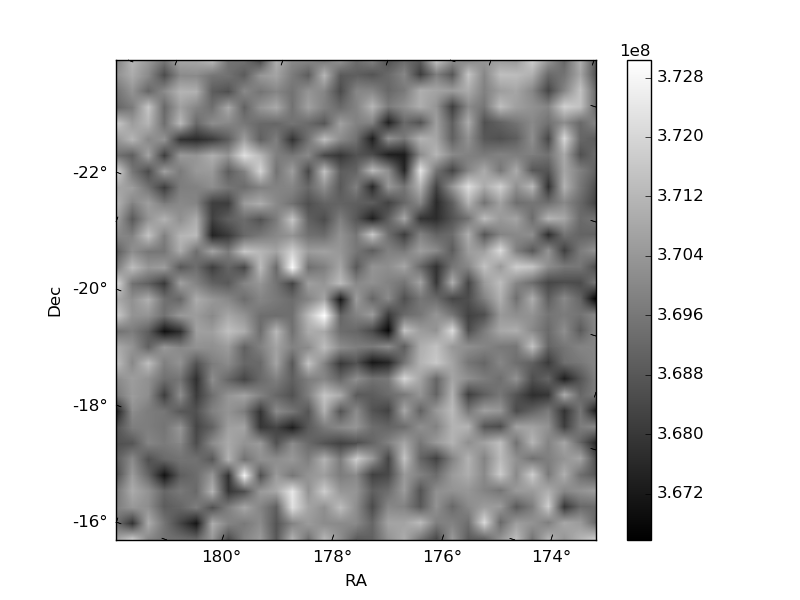
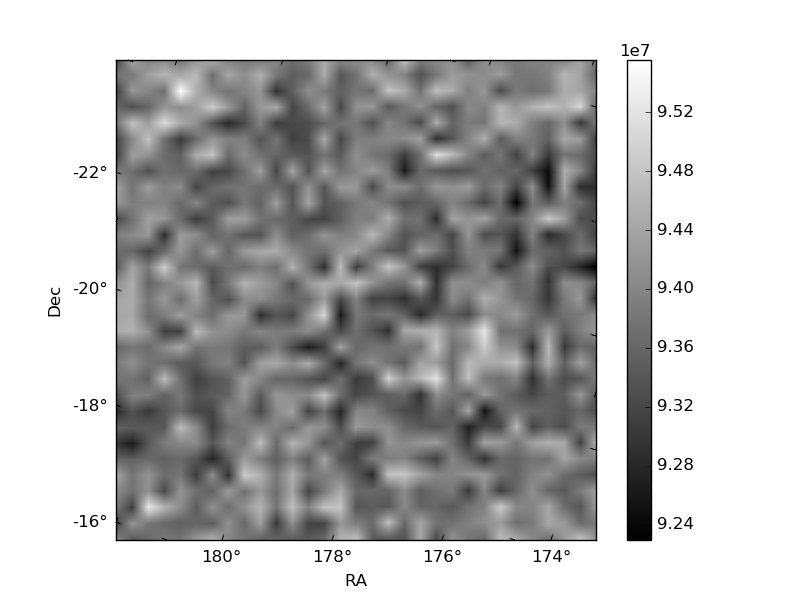
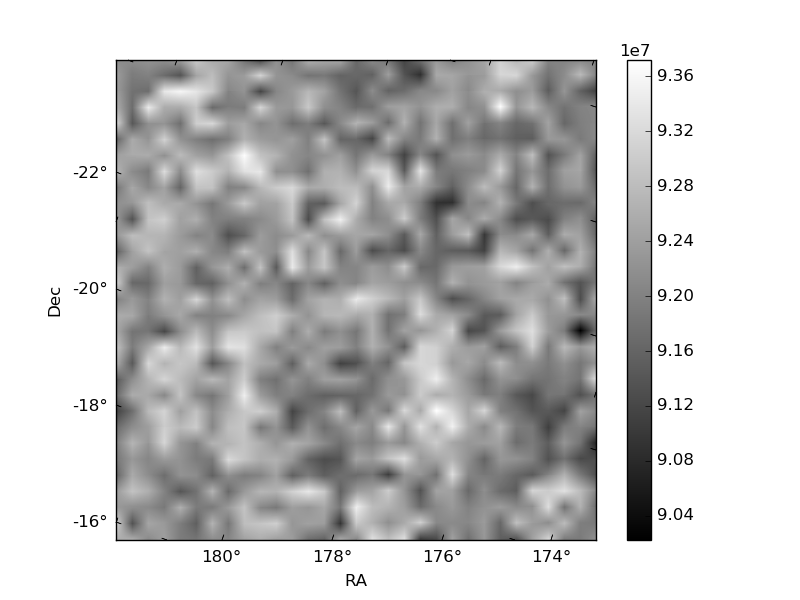
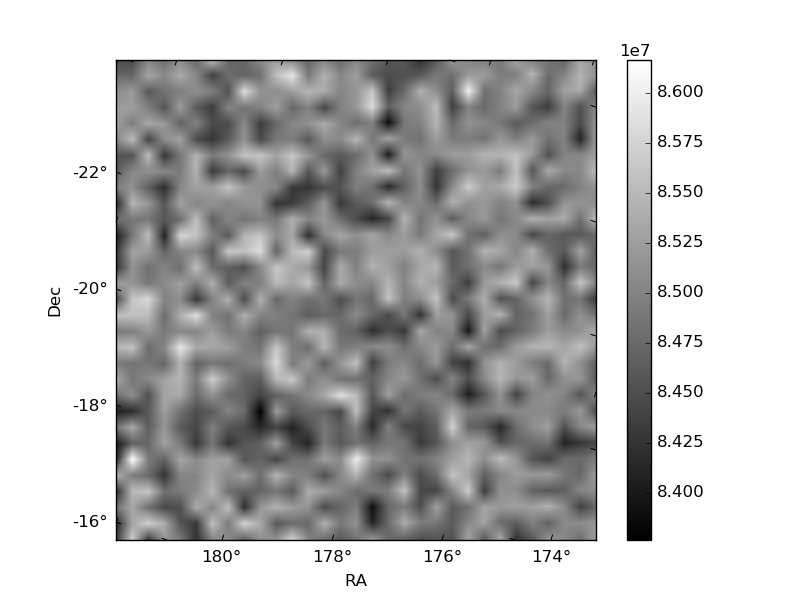
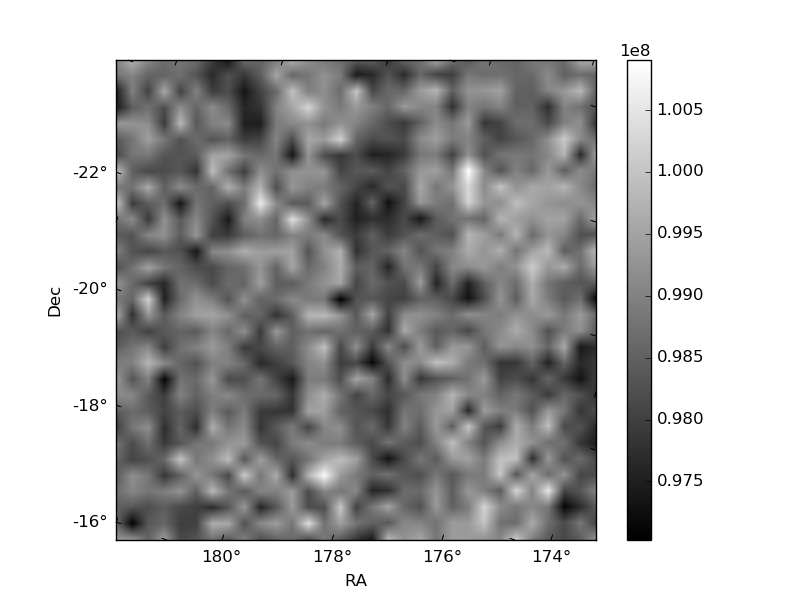
Histogram calculated using DETX and DETY for each event in the final _common_clean file
| Quadrant A | 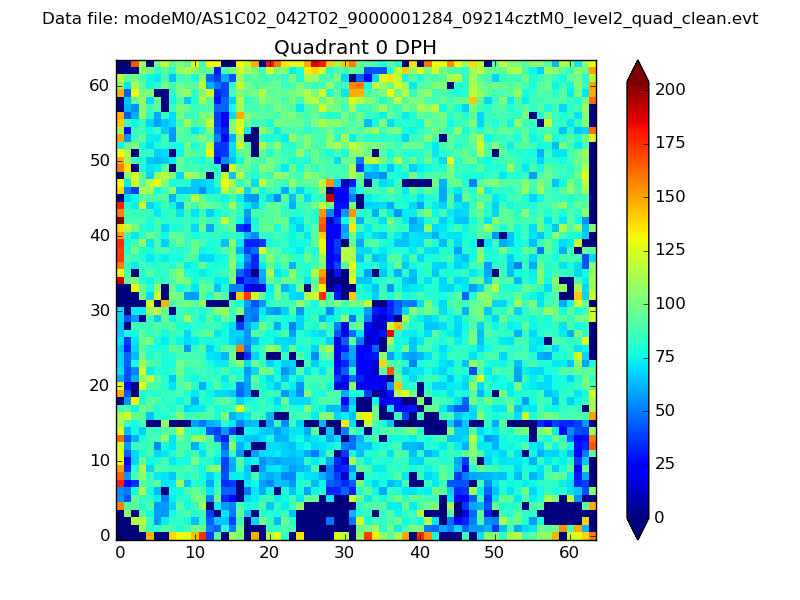 |
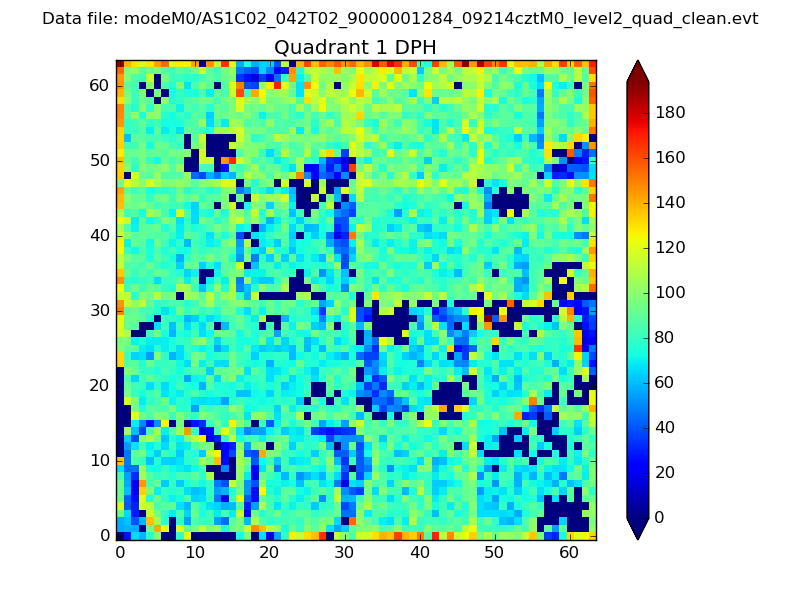 |
Quadrant B |
|---|---|---|---|
| Quadrant D | 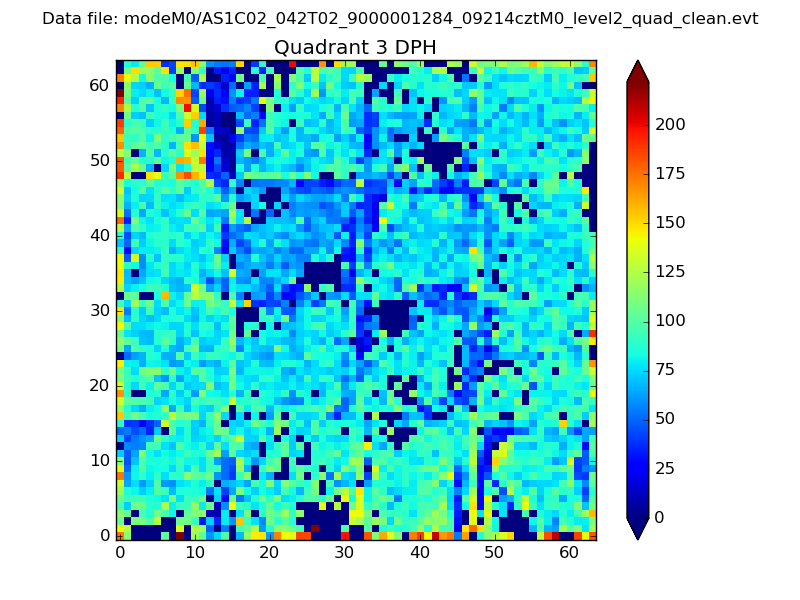 |
 |
Quadrant C |
| Plot type | Count rate plots | Images |
|---|---|---|
| Comparison with Poisson distribution Blue bars denote a histogram of data divided into 1 sec bins. Red curve is a Poisson curve with rate = median count rate of data. |
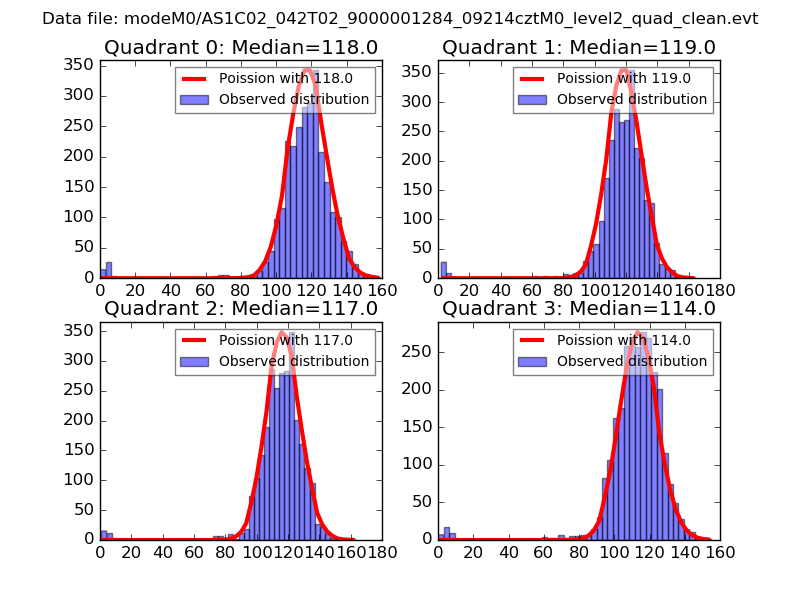 |
 |
| Quadrant-wise count rates Data is divided into 100 sec bins |
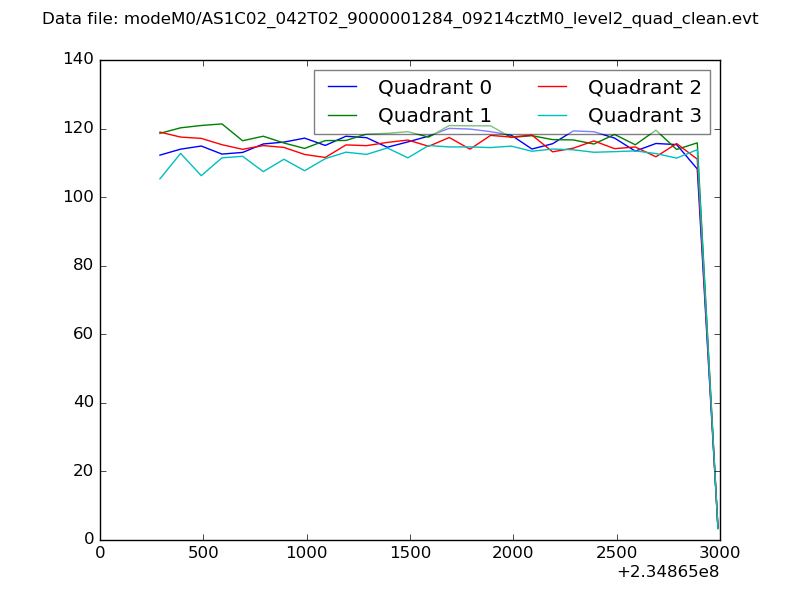 |
|
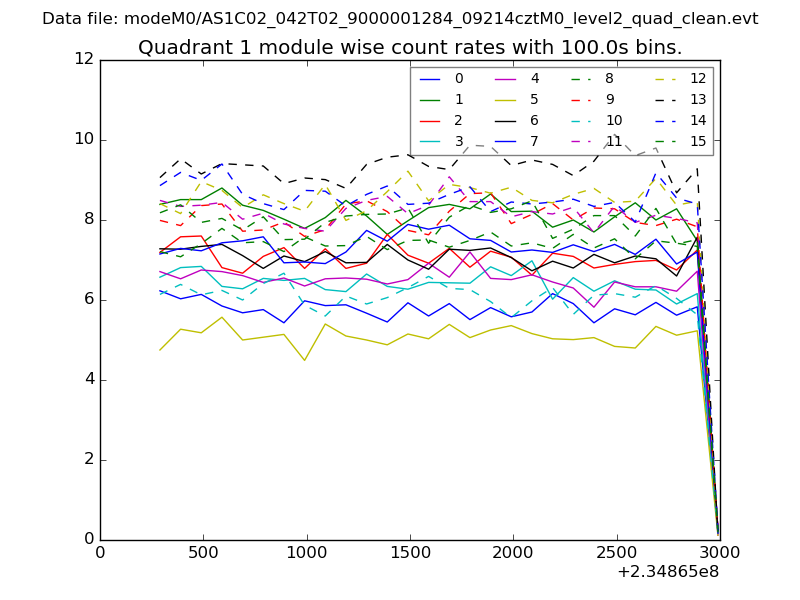
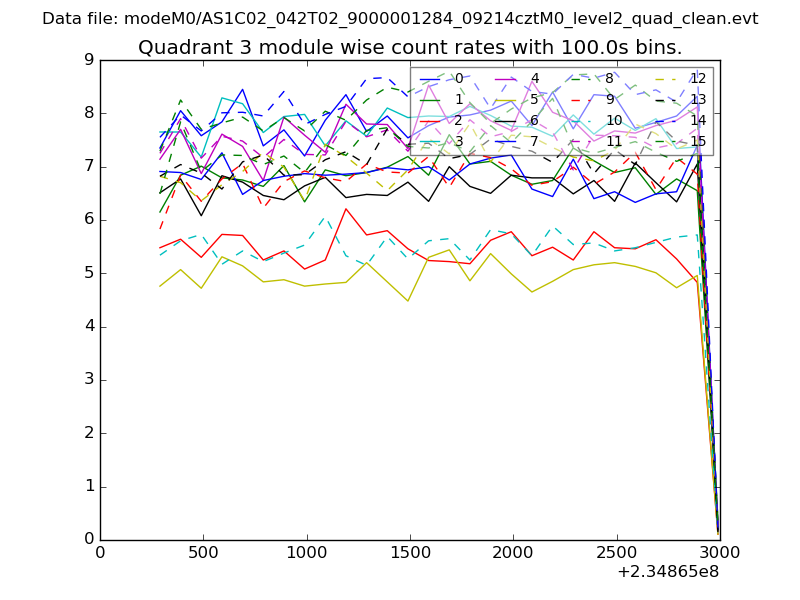
| Module-wise count rates for Quadrant A Data is divided into 100 sec bins |
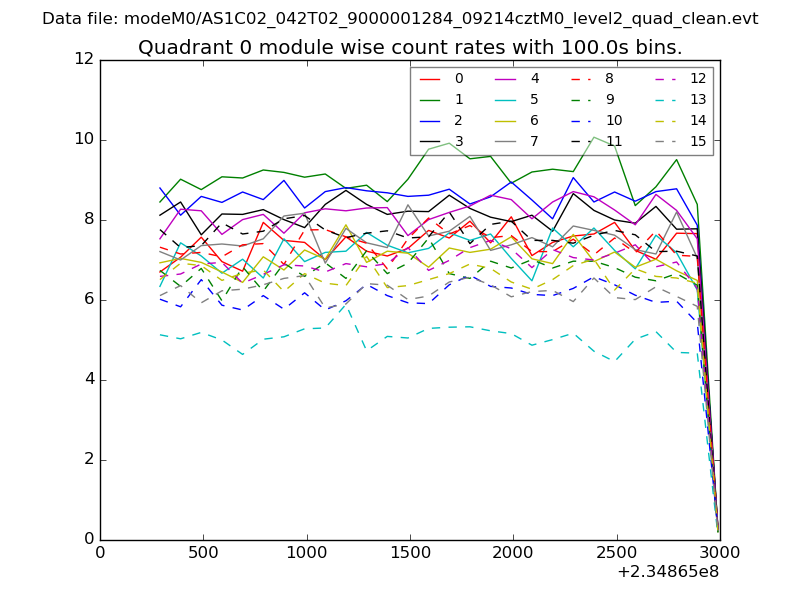 |
 |
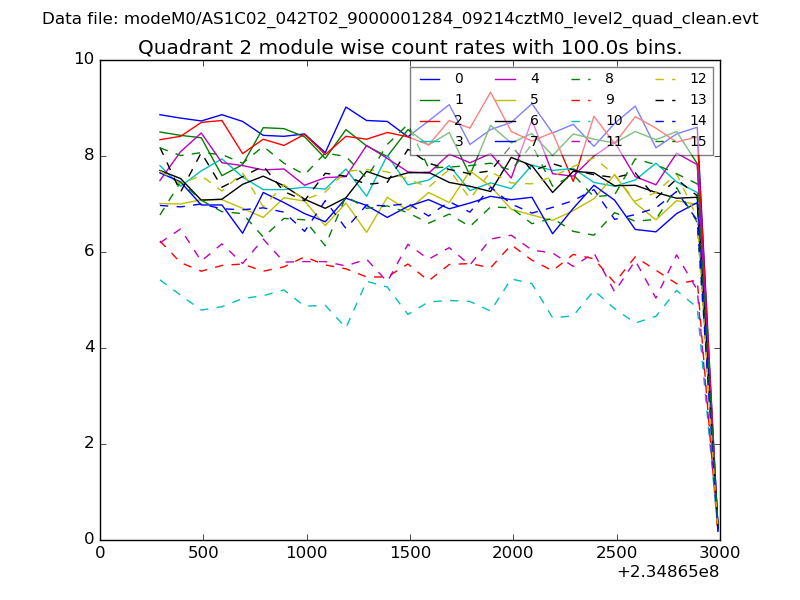
| Module-wise count rates for Quadrant B Data is divided into 100 sec bins |
 |
 |
| Module-wise count rates for Quadrant C Data is divided into 100 sec bins |
 |
 |
| Module-wise count rates for Quadrant D Data is divided into 100 sec bins |
 |
 |
| Parameter | Plot |
|---|---|
| CZT HV Monitor | 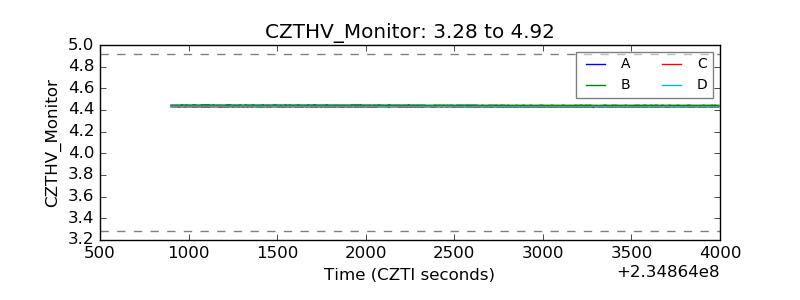 |
| D_VDD | 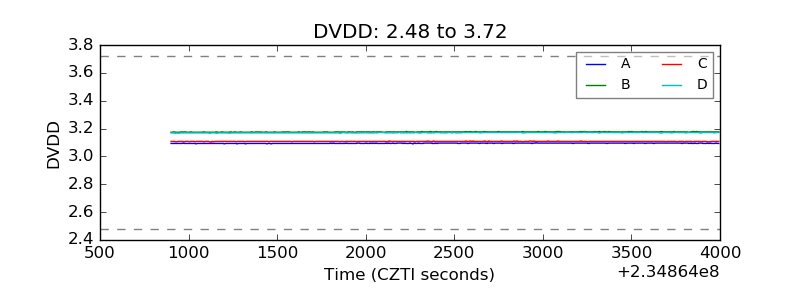 |
| Temperature 1 | 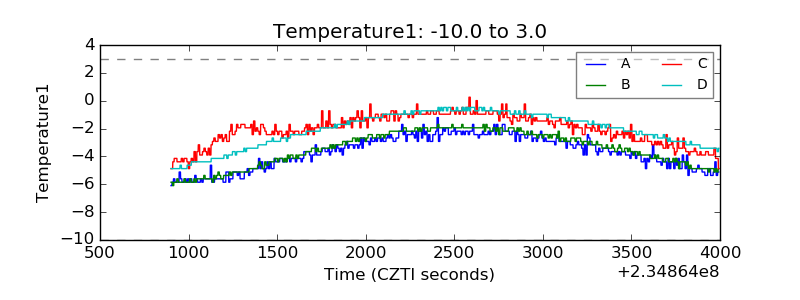 |
| Veto HV Monitor | 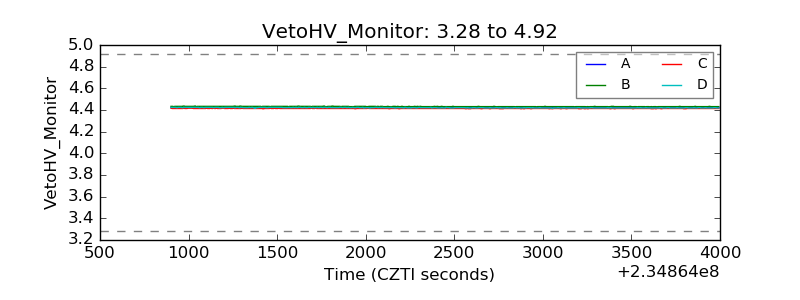 |
| Veto LLD | 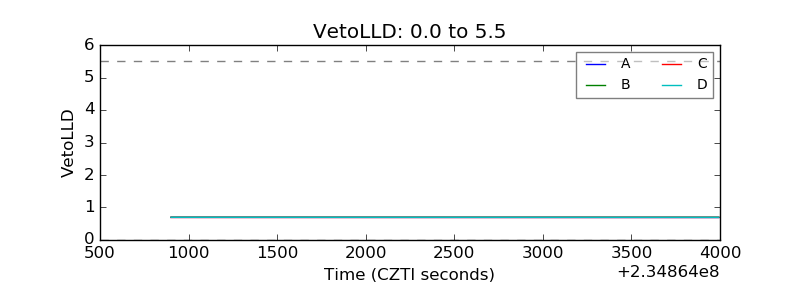 |
| Alpha Counter | 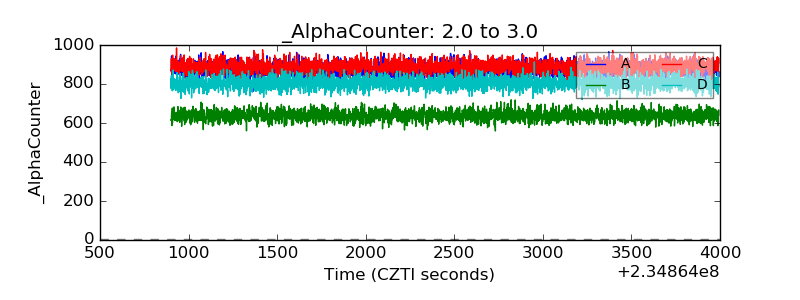 |
| _CPM_Rate | 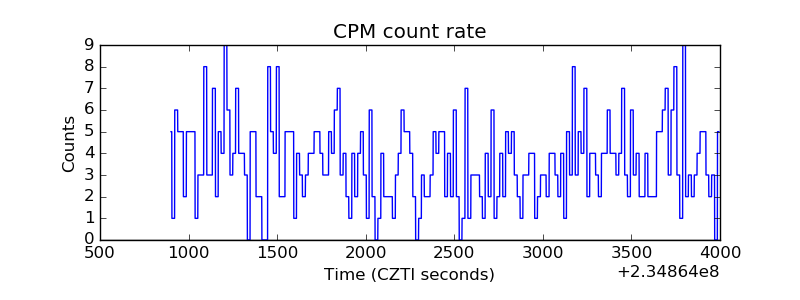 |
| CZT Counter | 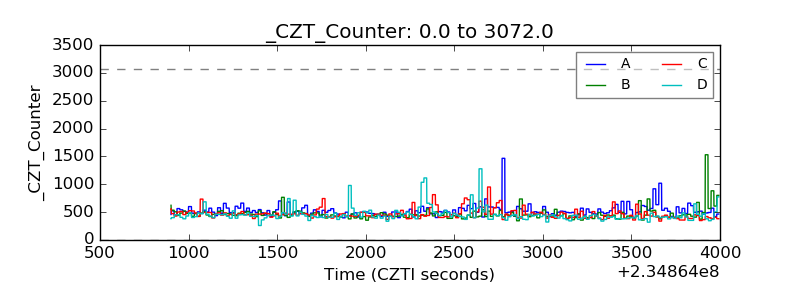 |
| +2.5 Volts monitor |  |
| +5 Volts monitor |  |
| _ROLL_ROT | 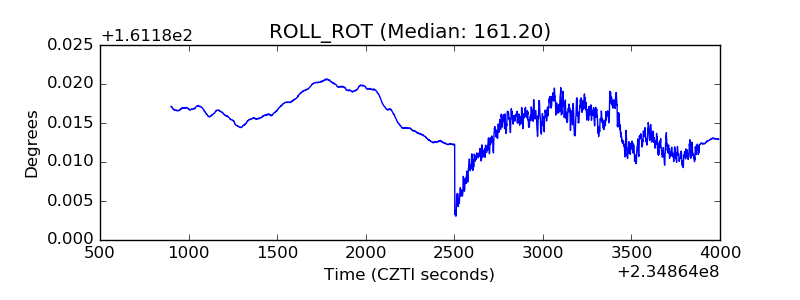 |
| _Roll_DEC | 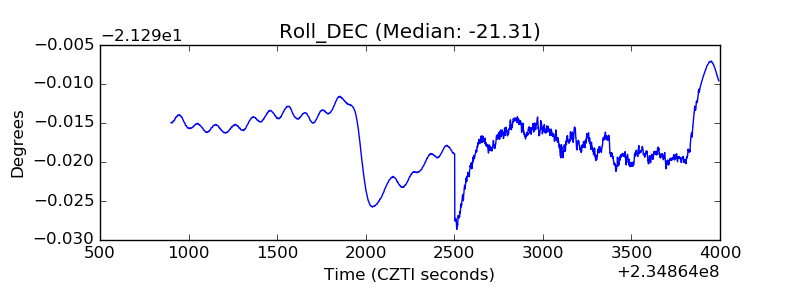 |
| _Roll_RA | 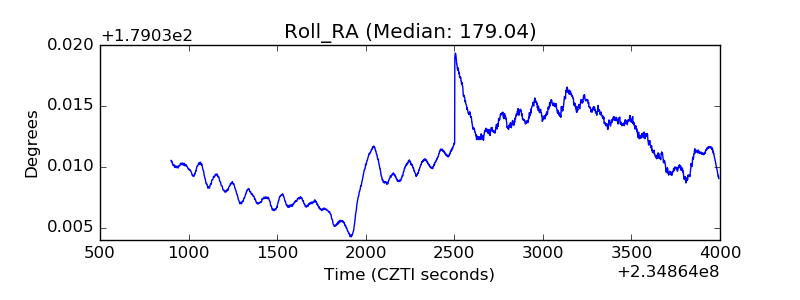 |
| Veto Counter | 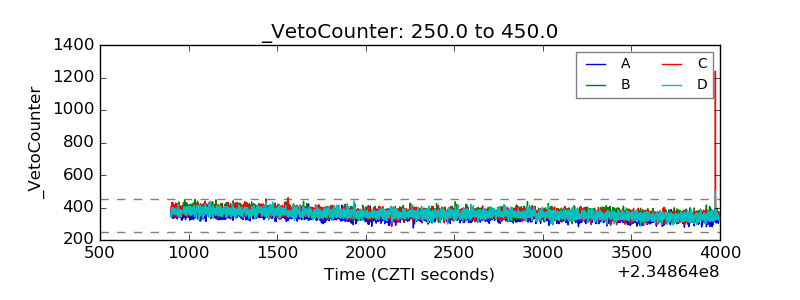 |