| Param | Original file | Final file |
|---|---|---|
| Filename | modeM0/AS1A02_178T01_9000001286cztM0_level2.fits | modeM0/AS1A02_178T01_9000001286cztM0_level2_quad_clean.evt |
| Size (bytes) | 643,351,680 | 633,723,840 |
| Size | 613.5 MB | 604.4 MB |
| Events in quadrant A | 3,778,417 | 3,702,006 |
| Events in quadrant B | 3,757,304 | 3,766,072 |
| Events in quadrant C | 3,835,213 | 3,586,661 |
| Events in quadrant D | 3,306,778 | 3,336,063 |
| Mode SS | |||
|---|---|---|---|
| Quadrant | BADHDUFLAG | Total packets | Discarded packets |
| A | 0 | 1474 | 0 |
| B | 0 | 1480 | 0 |
| C | 0 | 1486 | 0 |
| D | 0 | 1472 | 0 |
| Mode M9 | |||
|---|---|---|---|
| Quadrant | BADHDUFLAG | Total packets | Discarded packets |
| A | 0 | 92 | 0 |
| B | 0 | 94 | 0 |
| C | 0 | 91 | 0 |
| D | 0 | 93 | 0 |
| Mode M0 | |||
|---|---|---|---|
| Quadrant | BADHDUFLAG | Total packets | Discarded packets |
| A | 0 | 188033 | 0 |
| B | 0 | 152211 | 0 |
| C | 0 | 143635 | 0 |
| D | 0 | 153664 | 0 |
| Quadrant | Total seconds | Saturated seconds | Saturation percentage |
|---|---|---|---|
| A | 69300 | 2568 | 3.705628% |
| B | 69946 | 1432 | 2.047294% |
| C | 70121 | 955 | 1.361932% |
| D | 69863 | 1667 | 2.386099% |
Noise dominated data is calculated using 1-second bins in cleaned event files. If a bin has >2000 counts, and if more than 50% of those come from <1% of pixels, then it is considered to be noise-dominated and hence unusable.
| Quadrant | # 1 sec bins | Bins with >0 counts | Bins with >2000 counts | High rate bins dominated by noise | Noise dominated (total time) | Noise dominated (detector-on time) | Marked lightcurve |
|---|---|---|---|---|---|---|---|
| A | 98696 | 71429 | 0 | 0 | 0.00% | 0.00% |  |
| B | 98697 | 71889 | 0 | 0 | 0.00% | 0.00% |  |
| C | 98695 | 71967 | 0 | 0 | 0.00% | 0.00% | 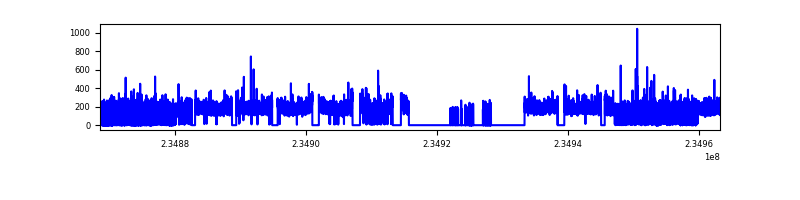 |
| D | 98696 | 71652 | 0 | 0 | 0.00% | 0.00% |  |
Top three noisy pixels from each quadrant. If the there are fewer than three noisy pixels in the level2.evt file, extra rows are filled as -1
| Pixel properties | Quadrant properties | ||||||
|---|---|---|---|---|---|---|---|
| Quadrant | DetID | PixID | Counts | Sigma | Mean | Median | Sigma |
| A | 0 | 29 | 3686 | 11.0 | 984 | 915 | 252.0 |
| A | 7 | 110 | 3120 | 8.75 | 984 | 915 | 252.0 |
| A | 0 | 30 | 2965 | 8.14 | 984 | 915 | 252.0 |
| B | 2 | 9 | 3269 | 11.58 | 992 | 942 | 200.9 |
| B | 14 | 254 | 2583 | 8.17 | 992 | 942 | 200.9 |
| B | 5 | 225 | 2485 | 7.68 | 992 | 942 | 200.9 |
| C | 1 | 80 | 2812 | 7.03 | 1012 | 932 | 267.6 |
| C | 12 | 241 | 2697 | 6.6 | 1012 | 932 | 267.6 |
| C | 1 | 81 | 2660 | 6.46 | 1012 | 932 | 267.6 |
| D | 6 | 231 | 2419 | 6.07 | 943 | 852 | 258.3 |
| D | 7 | 5 | 2378 | 5.91 | 943 | 852 | 258.3 |
| D | 1 | 19 | 2344 | 5.78 | 943 | 852 | 258.3 |
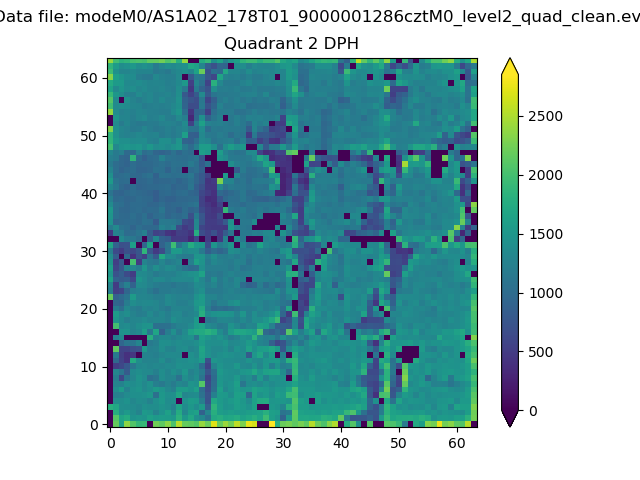
Histogram calculated using DETX and DETY for each event in the final _common_clean file
| Quadrant A |  |
 |
Quadrant B |
|---|---|---|---|
| Quadrant D | 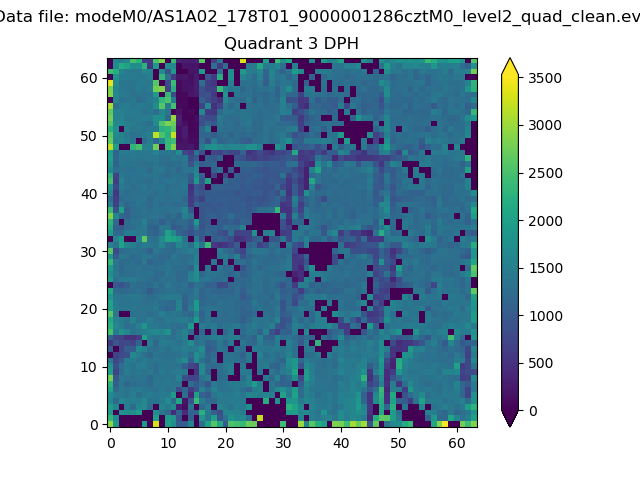 |
 |
Quadrant C |
| Plot type | Count rate plots | Images |
|---|---|---|
| Comparison with Poisson distribution Blue bars denote a histogram of data divided into 1 sec bins. Red curve is a Poisson curve with rate = median count rate of data. |
 |
 |
| Quadrant-wise count rates Data is divided into 100 sec bins |
 |
|
| Module-wise count rates for Quadrant A Data is divided into 100 sec bins |
 |
 |
| Module-wise count rates for Quadrant B Data is divided into 100 sec bins |
 |
 |
| Module-wise count rates for Quadrant C Data is divided into 100 sec bins |
 |
 |
| Module-wise count rates for Quadrant D Data is divided into 100 sec bins |
 |
 |
| Parameter | Plot |
|---|---|
| CZT HV Monitor |  |
| D_VDD | 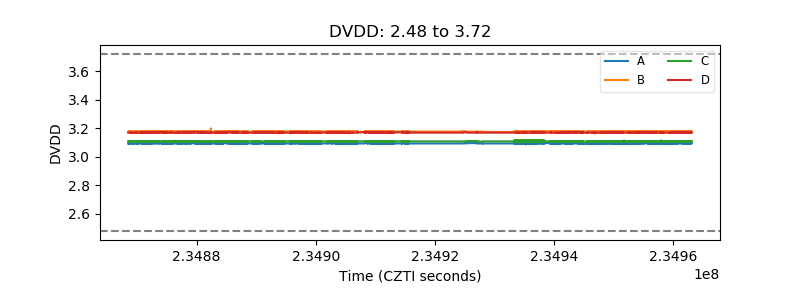 |
| Temperature 1 |  |
| Veto HV Monitor |  |
| Veto LLD |  |
| Alpha Counter |  |
| _CPM_Rate |  |
| CZT Counter |  |
| +2.5 Volts monitor |  |
| +5 Volts monitor |  |
| _ROLL_ROT |  |
| _Roll_DEC |  |
| _Roll_RA |  |
| Veto Counter |  |