| Param | Original file | Final file |
|---|---|---|
| Filename | modeM0/AS1A02_178T01_9000001286_09210cztM0_level2.evt | modeM0/AS1A02_178T01_9000001286_09210cztM0_level2_quad_clean.evt |
| Size (bytes) | 181,736,640 | 18,947,520 |
| Size | 173.3 MB | 18.1 MB |
| Events in quadrant A | 1,613,180 | 98,096 |
| Events in quadrant B | 1,240,859 | 106,506 |
| Events in quadrant C | 1,205,423 | 103,093 |
| Events in quadrant D | 1,276,735 | 91,184 |
| Mode SS | |||
|---|---|---|---|
| Quadrant | BADHDUFLAG | Total packets | Discarded packets |
| A | 0 | 68 | 14 |
| B | 0 | 68 | 14 |
| C | 0 | 68 | 12 |
| D | 0 | 68 | 22 |
| Mode M0 | |||
|---|---|---|---|
| Quadrant | BADHDUFLAG | Total packets | Discarded packets |
| A | 0 | 9442 | 3182 |
| B | 0 | 7522 | 2279 |
| C | 0 | 7393 | 2199 |
| D | 0 | 8329 | 2910 |
| Quadrant | Total seconds | Saturated seconds | Saturation percentage |
|---|---|---|---|
| A | 2310 | 214 | 9.264069% |
| B | 2453 | 155 | 6.318793% |
| C | 2459 | 145 | 5.896706% |
| D | 2381 | 152 | 6.383872% |
Noise dominated data is calculated using 1-second bins in cleaned event files. If a bin has >2000 counts, and if more than 50% of those come from <1% of pixels, then it is considered to be noise-dominated and hence unusable.
| Quadrant | # 1 sec bins | Bins with >0 counts | Bins with >2000 counts | High rate bins dominated by noise | Noise dominated (total time) | Noise dominated (detector-on time) | Marked lightcurve |
|---|---|---|---|---|---|---|---|
| A | 3464 | 2908 | 24 | 24 | 0.69% | 0.83% | 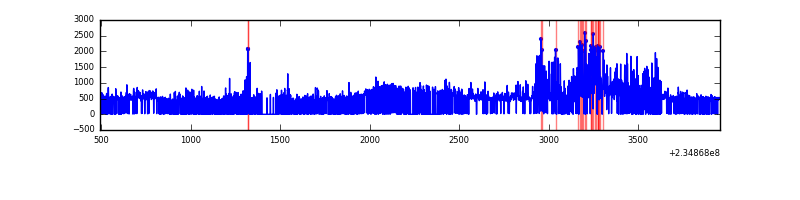 |
| B | 3464 | 3040 | 0 | 0 | 0.00% | 0.00% | 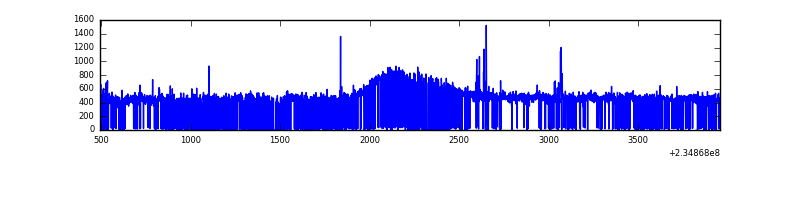 |
| C | 3463 | 3038 | 0 | 0 | 0.00% | 0.00% | 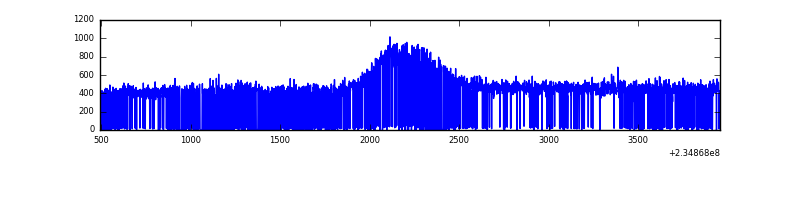 |
| D | 3462 | 2967 | 29 | 29 | 0.84% | 0.98% | 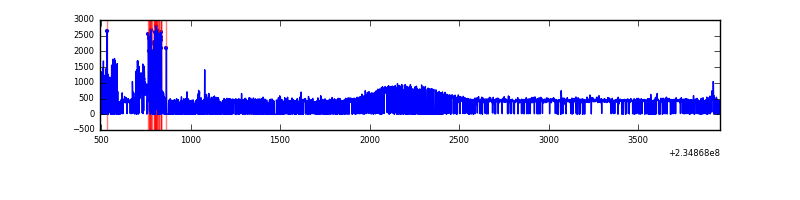 |
Top three noisy pixels from each quadrant. If the there are fewer than three noisy pixels in the level2.evt file, extra rows are filled as -1
| Pixel properties | Quadrant properties | ||||||
|---|---|---|---|---|---|---|---|
| Quadrant | DetID | PixID | Counts | Sigma | Mean | Median | Sigma |
| A | 8 | 5 | 427385 | 6925.53 | 290 | 283 | 61.7 |
| A | 1 | 162 | 30097 | 483.44 | 290 | 283 | 61.7 |
| A | 15 | 174 | 17419 | 277.86 | 290 | 283 | 61.7 |
| B | 8 | 234 | 12010 | 183.92 | 313 | 304 | 63.6 |
| B | 4 | 80 | 9853 | 150.03 | 313 | 304 | 63.6 |
| B | 12 | 111 | 7029 | 105.66 | 313 | 304 | 63.6 |
| C | 13 | 61 | 2410 | 28.53 | 308 | 309 | 73.6 |
| C | 3 | 233 | 1092 | 10.63 | 308 | 309 | 73.6 |
| C | 8 | 222 | 1082 | 10.5 | 308 | 309 | 73.6 |
| D | 1 | 52 | 146518 | 1984.27 | 293 | 284 | 73.7 |
| D | 2 | 234 | 12237 | 162.19 | 293 | 284 | 73.7 |
| D | 7 | 71 | 7263 | 94.7 | 293 | 284 | 73.7 |
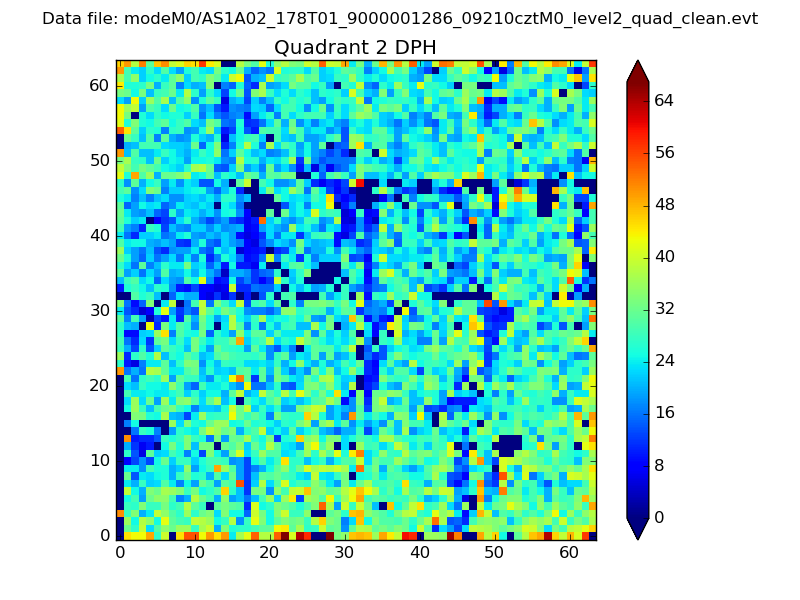
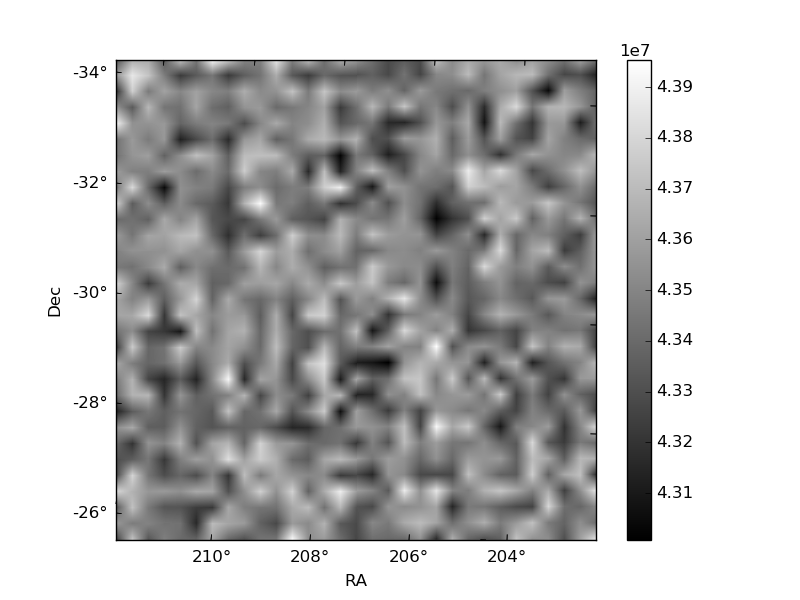
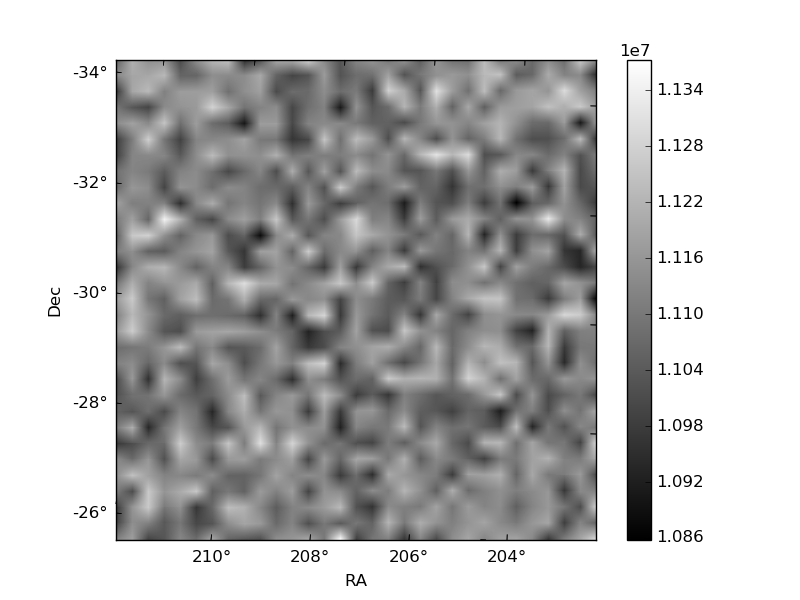
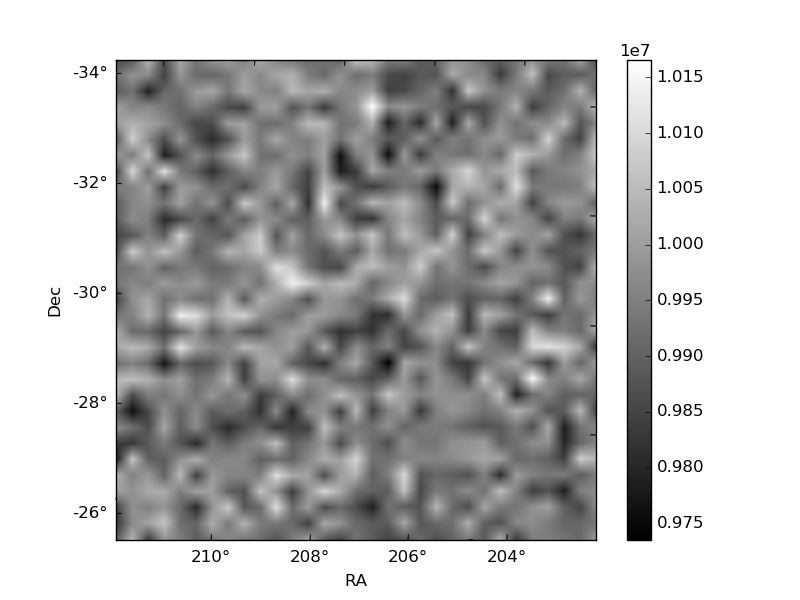
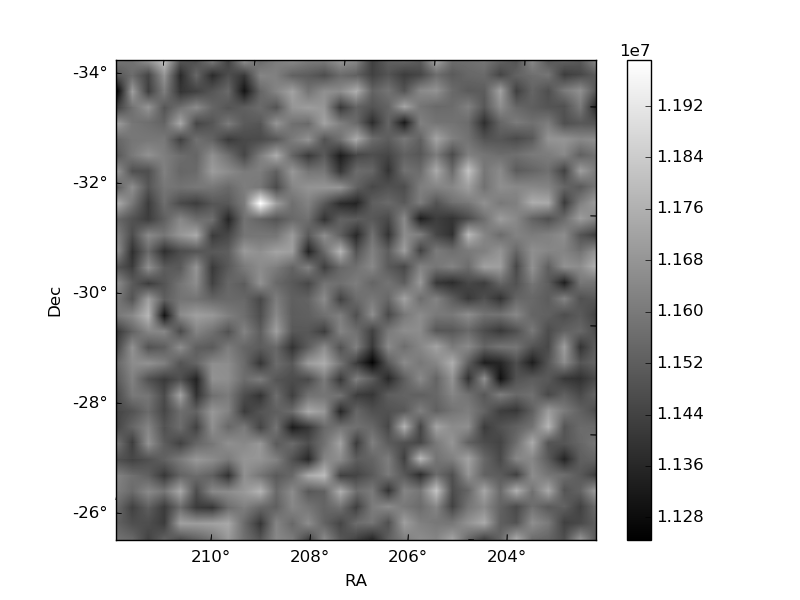
Histogram calculated using DETX and DETY for each event in the final _common_clean file
| Quadrant A | 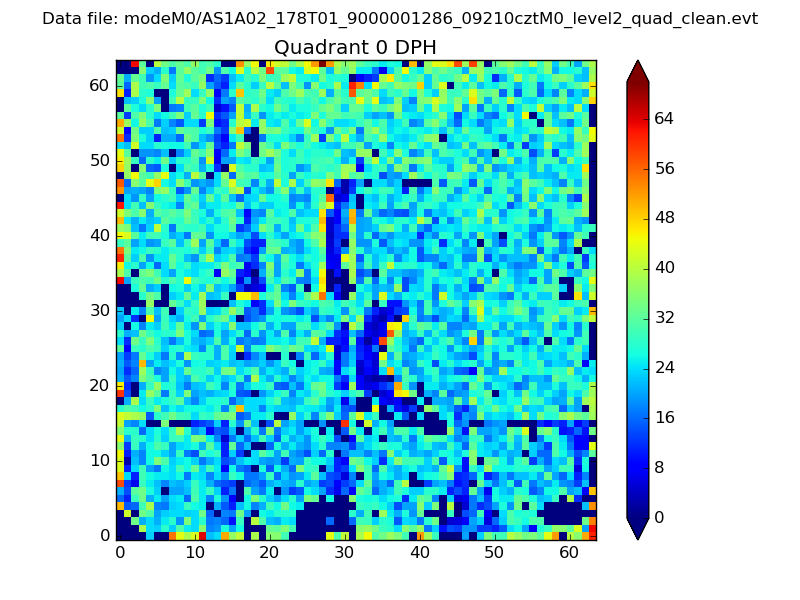 |
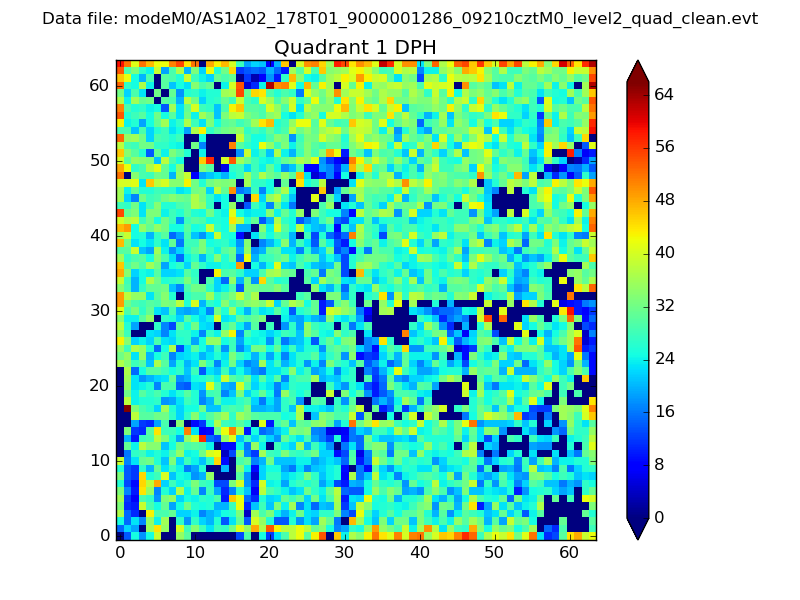 |
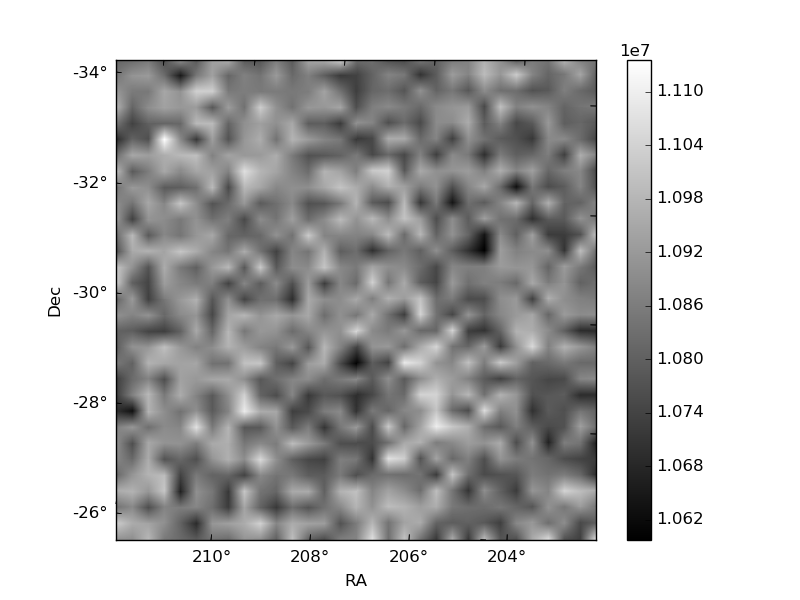
Quadrant B |
|---|---|---|---|
| Quadrant D | 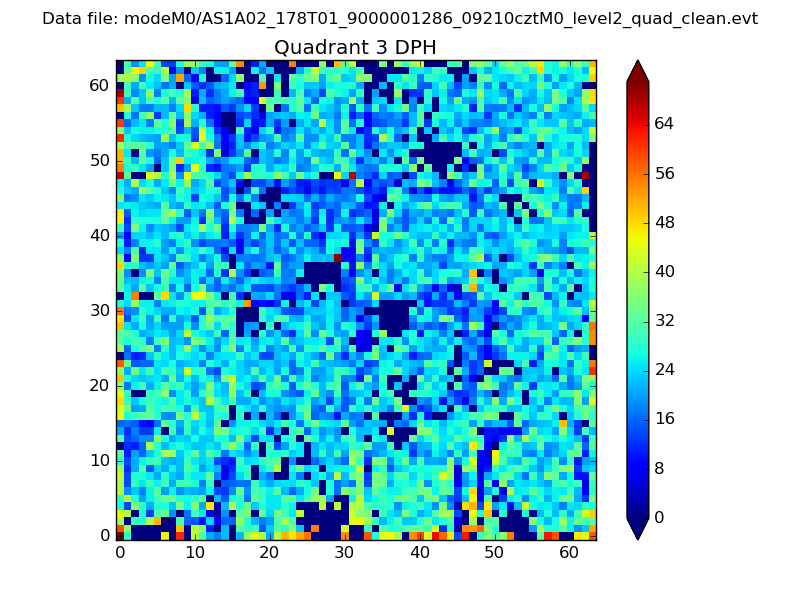 |
 |
Quadrant C |
| Plot type | Count rate plots | Images |
|---|---|---|
| Comparison with Poisson distribution Blue bars denote a histogram of data divided into 1 sec bins. Red curve is a Poisson curve with rate = median count rate of data. |
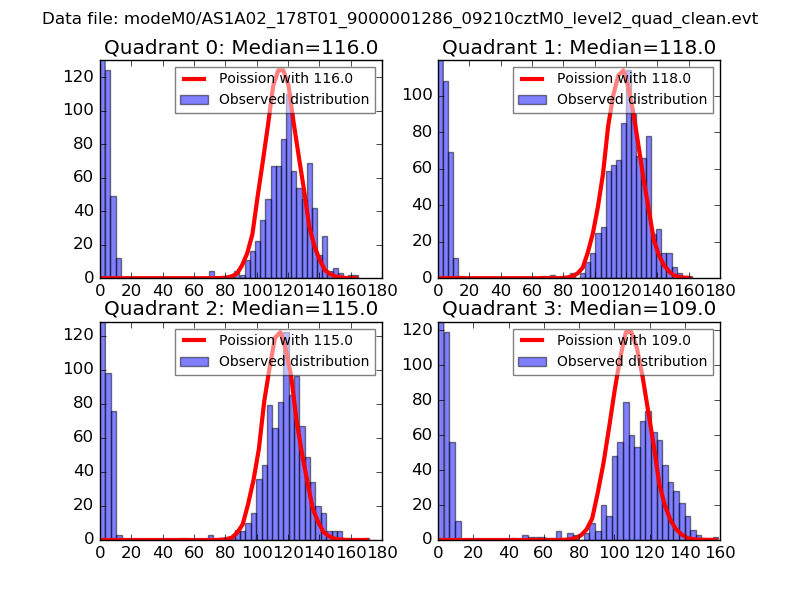 |
 |
| Quadrant-wise count rates Data is divided into 100 sec bins |
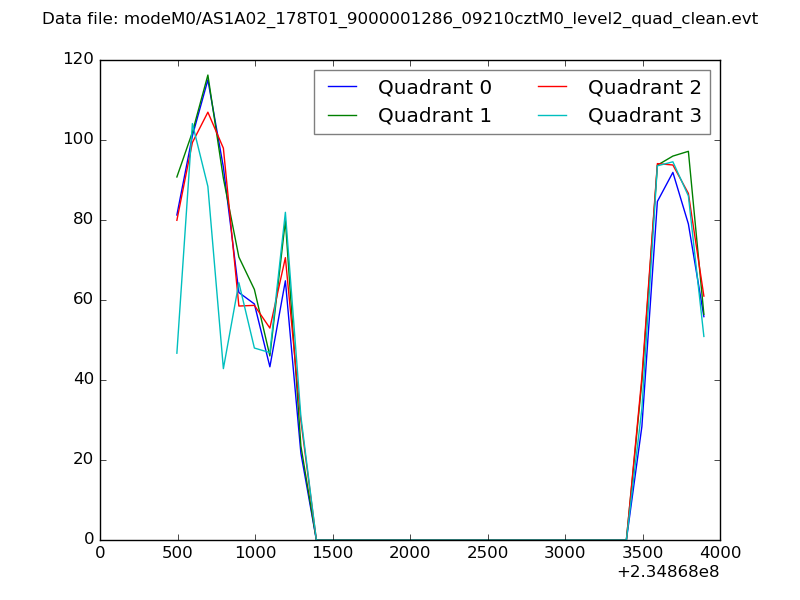 |
|
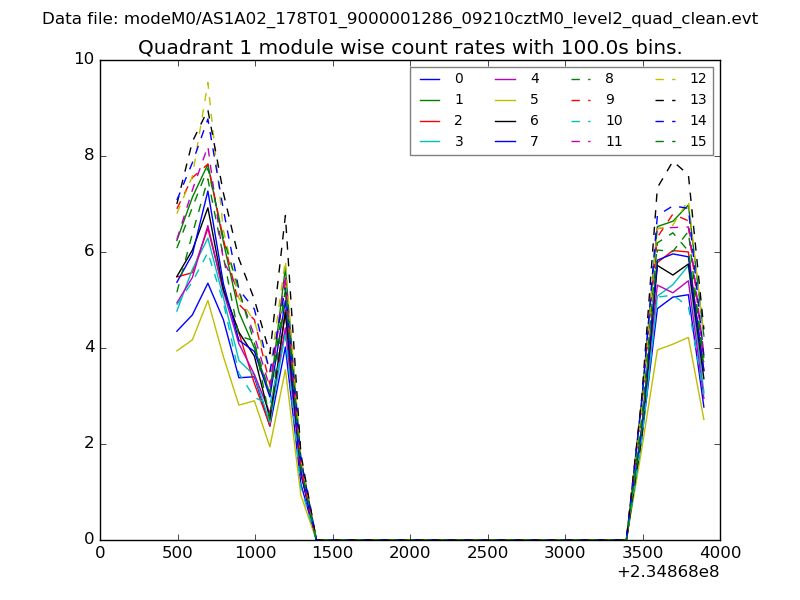
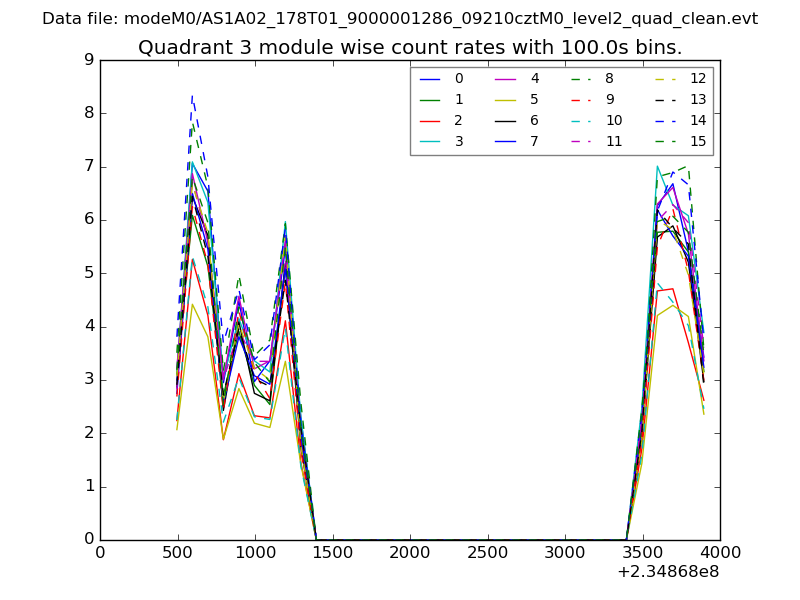
| Module-wise count rates for Quadrant A Data is divided into 100 sec bins |
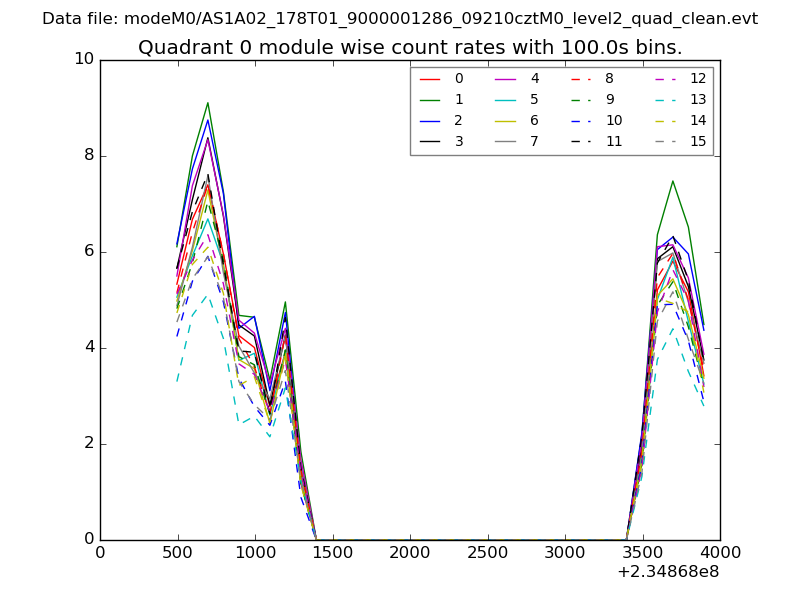 |
 |
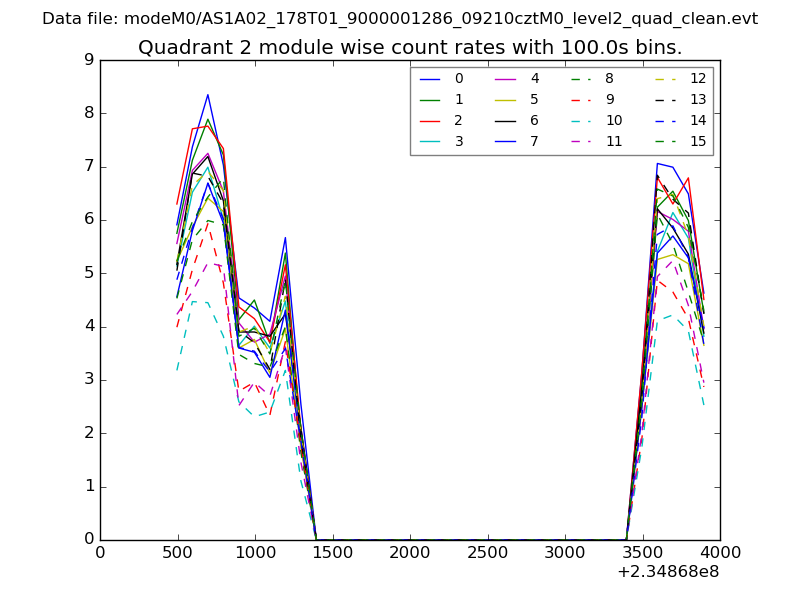
| Module-wise count rates for Quadrant B Data is divided into 100 sec bins |
 |
 |
| Module-wise count rates for Quadrant C Data is divided into 100 sec bins |
 |
 |
| Module-wise count rates for Quadrant D Data is divided into 100 sec bins |
 |
 |
| Parameter | Plot |
|---|---|
| CZT HV Monitor | 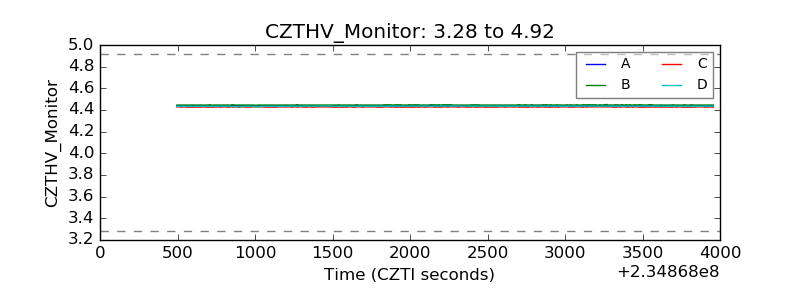 |
| D_VDD | 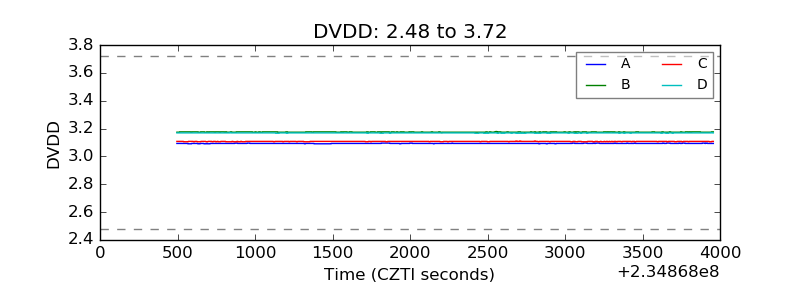 |
| Temperature 1 | 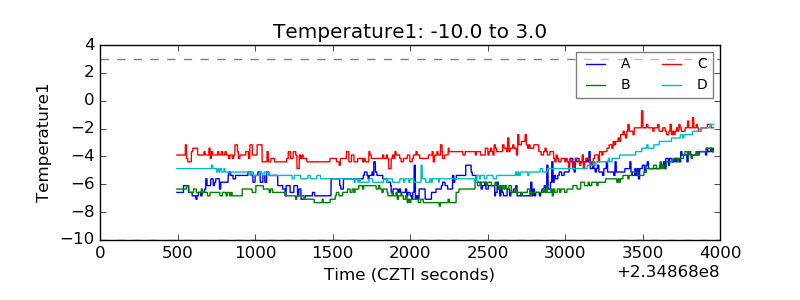 |
| Veto HV Monitor | 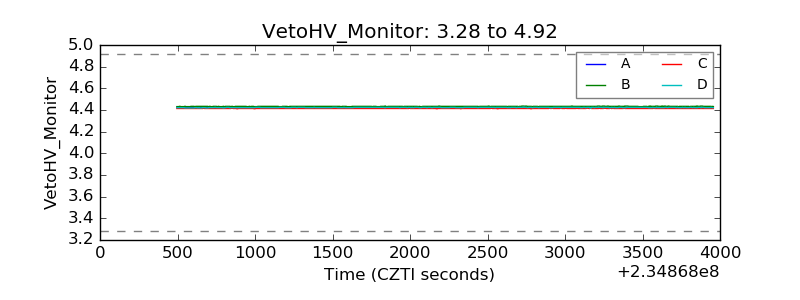 |
| Veto LLD | 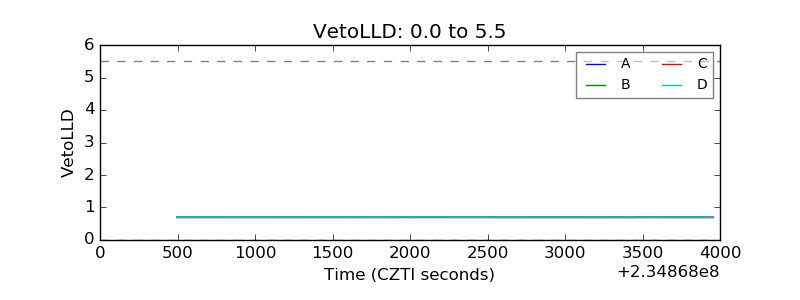 |
| Alpha Counter | 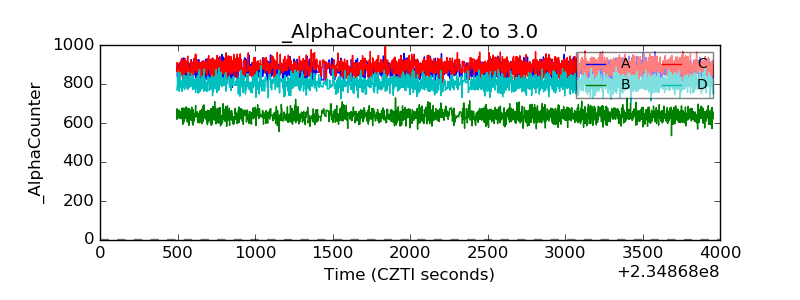 |
| _CPM_Rate | 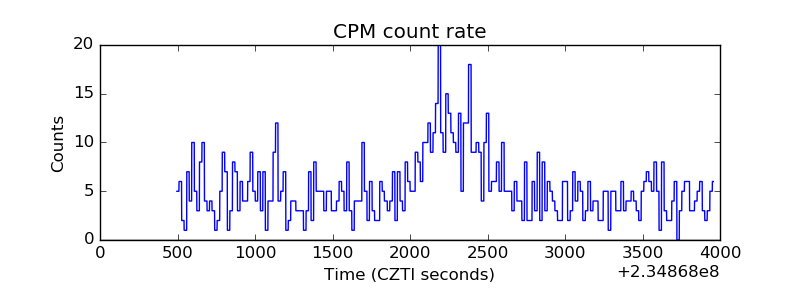 |
| CZT Counter | 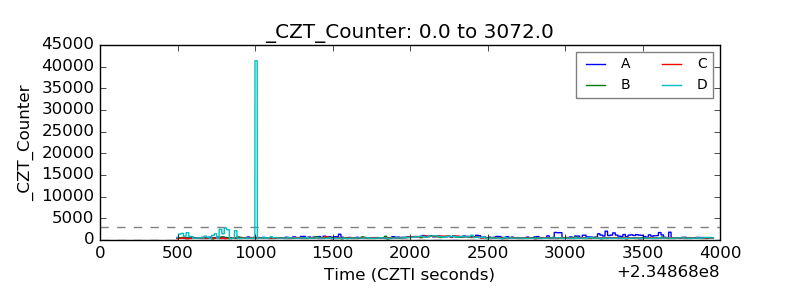 |
| +2.5 Volts monitor |  |
| +5 Volts monitor |  |
| _ROLL_ROT |  |
| _Roll_DEC | 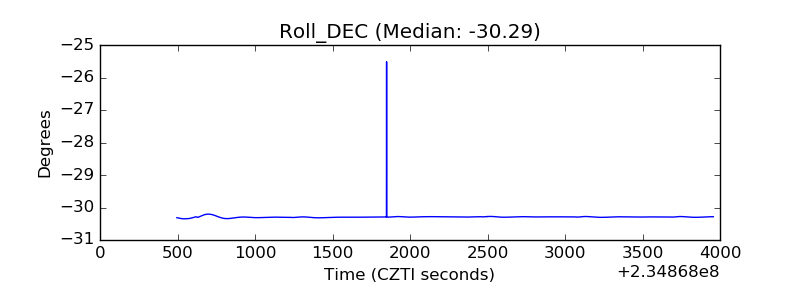 |
| _Roll_RA | 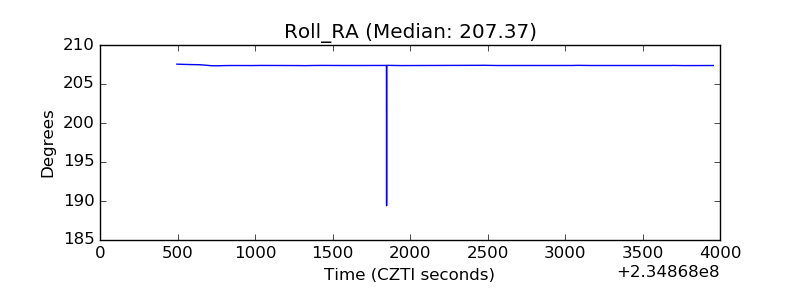 |
| Veto Counter | 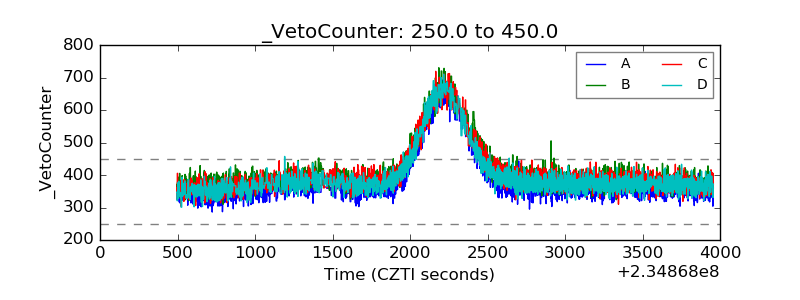 |