| Param | Original file | Final file |
|---|---|---|
| Filename | modeM0/AS1A02_178T01_9000001286_09211cztM0_level2.evt | modeM0/AS1A02_178T01_9000001286_09211cztM0_level2_quad_clean.evt |
| Size (bytes) | 550,926,720 | 82,373,760 |
| Size | 525.4 MB | 78.6 MB |
| Events in quadrant A | 5,090,568 | 485,560 |
| Events in quadrant B | 3,921,031 | 505,627 |
| Events in quadrant C | 3,515,456 | 500,455 |
| Events in quadrant D | 3,652,386 | 486,162 |
| Mode SS | |||
|---|---|---|---|
| Quadrant | BADHDUFLAG | Total packets | Discarded packets |
| A | 0 | 170 | 10 |
| B | 0 | 170 | 6 |
| C | 0 | 170 | 18 |
| D | 0 | 170 | 18 |
| Mode M9 | |||
|---|---|---|---|
| Quadrant | BADHDUFLAG | Total packets | Discarded packets |
| A | 0 | 2 | 0 |
| B | 0 | 2 | 0 |
| C | 0 | 2 | 0 |
| D | 0 | 2 | 0 |
| Mode M0 | |||
|---|---|---|---|
| Quadrant | BADHDUFLAG | Total packets | Discarded packets |
| A | 0 | 23057 | 3374 |
| B | 0 | 18663 | 2235 |
| C | 0 | 17462 | 1907 |
| D | 0 | 18061 | 2024 |
| Quadrant | Total seconds | Saturated seconds | Saturation percentage |
|---|---|---|---|
| A | 7215 | 593 | 8.218988% |
| B | 7398 | 368 | 4.974317% |
| C | 7486 | 278 | 3.713599% |
| D | 7474 | 328 | 4.388547% |
Noise dominated data is calculated using 1-second bins in cleaned event files. If a bin has >2000 counts, and if more than 50% of those come from <1% of pixels, then it is considered to be noise-dominated and hence unusable.
| Quadrant | # 1 sec bins | Bins with >0 counts | Bins with >2000 counts | High rate bins dominated by noise | Noise dominated (total time) | Noise dominated (detector-on time) | Marked lightcurve |
|---|---|---|---|---|---|---|---|
| A | 8604 | 8054 | 98 | 98 | 1.14% | 1.22% | 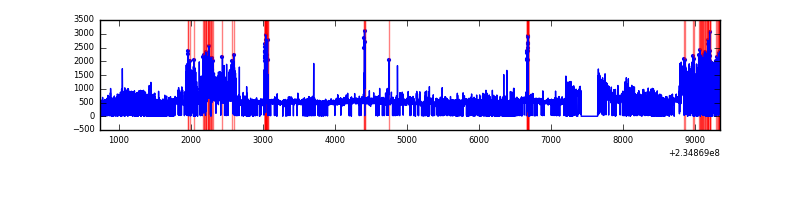 |
| B | 8604 | 8129 | 0 | 0 | 0.00% | 0.00% | 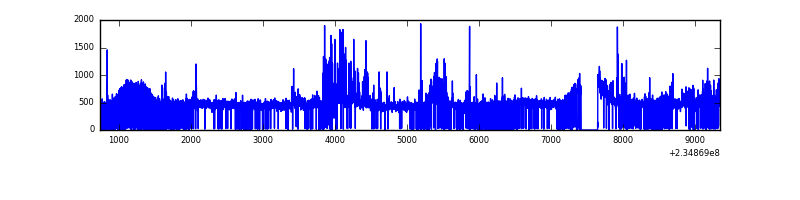 |
| C | 8604 | 8150 | 0 | 0 | 0.00% | 0.00% | 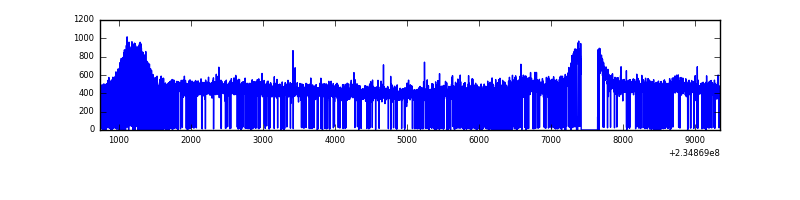 |
| D | 8604 | 8143 | 34 | 34 | 0.40% | 0.42% | 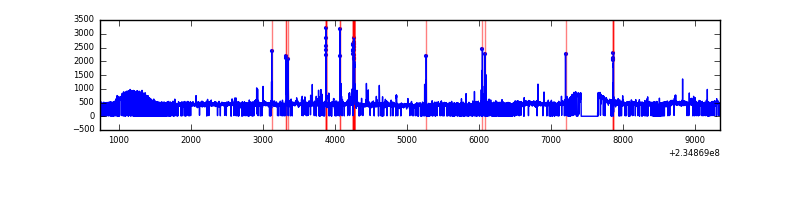 |
Top three noisy pixels from each quadrant. If the there are fewer than three noisy pixels in the level2.evt file, extra rows are filled as -1
| Pixel properties | Quadrant properties | ||||||
|---|---|---|---|---|---|---|---|
| Quadrant | DetID | PixID | Counts | Sigma | Mean | Median | Sigma |
| A | 8 | 5 | 1416552 | 7798.51 | 875 | 853 | 181.5 |
| A | 15 | 174 | 133163 | 728.84 | 875 | 853 | 181.5 |
| A | 1 | 162 | 87174 | 475.51 | 875 | 853 | 181.5 |
| B | 8 | 234 | 231986 | 1302.91 | 907 | 883 | 177.4 |
| B | 0 | 245 | 52585 | 291.48 | 907 | 883 | 177.4 |
| B | 0 | 214 | 33216 | 182.28 | 907 | 883 | 177.4 |
| C | 3 | 233 | 18604 | 84.98 | 895 | 895 | 208.4 |
| C | 13 | 61 | 6847 | 28.56 | 895 | 895 | 208.4 |
| C | 8 | 222 | 2774 | 9.02 | 895 | 895 | 208.4 |
| D | 9 | 64 | 117416 | 526.5 | 892 | 867 | 221.4 |
| D | 7 | 71 | 47147 | 209.07 | 892 | 867 | 221.4 |
| D | 2 | 234 | 36036 | 158.87 | 892 | 867 | 221.4 |
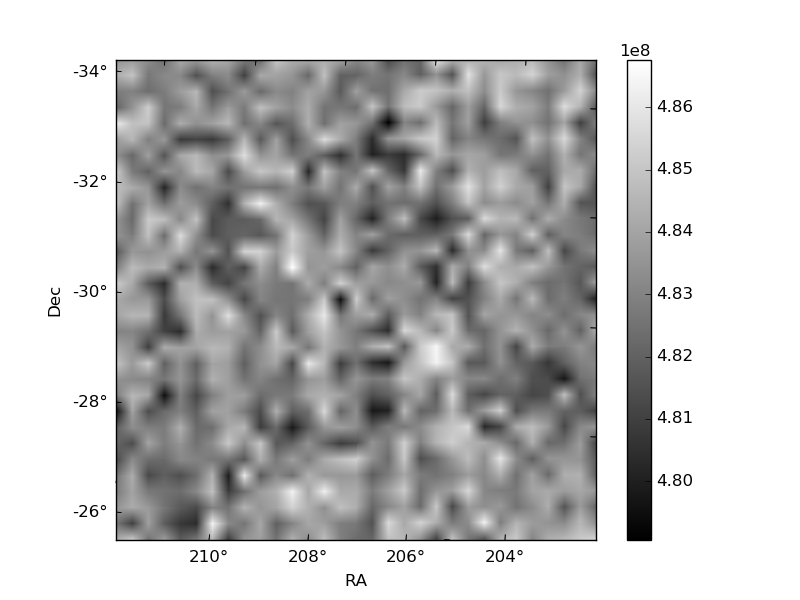
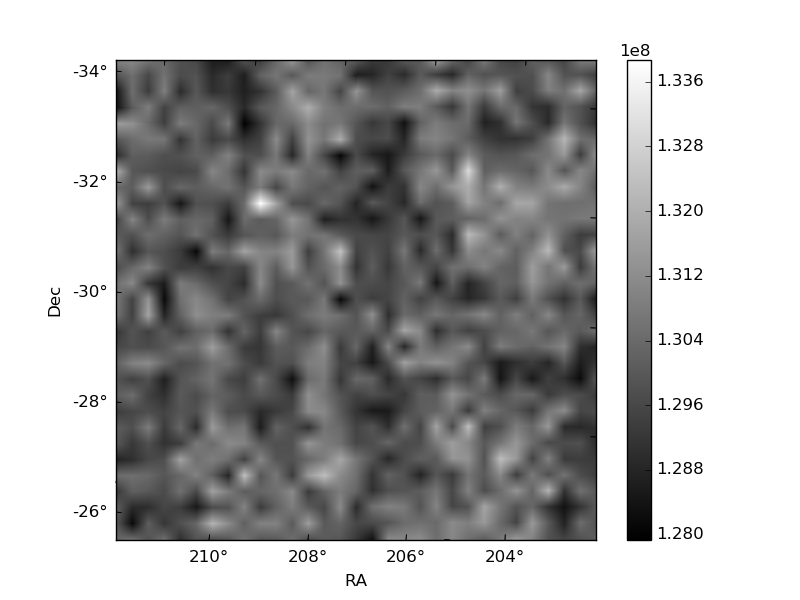
Histogram calculated using DETX and DETY for each event in the final _common_clean file
| Quadrant A | 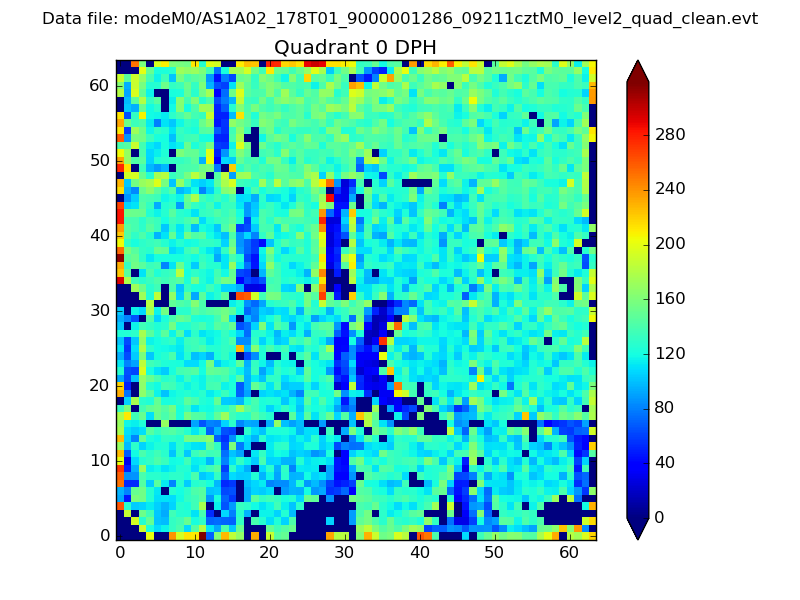 |
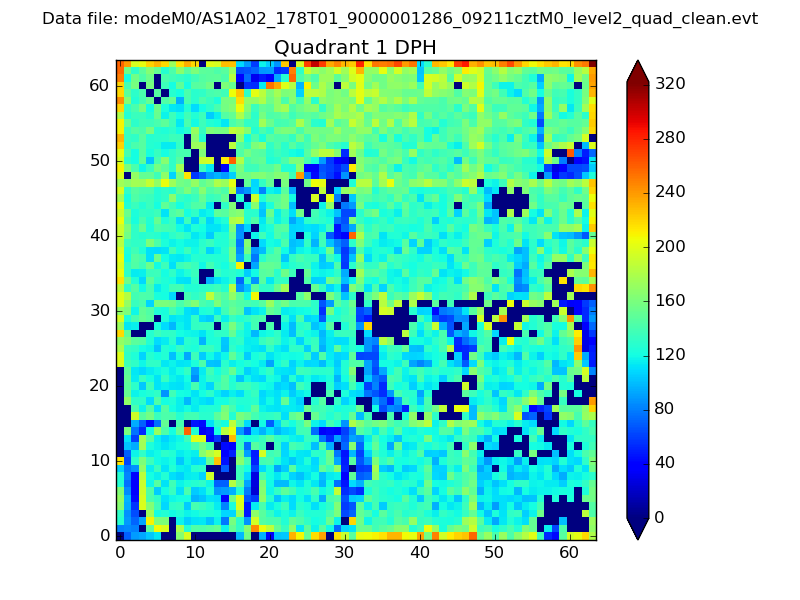 |
Quadrant B |
|---|---|---|---|
| Quadrant D | 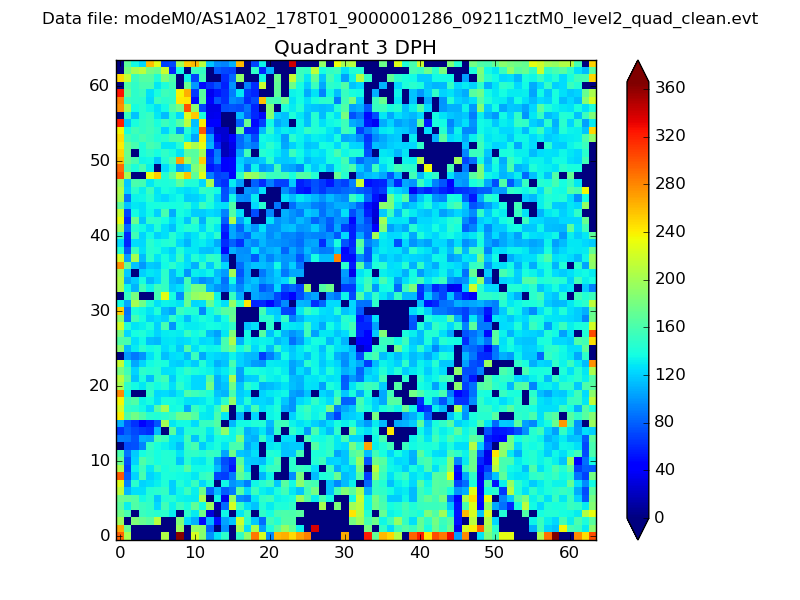 |
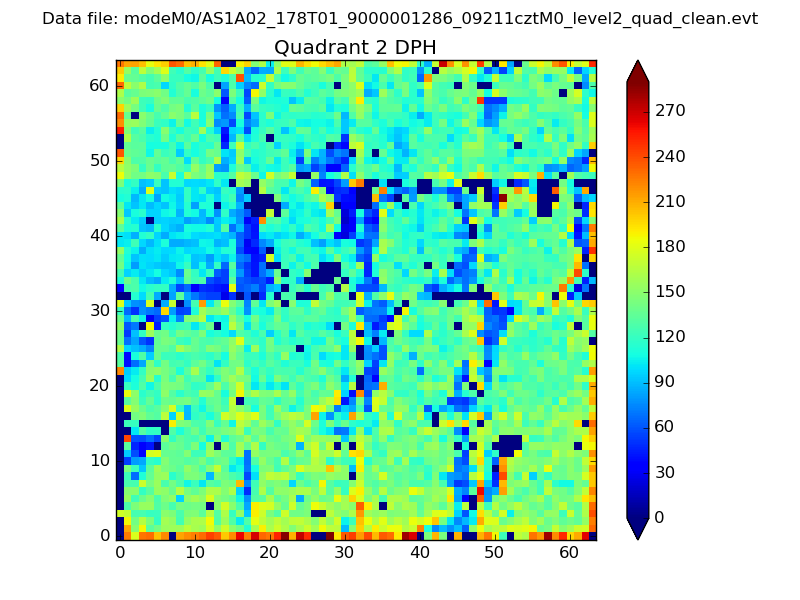 |
Quadrant C |
| Plot type | Count rate plots | Images |
|---|---|---|
| Comparison with Poisson distribution Blue bars denote a histogram of data divided into 1 sec bins. Red curve is a Poisson curve with rate = median count rate of data. |
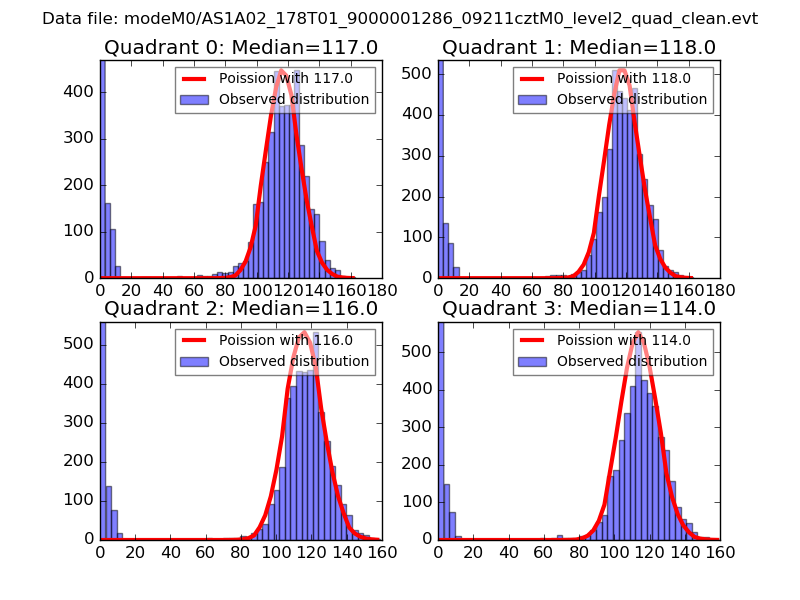 |
 |
| Quadrant-wise count rates Data is divided into 100 sec bins |
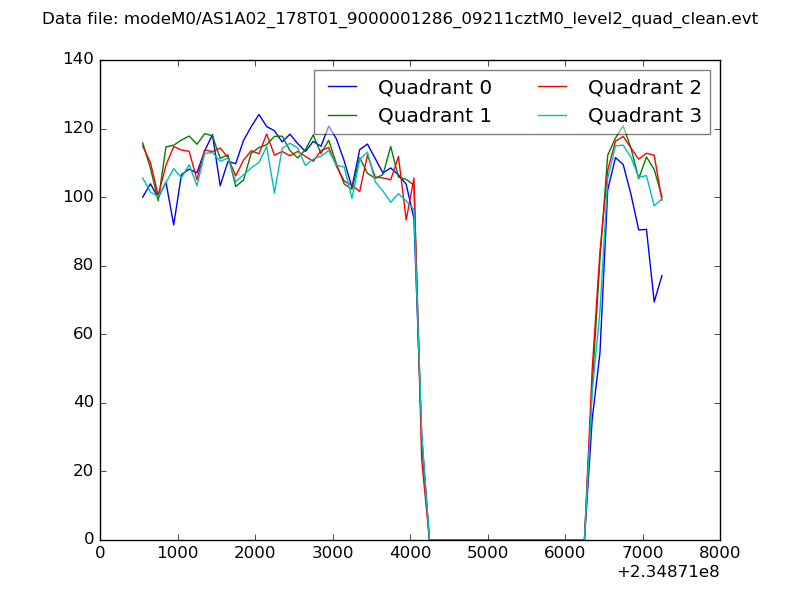 |
|
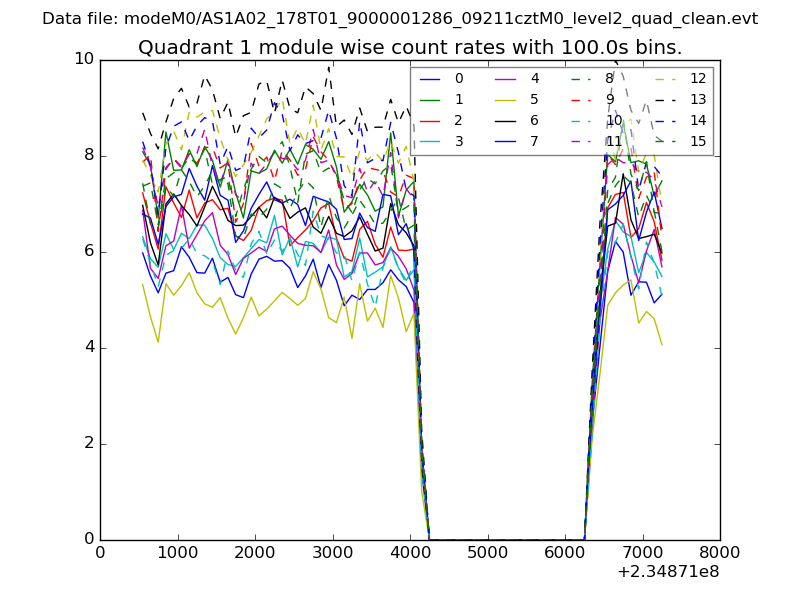
| Module-wise count rates for Quadrant A Data is divided into 100 sec bins |
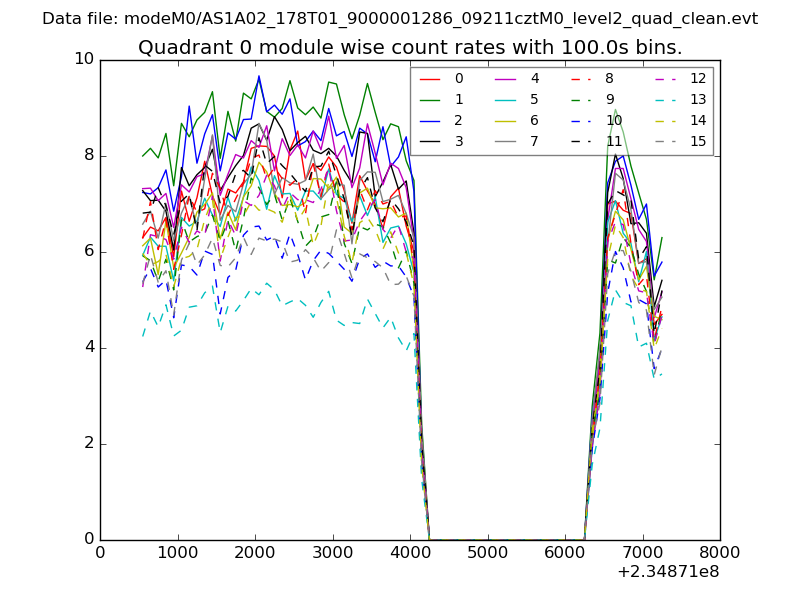 |
 |
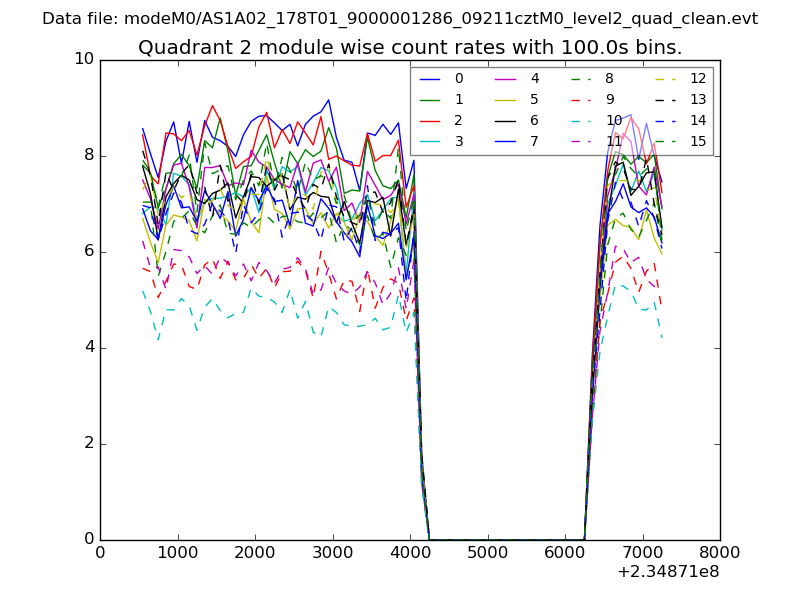
| Module-wise count rates for Quadrant B Data is divided into 100 sec bins |
 |
 |
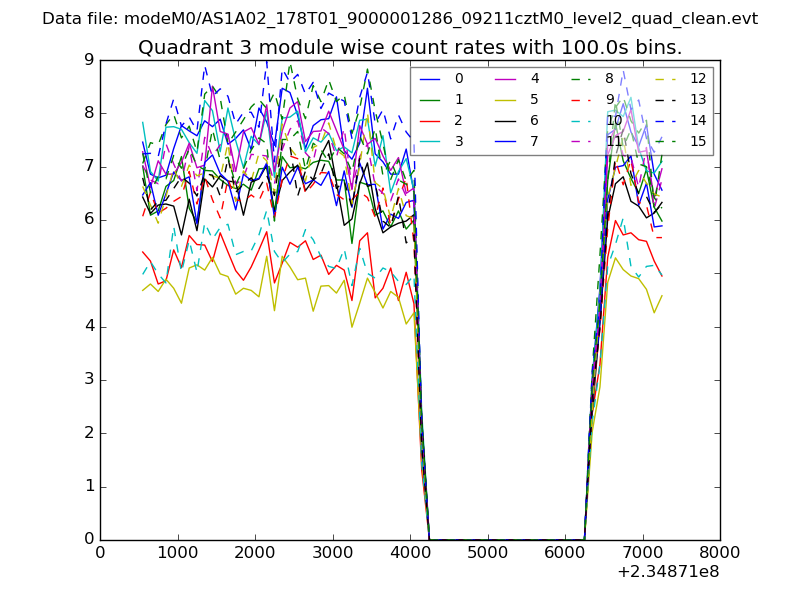
| Module-wise count rates for Quadrant C Data is divided into 100 sec bins |
 |
 |
| Module-wise count rates for Quadrant D Data is divided into 100 sec bins |
 |
 |
| Parameter | Plot |
|---|---|
| CZT HV Monitor | 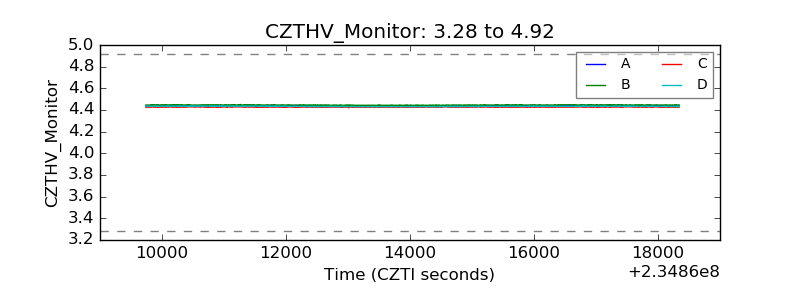 |
| D_VDD | 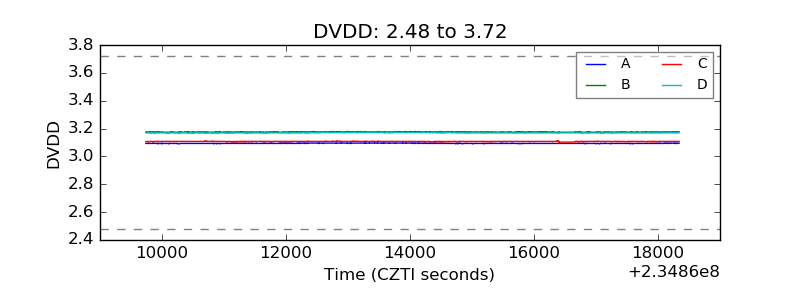 |
| Temperature 1 | 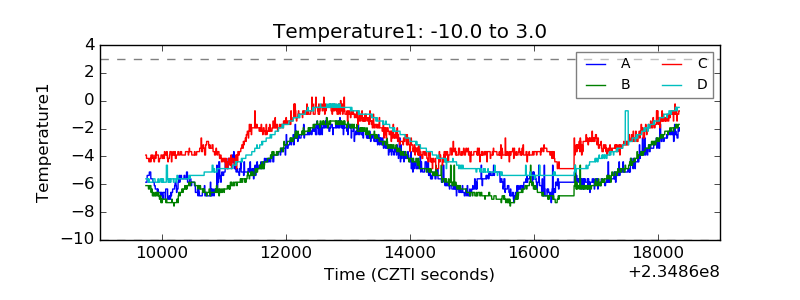 |
| Veto HV Monitor | 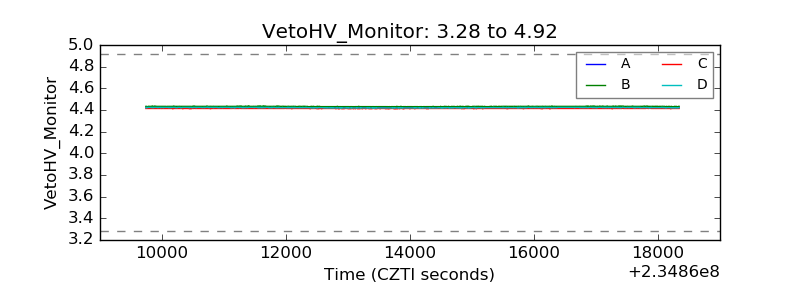 |
| Veto LLD | 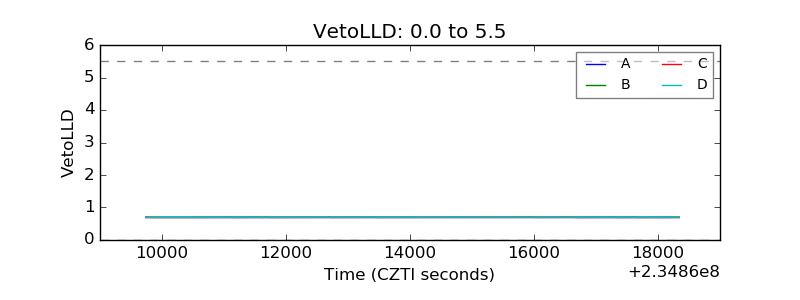 |
| Alpha Counter | 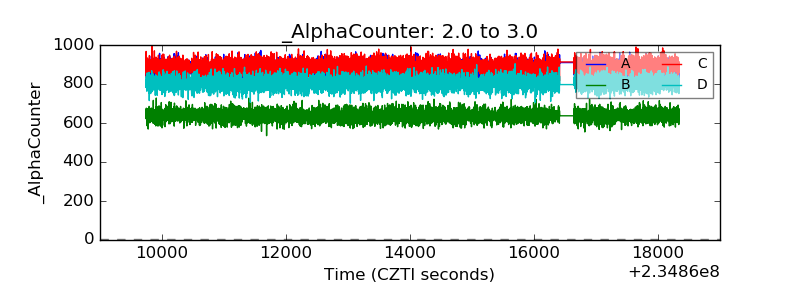 |
| _CPM_Rate | 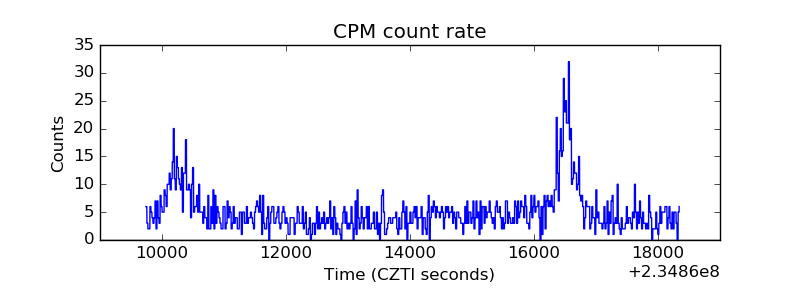 |
| CZT Counter | 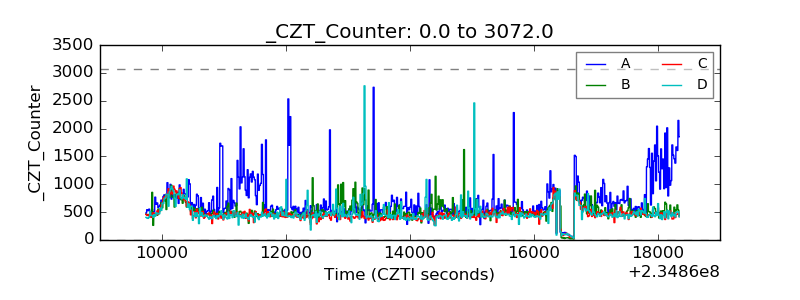 |
| +2.5 Volts monitor | 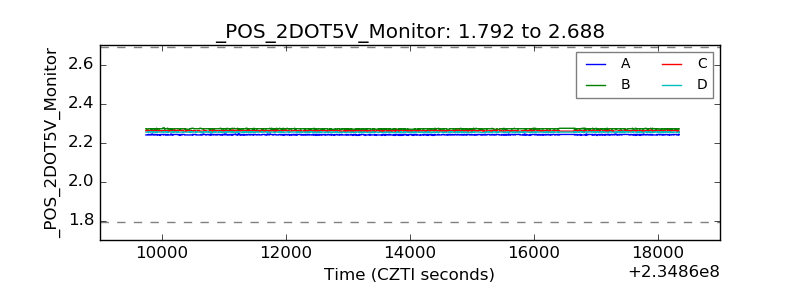 |
| +5 Volts monitor | 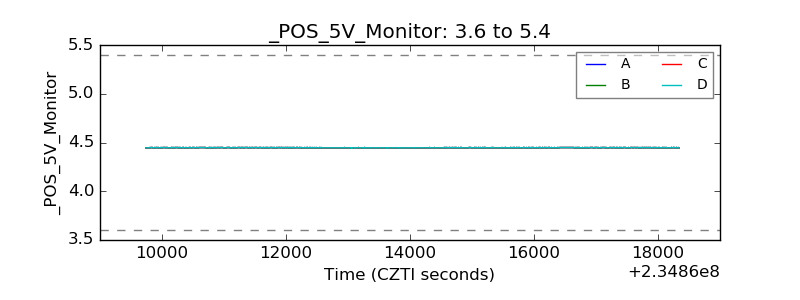 |
| _ROLL_ROT | 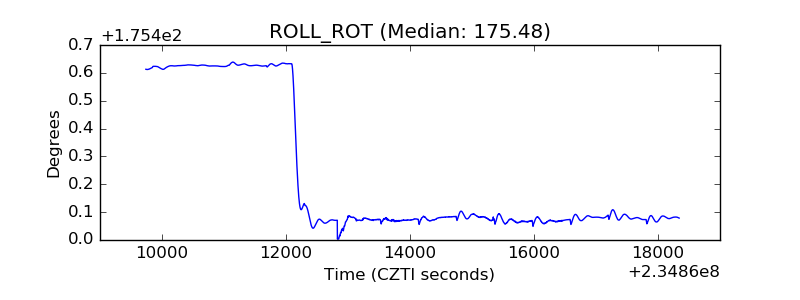 |
| _Roll_DEC | 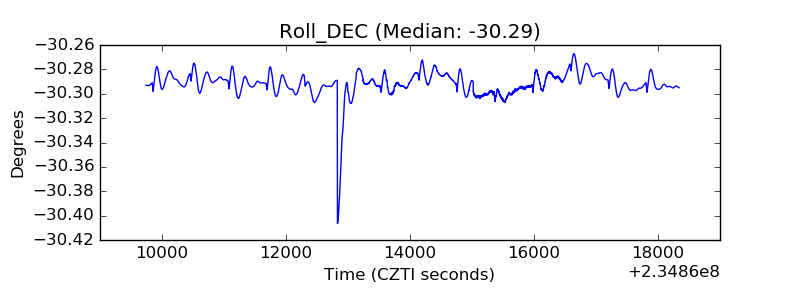 |
| _Roll_RA | 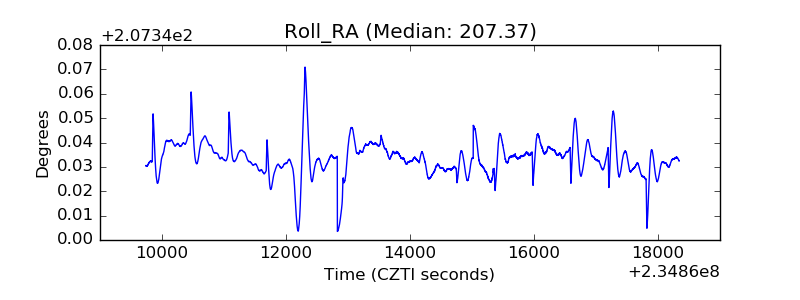 |
| Veto Counter | 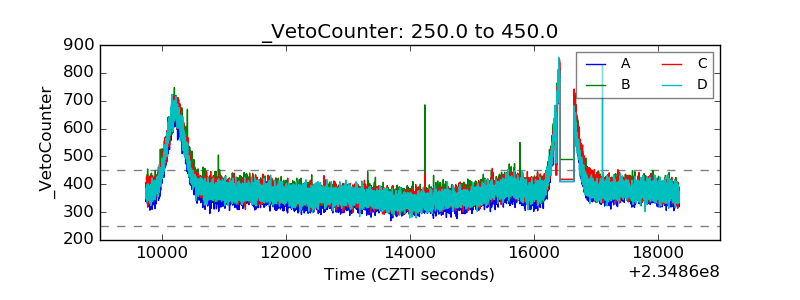 |