| Param | Original file | Final file |
|---|---|---|
| Filename | modeM0/AS1A02_178T01_9000001286_09213cztM0_level2.evt | modeM0/AS1A02_178T01_9000001286_09213cztM0_level2_quad_clean.evt |
| Size (bytes) | 247,317,120 | 41,353,920 |
| Size | 235.9 MB | 39.4 MB |
| Events in quadrant A | 2,759,978 | 236,543 |
| Events in quadrant B | 1,621,173 | 270,773 |
| Events in quadrant C | 1,426,058 | 267,325 |
| Events in quadrant D | 1,471,249 | 257,653 |
| Mode SS | |||
|---|---|---|---|
| Quadrant | BADHDUFLAG | Total packets | Discarded packets |
| A | 0 | 75 | 11 |
| B | 0 | 76 | 12 |
| C | 0 | 76 | 4 |
| D | 0 | 76 | 2 |
| Mode M9 | |||
|---|---|---|---|
| Quadrant | BADHDUFLAG | Total packets | Discarded packets |
| A | 0 | 2 | 0 |
| B | 0 | 2 | 0 |
| C | 0 | 2 | 0 |
| D | 0 | 2 | 0 |
| Mode M0 | |||
|---|---|---|---|
| Quadrant | BADHDUFLAG | Total packets | Discarded packets |
| A | 0 | 13416 | 3155 |
| B | 0 | 7893 | 1012 |
| C | 0 | 7337 | 829 |
| D | 0 | 7493 | 976 |
| Quadrant | Total seconds | Saturated seconds | Saturation percentage |
|---|---|---|---|
| A | 2899 | 325 | 11.210762% |
| B | 3120 | 154 | 4.935897% |
| C | 3143 | 115 | 3.658925% |
| D | 3082 | 125 | 4.055808% |
Noise dominated data is calculated using 1-second bins in cleaned event files. If a bin has >2000 counts, and if more than 50% of those come from <1% of pixels, then it is considered to be noise-dominated and hence unusable.
| Quadrant | # 1 sec bins | Bins with >0 counts | Bins with >2000 counts | High rate bins dominated by noise | Noise dominated (total time) | Noise dominated (detector-on time) | Marked lightcurve |
|---|---|---|---|---|---|---|---|
| A | 3807 | 3200 | 95 | 95 | 2.50% | 2.97% | 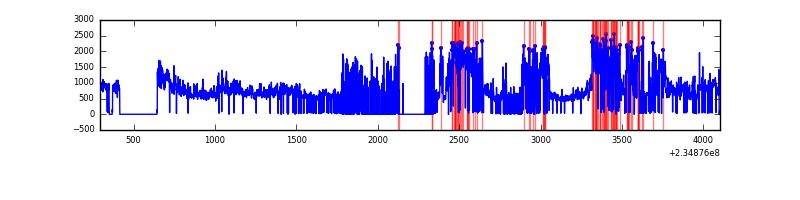 |
| B | 3808 | 3364 | 0 | 0 | 0.00% | 0.00% | 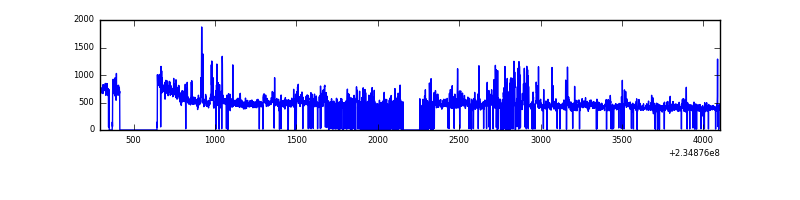 |
| C | 3808 | 3357 | 0 | 0 | 0.00% | 0.00% | 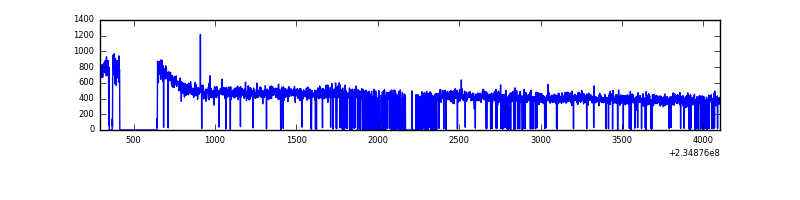 |
| D | 3808 | 3354 | 6 | 6 | 0.16% | 0.18% | 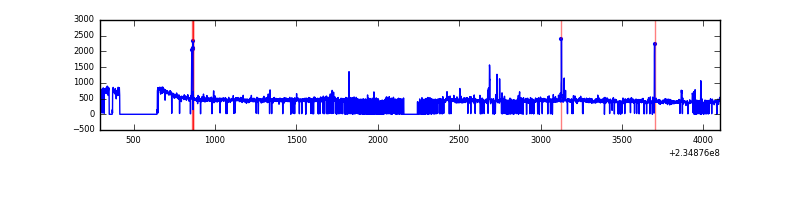 |
Top three noisy pixels from each quadrant. If the there are fewer than three noisy pixels in the level2.evt file, extra rows are filled as -1
| Pixel properties | Quadrant properties | ||||||
|---|---|---|---|---|---|---|---|
| Quadrant | DetID | PixID | Counts | Sigma | Mean | Median | Sigma |
| A | 8 | 5 | 1377940 | 19007.59 | 342 | 334 | 72.5 |
| A | 1 | 162 | 36238 | 495.39 | 342 | 334 | 72.5 |
| A | 1 | 178 | 6957 | 91.38 | 342 | 334 | 72.5 |
| B | 8 | 234 | 141723 | 1917.94 | 371 | 361 | 73.7 |
| B | 0 | 214 | 19930 | 265.5 | 371 | 361 | 73.7 |
| B | 12 | 111 | 7526 | 97.21 | 371 | 361 | 73.7 |
| C | 3 | 233 | 5668 | 61.52 | 363 | 363 | 86.2 |
| C | 13 | 61 | 2774 | 27.96 | 363 | 363 | 86.2 |
| C | 8 | 222 | 1408 | 12.12 | 363 | 363 | 86.2 |
| D | 1 | 52 | 45738 | 483.38 | 360 | 349 | 93.9 |
| D | 8 | 195 | 25612 | 269.05 | 360 | 349 | 93.9 |
| D | 2 | 234 | 12517 | 129.59 | 360 | 349 | 93.9 |
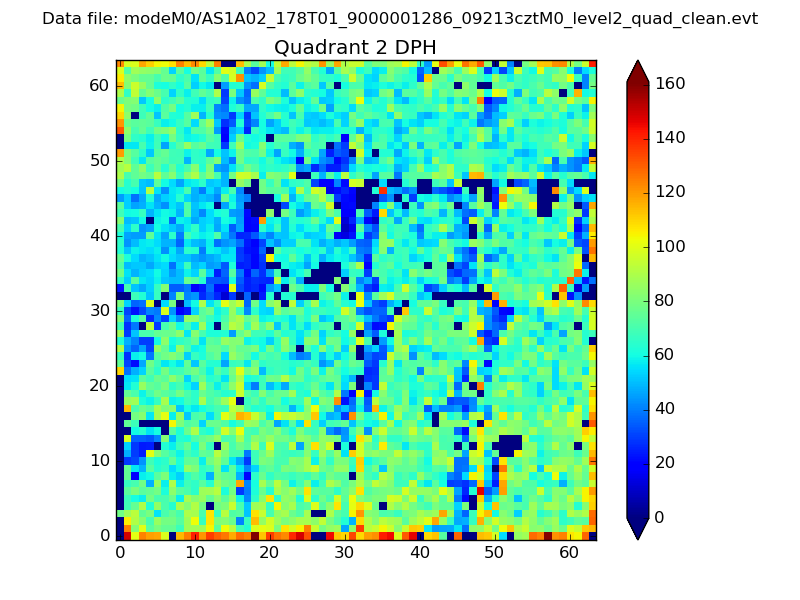
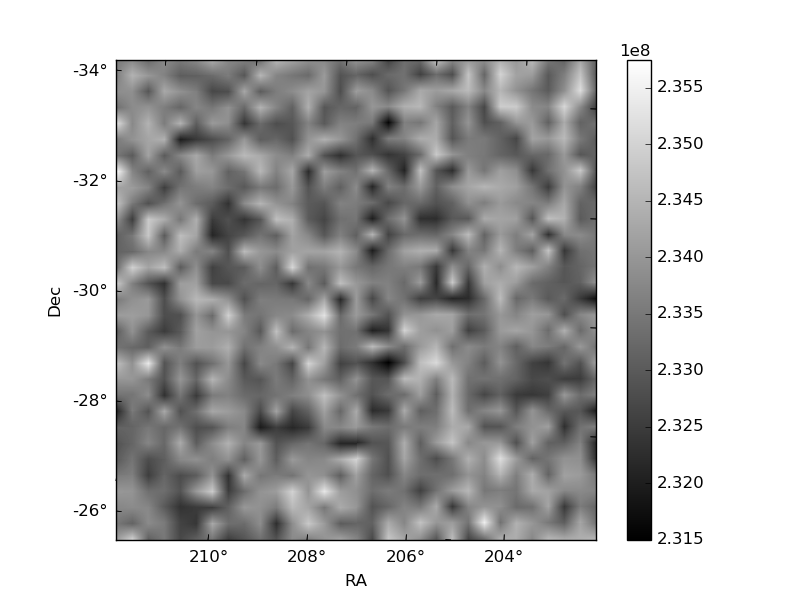
Histogram calculated using DETX and DETY for each event in the final _common_clean file
| Quadrant A | 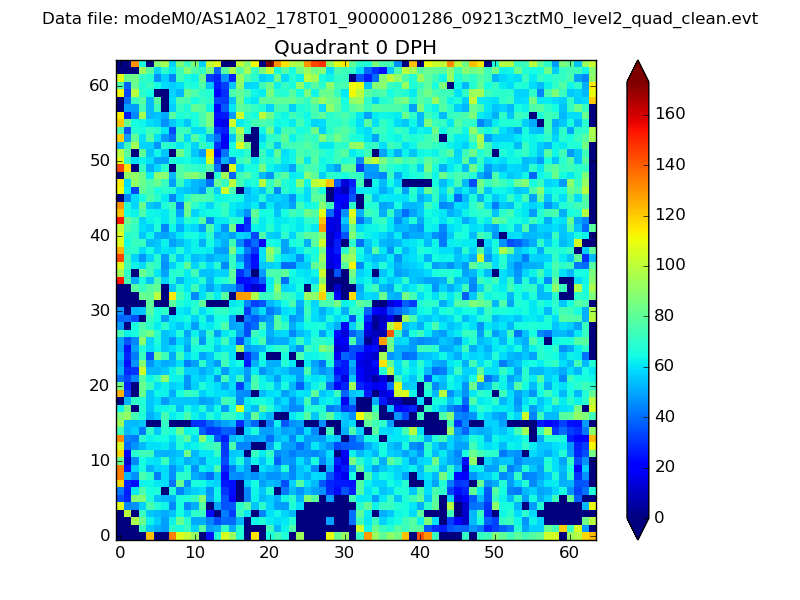 |
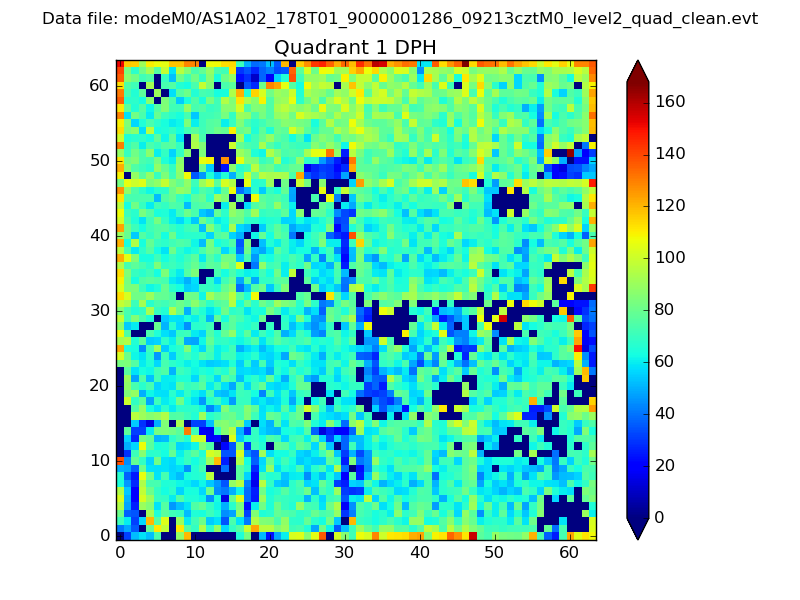 |
Quadrant B |
|---|---|---|---|
| Quadrant D | 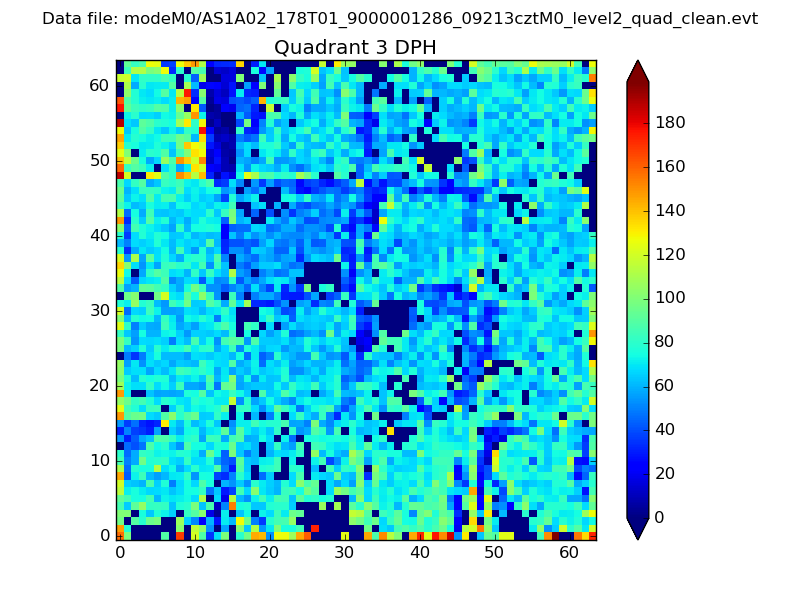 |
 |
Quadrant C |
| Plot type | Count rate plots | Images |
|---|---|---|
| Comparison with Poisson distribution Blue bars denote a histogram of data divided into 1 sec bins. Red curve is a Poisson curve with rate = median count rate of data. |
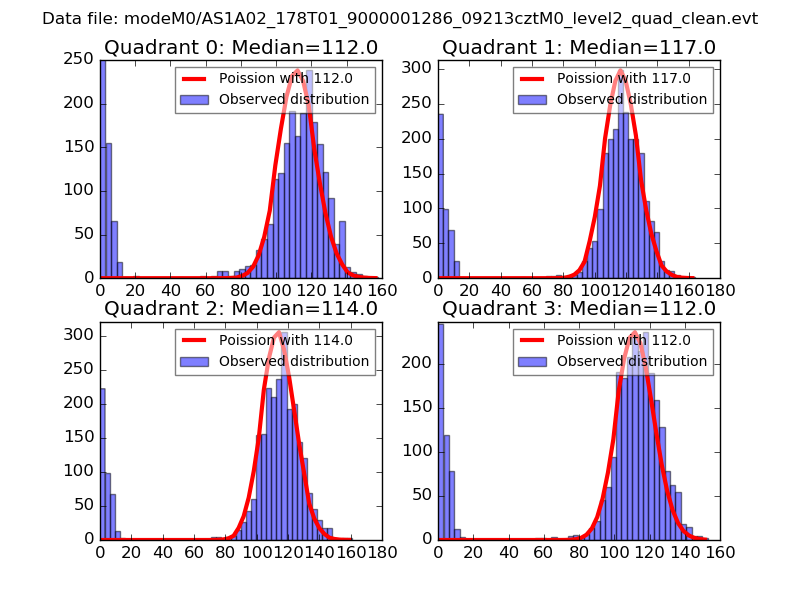 |
 |
| Quadrant-wise count rates Data is divided into 100 sec bins |
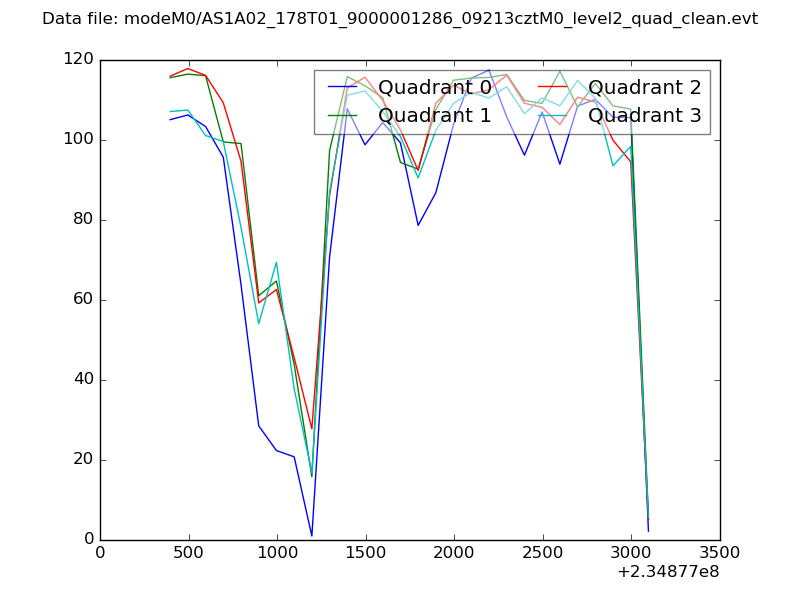 |
|
| Module-wise count rates for Quadrant A Data is divided into 100 sec bins |
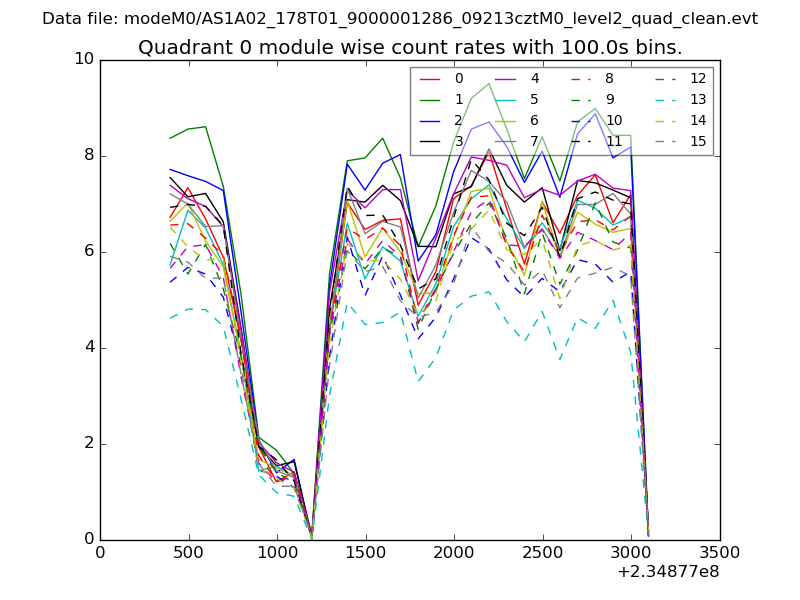 |
 |
| Module-wise count rates for Quadrant B Data is divided into 100 sec bins |
 |
 |
| Module-wise count rates for Quadrant C Data is divided into 100 sec bins |
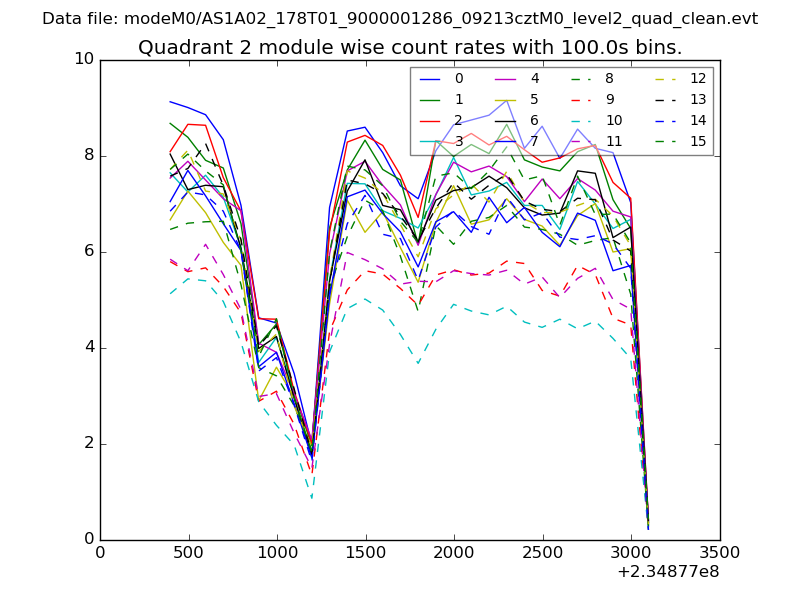 |
 |
| Module-wise count rates for Quadrant D Data is divided into 100 sec bins |
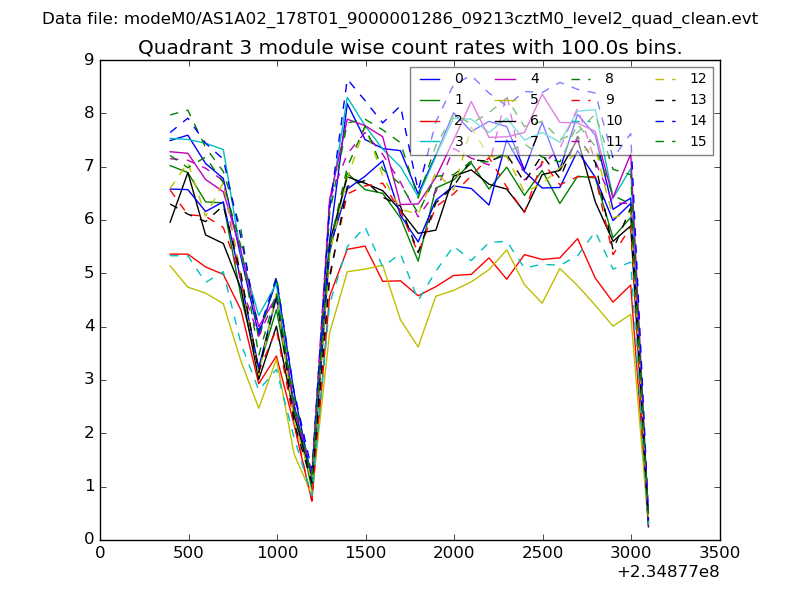 |
 |
| Parameter | Plot |
|---|---|
| CZT HV Monitor | 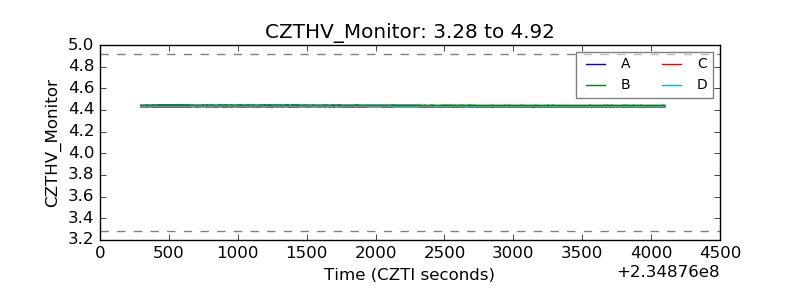 |
| D_VDD | 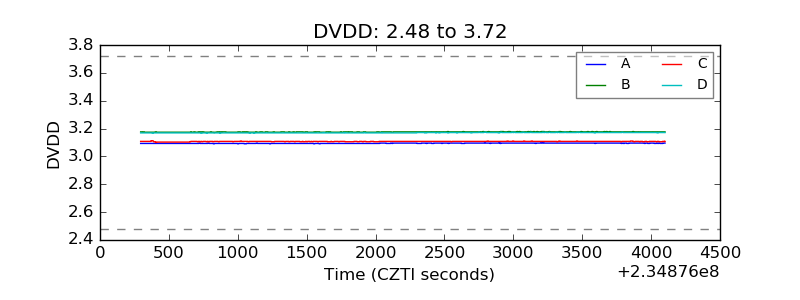 |
| Temperature 1 | 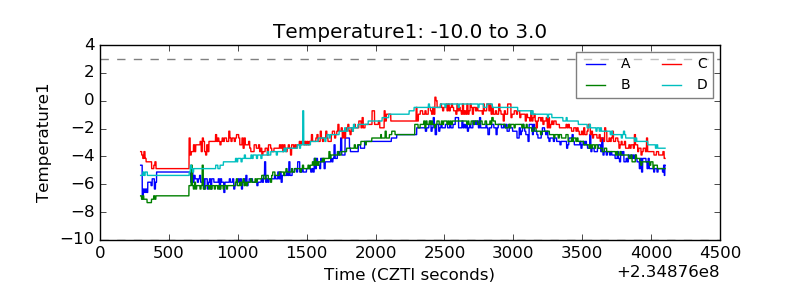 |
| Veto HV Monitor | 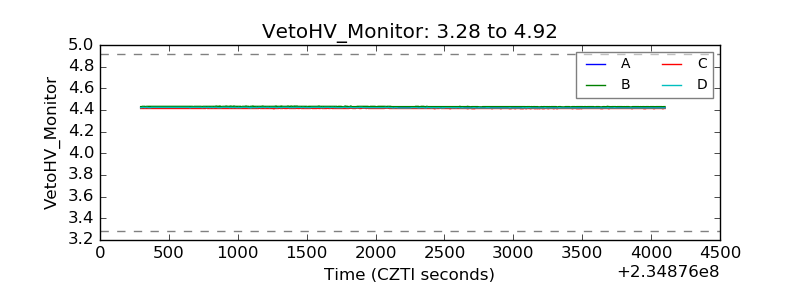 |
| Veto LLD | 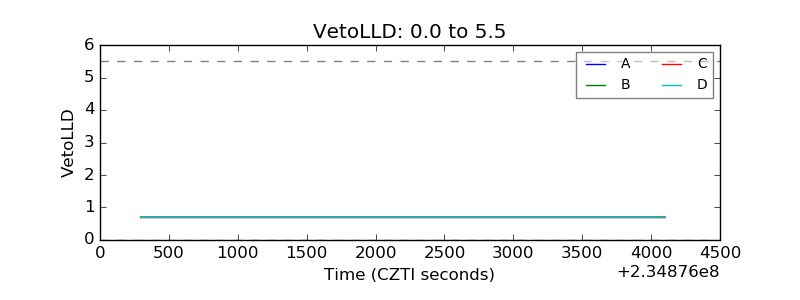 |
| Alpha Counter | 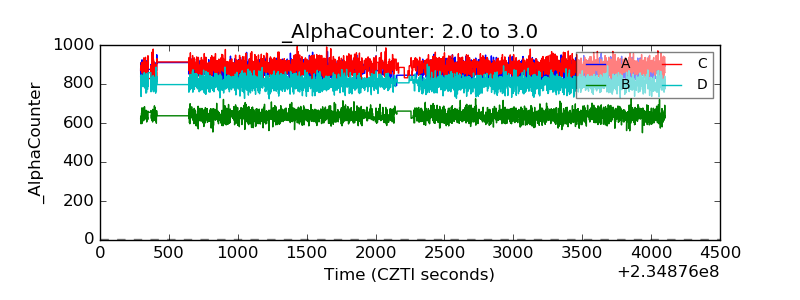 |
| _CPM_Rate | 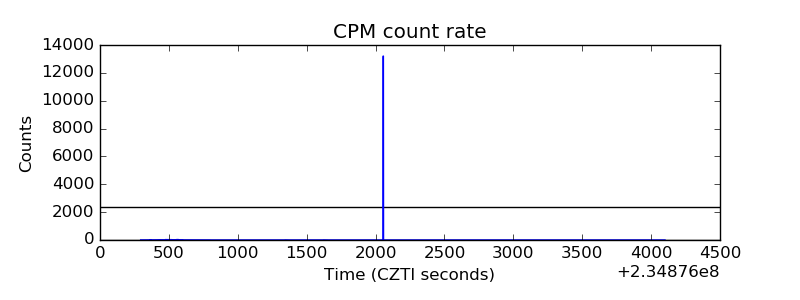 |
| CZT Counter | 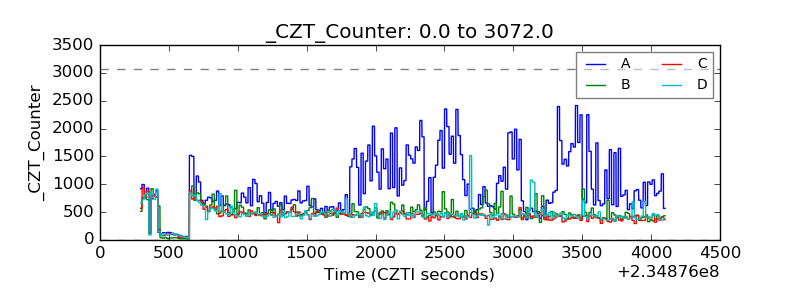 |
| +2.5 Volts monitor |  |
| +5 Volts monitor | 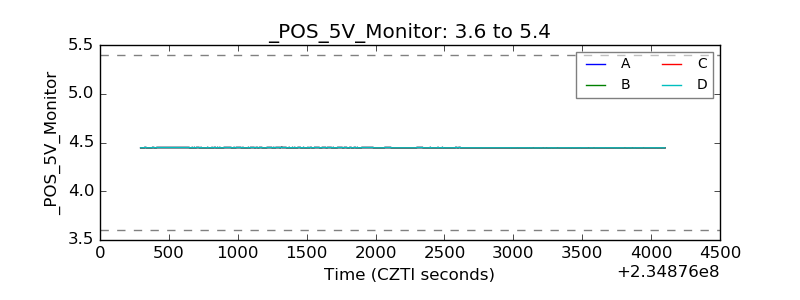 |
| _ROLL_ROT | 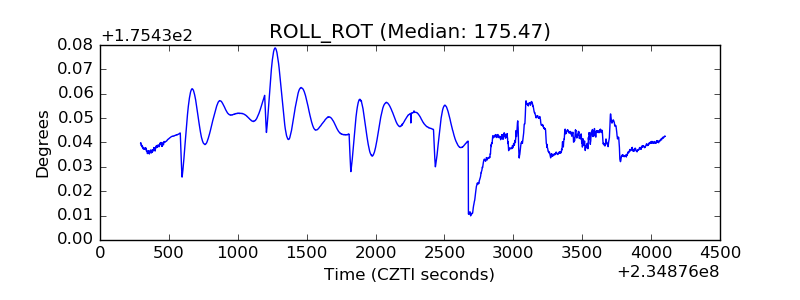 |
| _Roll_DEC | 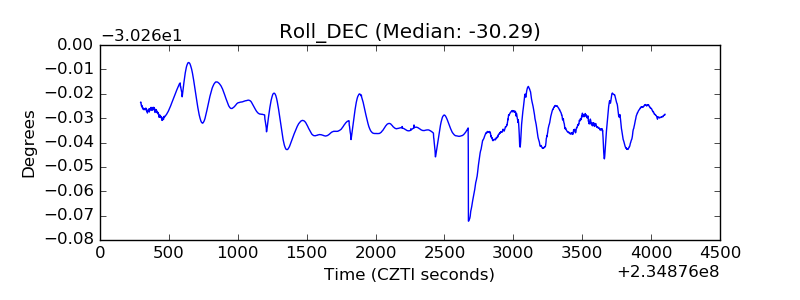 |
| _Roll_RA | 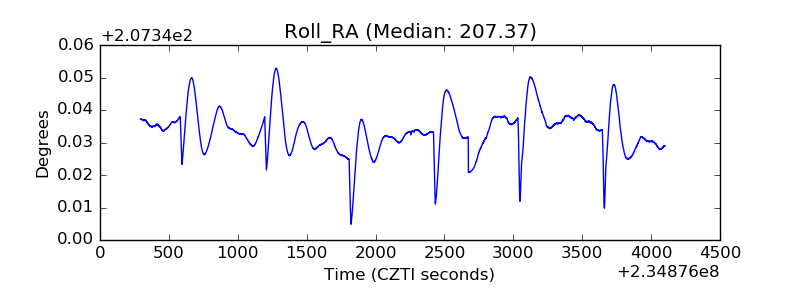 |
| Veto Counter | 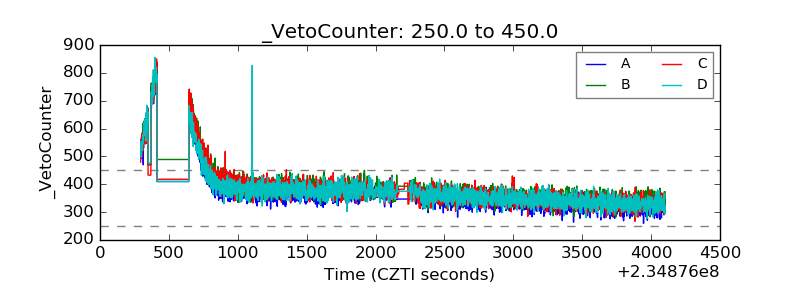 |