| Param | Original file | Final file |
|---|---|---|
| Filename | modeM0/AS1A02_178T01_9000001286_09214cztM0_level2.evt | modeM0/AS1A02_178T01_9000001286_09214cztM0_level2_quad_clean.evt |
| Size (bytes) | 1,893,191,040 | 298,071,360 |
| Size | 1.8 GB | 284.3 MB |
| Events in quadrant A | 17,888,770 | 1,820,829 |
| Events in quadrant B | 13,302,081 | 1,864,842 |
| Events in quadrant C | 11,398,958 | 1,841,121 |
| Events in quadrant D | 13,067,554 | 1,791,540 |
| Mode SS | |||
|---|---|---|---|
| Quadrant | BADHDUFLAG | Total packets | Discarded packets |
| A | 0 | 532 | 20 |
| B | 0 | 532 | 26 |
| C | 0 | 532 | 46 |
| D | 0 | 532 | 28 |
| Mode M9 | |||
|---|---|---|---|
| Quadrant | BADHDUFLAG | Total packets | Discarded packets |
| A | 0 | 23 | 0 |
| B | 0 | 23 | 0 |
| C | 0 | 23 | 0 |
| D | 0 | 23 | 0 |
| Mode M0 | |||
|---|---|---|---|
| Quadrant | BADHDUFLAG | Total packets | Discarded packets |
| A | 0 | 75202 | 5517 |
| B | 0 | 58864 | 3180 |
| C | 0 | 53937 | 2763 |
| D | 0 | 59205 | 3298 |
| Quadrant | Total seconds | Saturated seconds | Saturation percentage |
|---|---|---|---|
| A | 24616 | 1102 | 4.476763% |
| B | 24882 | 682 | 2.740937% |
| C | 24958 | 449 | 1.799022% |
| D | 24886 | 763 | 3.065981% |
Noise dominated data is calculated using 1-second bins in cleaned event files. If a bin has >2000 counts, and if more than 50% of those come from <1% of pixels, then it is considered to be noise-dominated and hence unusable.
| Quadrant | # 1 sec bins | Bins with >0 counts | Bins with >2000 counts | High rate bins dominated by noise | Noise dominated (total time) | Noise dominated (detector-on time) | Marked lightcurve |
|---|---|---|---|---|---|---|---|
| A | 28575 | 25764 | 264 | 264 | 0.92% | 1.02% | 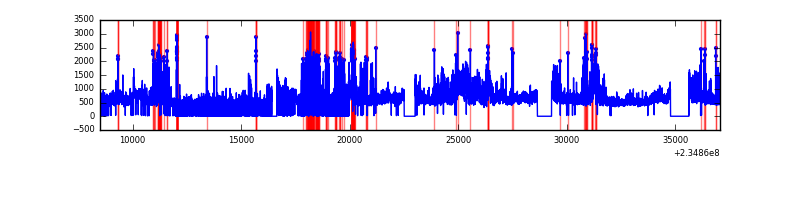 |
| B | 28575 | 25934 | 33 | 33 | 0.12% | 0.13% |  |
| C | 28575 | 25993 | 0 | 0 | 0.00% | 0.00% |  |
| D | 28575 | 25916 | 286 | 286 | 1.00% | 1.10% | 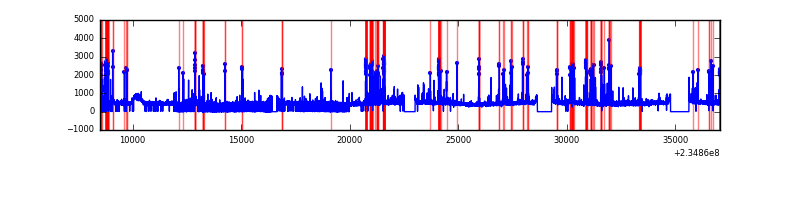 |
Top three noisy pixels from each quadrant. If the there are fewer than three noisy pixels in the level2.evt file, extra rows are filled as -1
| Pixel properties | Quadrant properties | ||||||
|---|---|---|---|---|---|---|---|
| Quadrant | DetID | PixID | Counts | Sigma | Mean | Median | Sigma |
| A | 8 | 5 | 5729663 | 9635.45 | 2940 | 2873 | 594.3 |
| A | 1 | 162 | 323724 | 539.84 | 2940 | 2873 | 594.3 |
| A | 15 | 174 | 160986 | 266.03 | 2940 | 2873 | 594.3 |
| B | 8 | 234 | 1020696 | 1782.21 | 2989 | 2916 | 571.1 |
| B | 0 | 214 | 121117 | 206.98 | 2989 | 2916 | 571.1 |
| B | 4 | 48 | 117409 | 200.49 | 2989 | 2916 | 571.1 |
| C | 3 | 233 | 67859 | 96.78 | 2896 | 2902 | 671.2 |
| C | 7 | 221 | 23962 | 31.38 | 2896 | 2902 | 671.2 |
| C | 13 | 61 | 22055 | 28.53 | 2896 | 2902 | 671.2 |
| D | 1 | 52 | 992631 | 1308.07 | 2877 | 2805 | 756.7 |
| D | 9 | 64 | 272794 | 356.79 | 2877 | 2805 | 756.7 |
| D | 2 | 14 | 255687 | 334.19 | 2877 | 2805 | 756.7 |
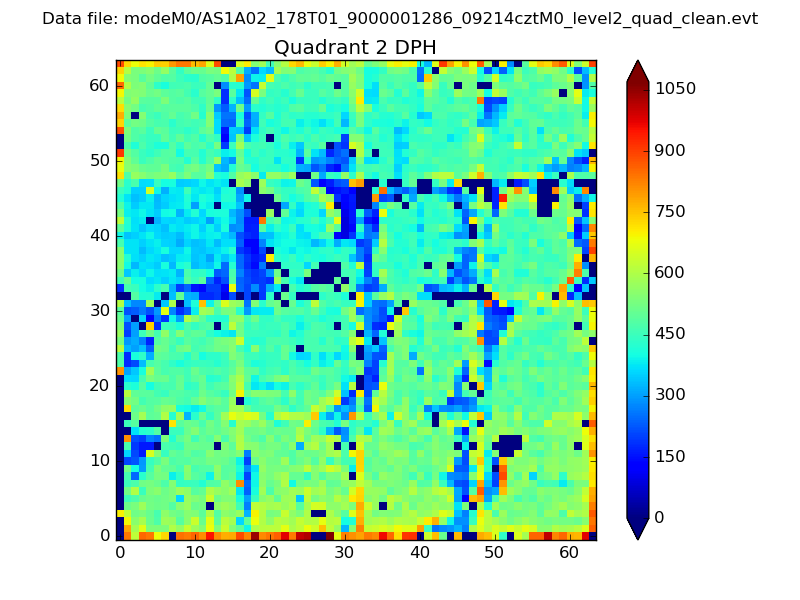
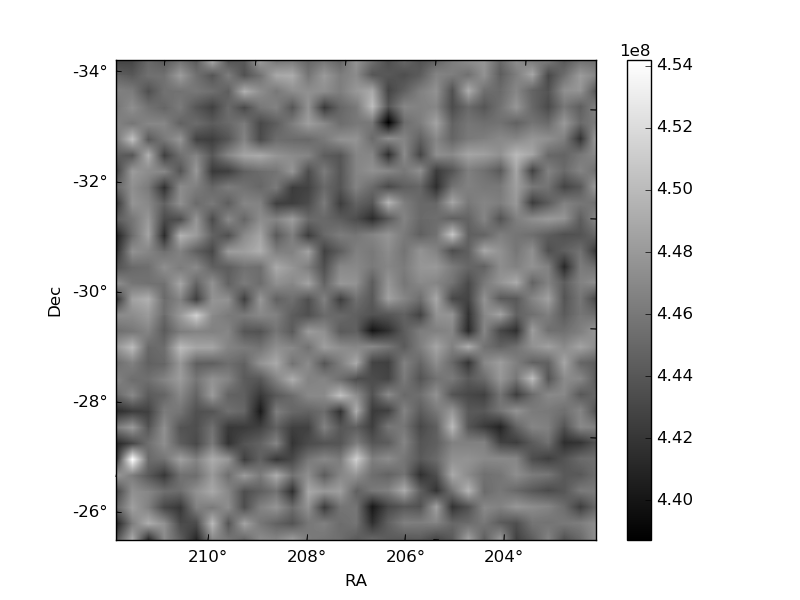
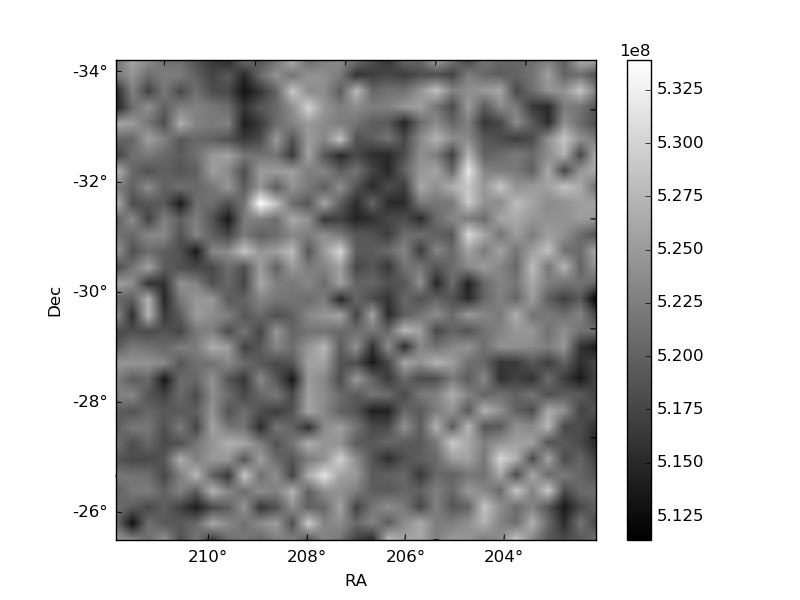
Histogram calculated using DETX and DETY for each event in the final _common_clean file
| Quadrant A | 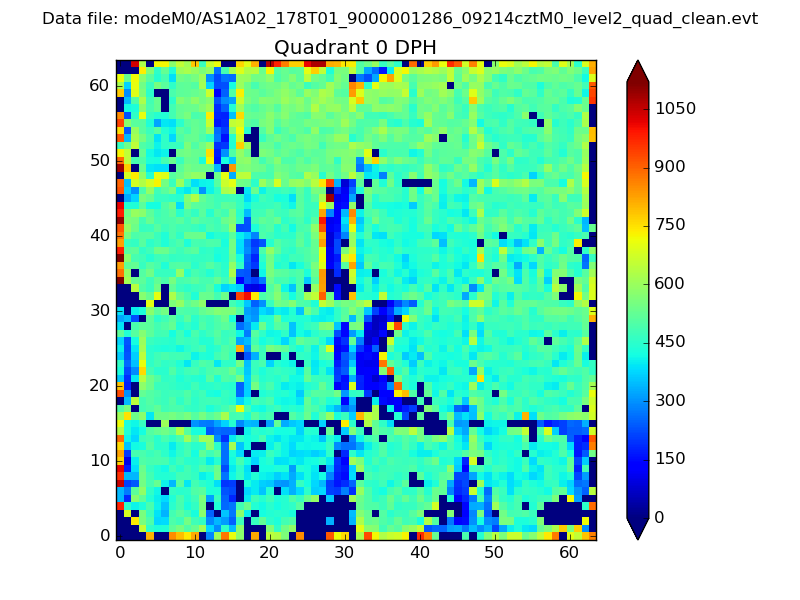 |
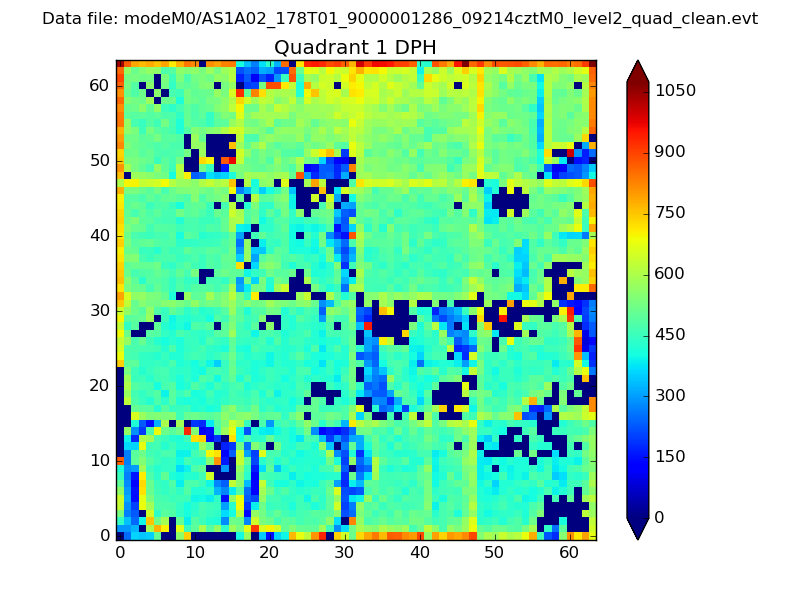 |
Quadrant B |
|---|---|---|---|
| Quadrant D | 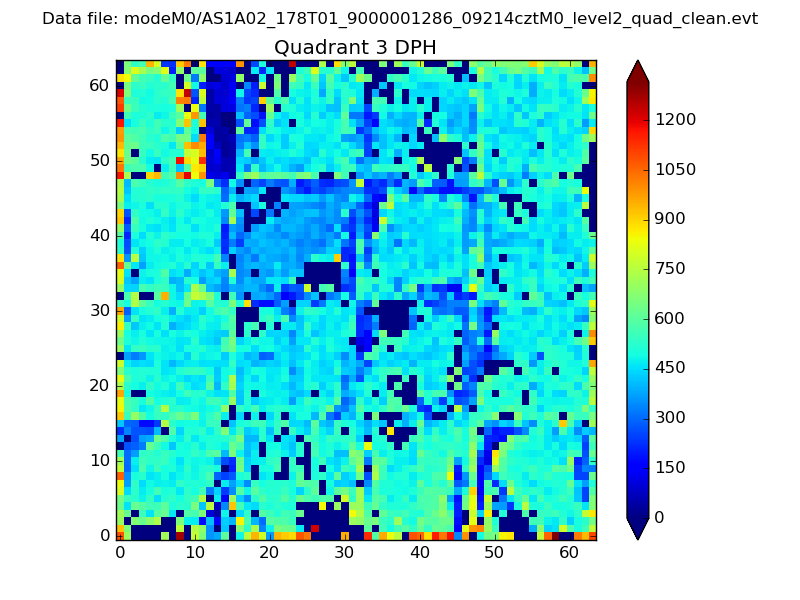 |
 |
Quadrant C |
| Plot type | Count rate plots | Images |
|---|---|---|
| Comparison with Poisson distribution Blue bars denote a histogram of data divided into 1 sec bins. Red curve is a Poisson curve with rate = median count rate of data. |
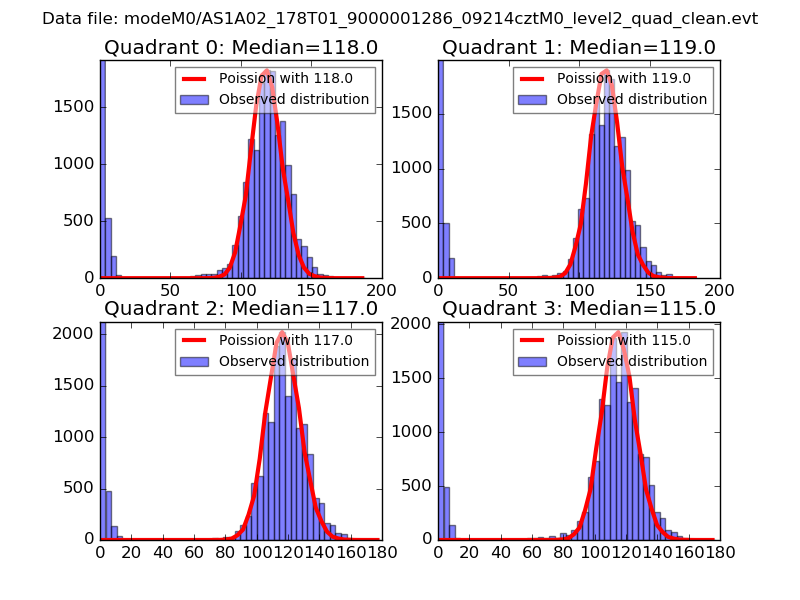 |
 |
| Quadrant-wise count rates Data is divided into 100 sec bins |
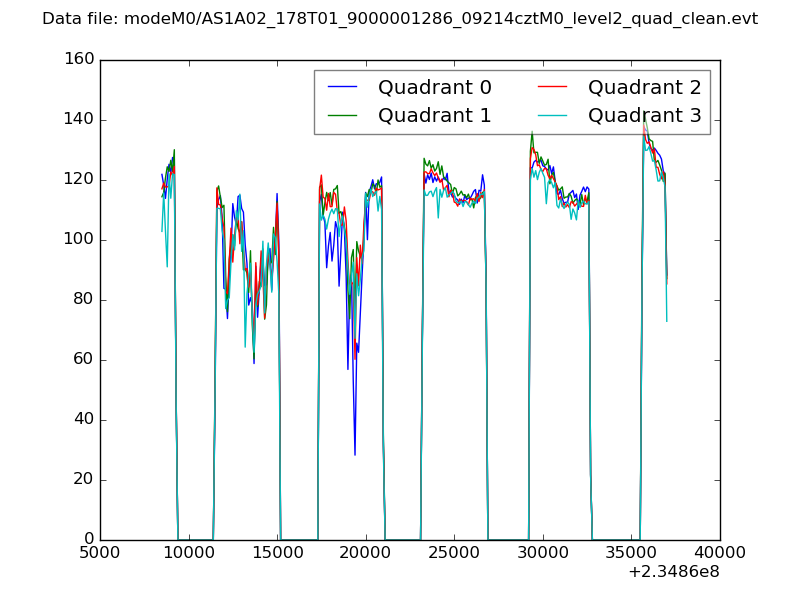 |
|
| Module-wise count rates for Quadrant A Data is divided into 100 sec bins |
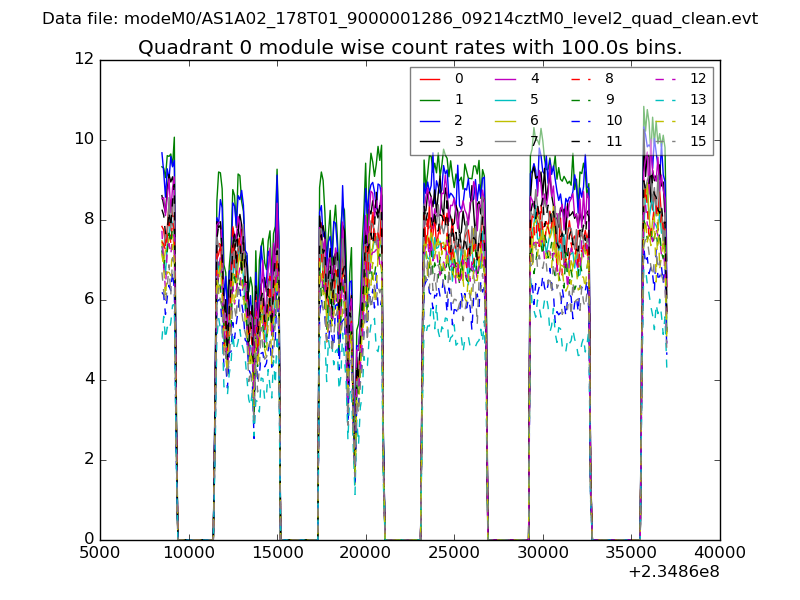 |
 |
| Module-wise count rates for Quadrant B Data is divided into 100 sec bins |
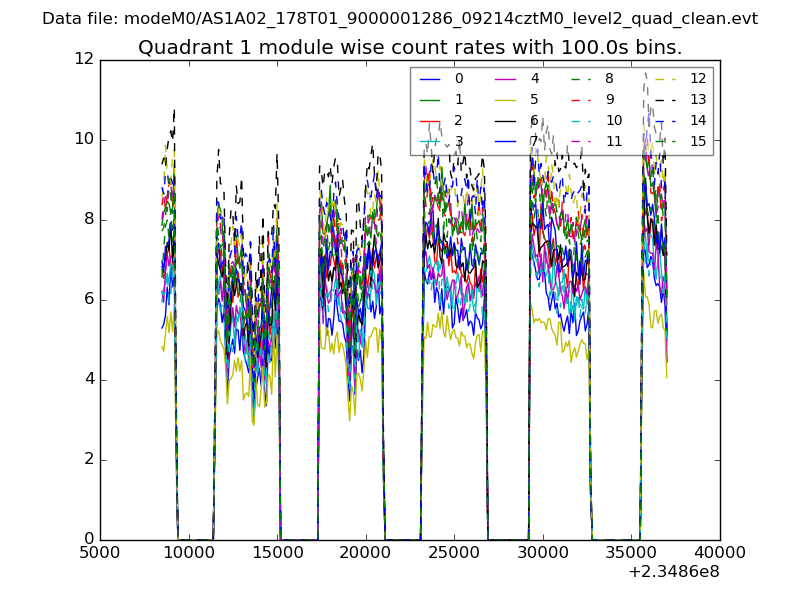 |
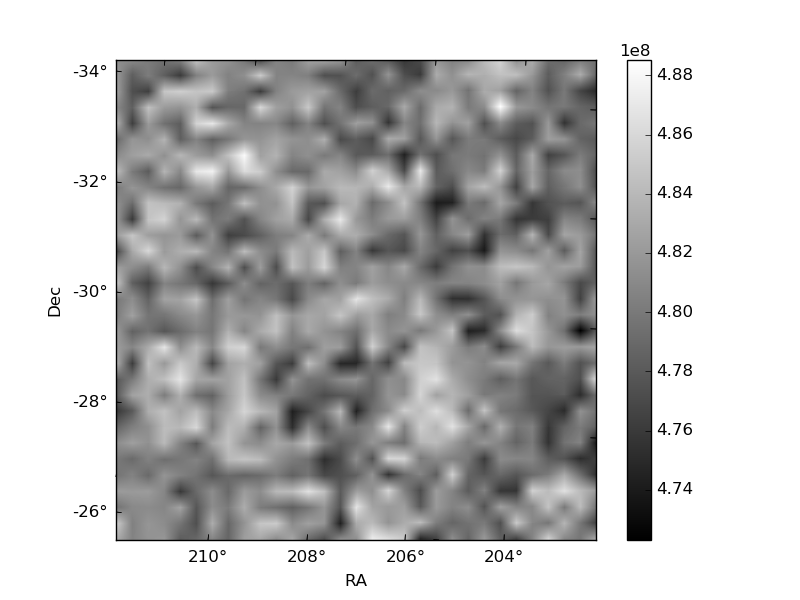 |
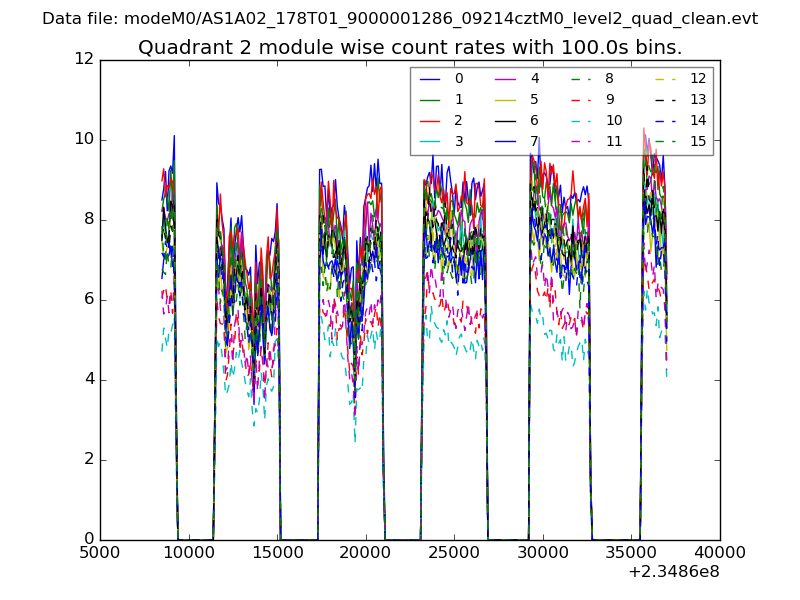
| Module-wise count rates for Quadrant C Data is divided into 100 sec bins |
 |
 |
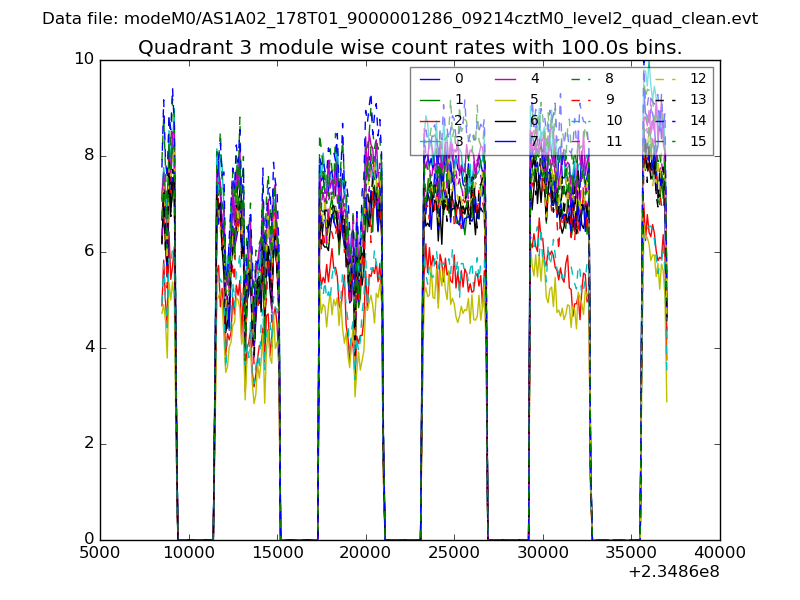
| Module-wise count rates for Quadrant D Data is divided into 100 sec bins |
 |
 |
| Parameter | Plot |
|---|---|
| CZT HV Monitor | 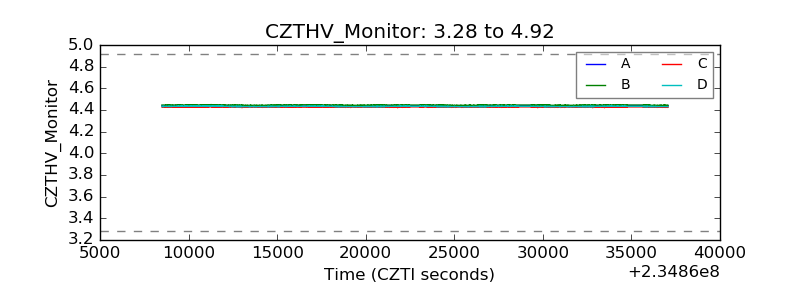 |
| D_VDD | 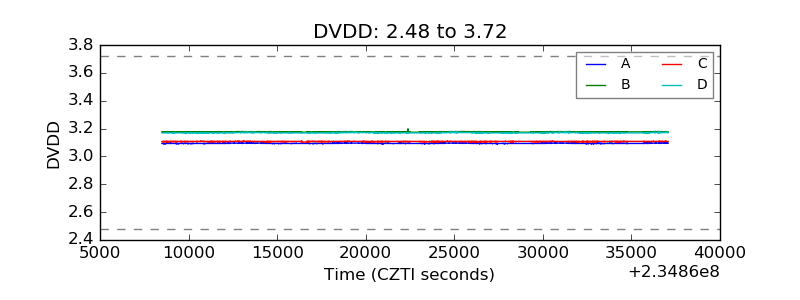 |
| Temperature 1 | 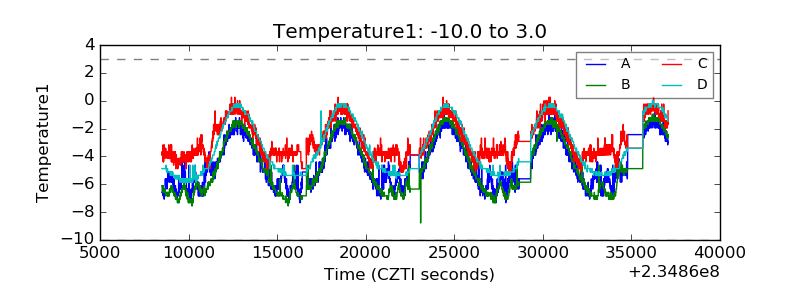 |
| Veto HV Monitor | 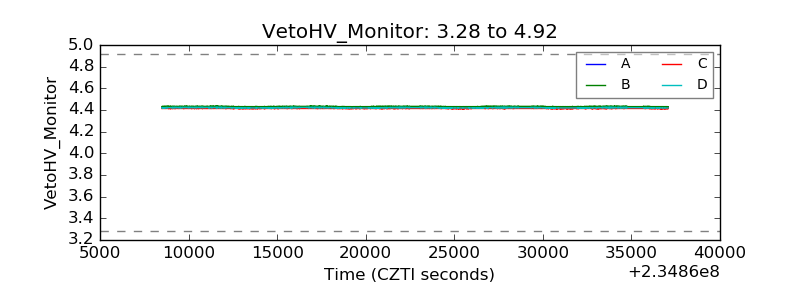 |
| Veto LLD | 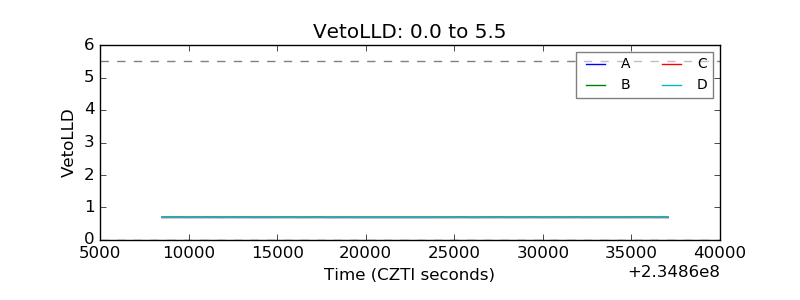 |
| Alpha Counter | 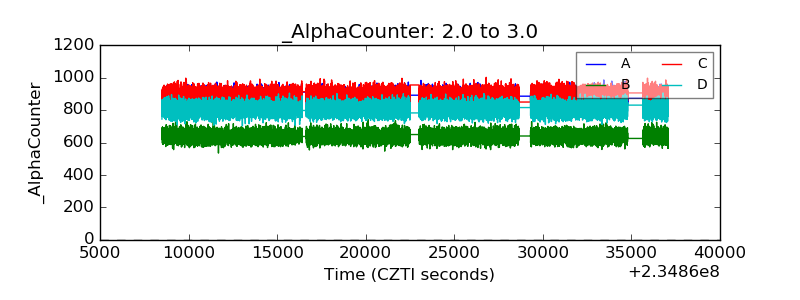 |
| _CPM_Rate | 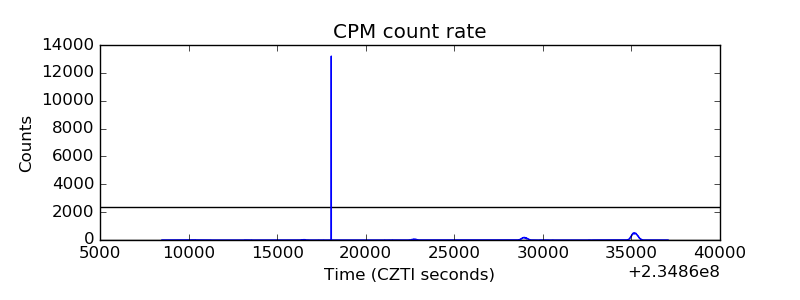 |
| CZT Counter | 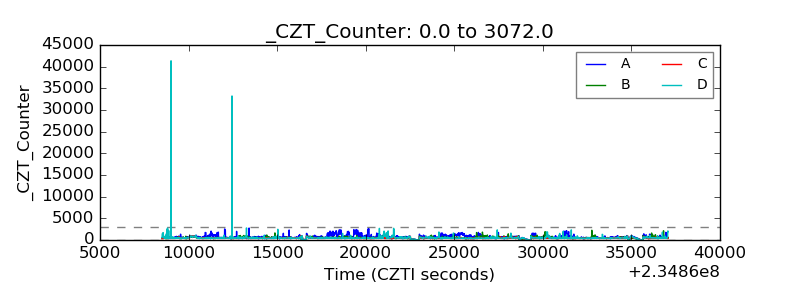 |
| +2.5 Volts monitor | 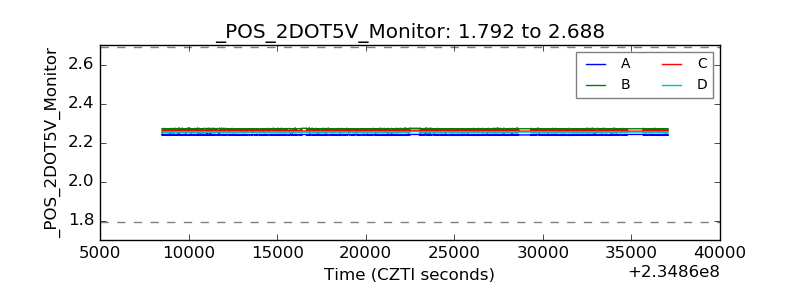 |
| +5 Volts monitor |  |
| _ROLL_ROT | 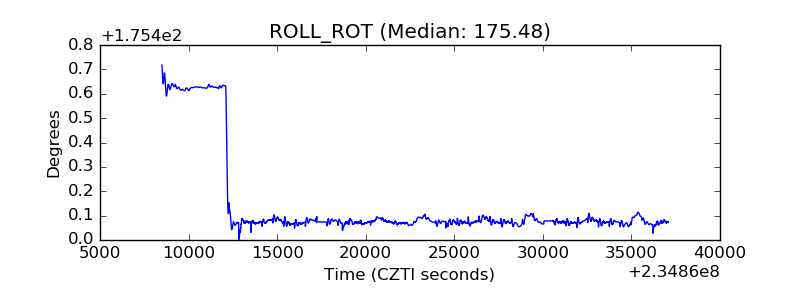 |
| _Roll_DEC | 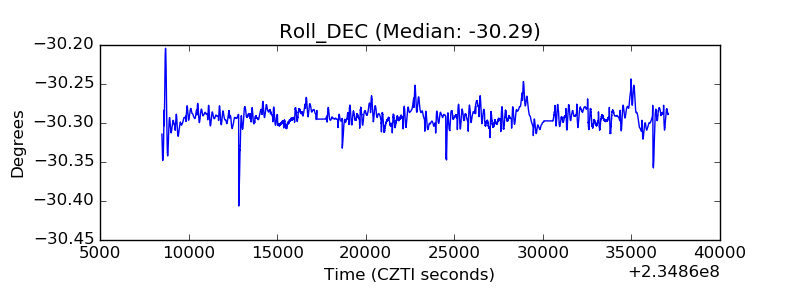 |
| _Roll_RA | 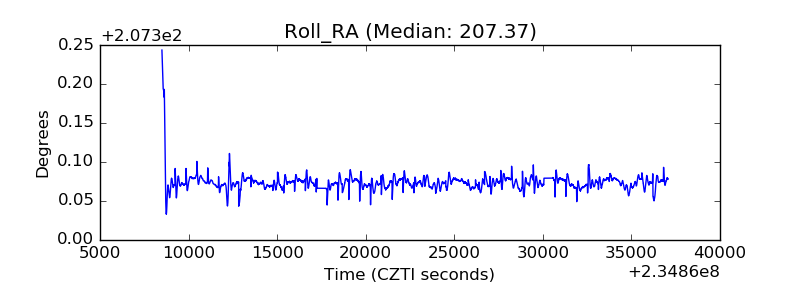 |
| Veto Counter | 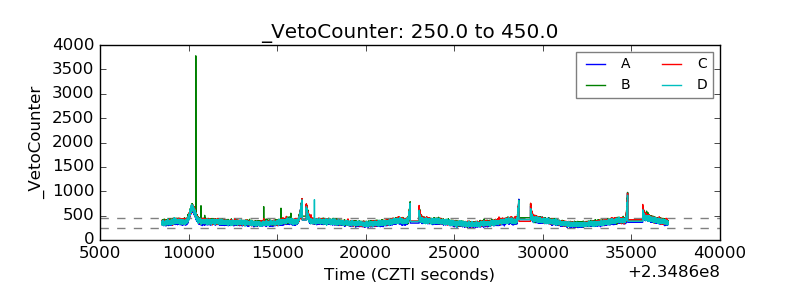 |