| Param | Original file | Final file |
|---|---|---|
| Filename | modeM0/AS1A02_178T01_9000001286_09215cztM0_level2.evt | modeM0/AS1A02_178T01_9000001286_09215cztM0_level2_quad_clean.evt |
| Size (bytes) | 1,341,132,480 | 223,804,800 |
| Size | 1.2 GB | 213.4 MB |
| Events in quadrant A | 12,649,372 | 1,404,180 |
| Events in quadrant B | 9,872,602 | 1,411,486 |
| Events in quadrant C | 7,972,090 | 1,384,642 |
| Events in quadrant D | 8,928,083 | 1,358,793 |
| Mode SS | |||
|---|---|---|---|
| Quadrant | BADHDUFLAG | Total packets | Discarded packets |
| A | 0 | 360 | 0 |
| B | 0 | 360 | 2 |
| C | 0 | 360 | 0 |
| D | 0 | 360 | 0 |
| Mode M9 | |||
|---|---|---|---|
| Quadrant | BADHDUFLAG | Total packets | Discarded packets |
| A | 0 | 26 | 0 |
| B | 0 | 26 | 0 |
| C | 0 | 26 | 0 |
| D | 0 | 26 | 0 |
| Mode M0 | |||
|---|---|---|---|
| Quadrant | BADHDUFLAG | Total packets | Discarded packets |
| A | 0 | 49764 | 18 |
| B | 0 | 40982 | 32 |
| C | 0 | 36075 | 20 |
| D | 0 | 38785 | 25 |
| Quadrant | Total seconds | Saturated seconds | Saturation percentage |
|---|---|---|---|
| A | 17695 | 406 | 2.294433% |
| B | 17692 | 262 | 1.480895% |
| C | 17693 | 109 | 0.616063% |
| D | 17691 | 283 | 1.599683% |
Noise dominated data is calculated using 1-second bins in cleaned event files. If a bin has >2000 counts, and if more than 50% of those come from <1% of pixels, then it is considered to be noise-dominated and hence unusable.
| Quadrant | # 1 sec bins | Bins with >0 counts | Bins with >2000 counts | High rate bins dominated by noise | Noise dominated (total time) | Noise dominated (detector-on time) | Marked lightcurve |
|---|---|---|---|---|---|---|---|
| A | 20221 | 17704 | 110 | 110 | 0.54% | 0.62% | 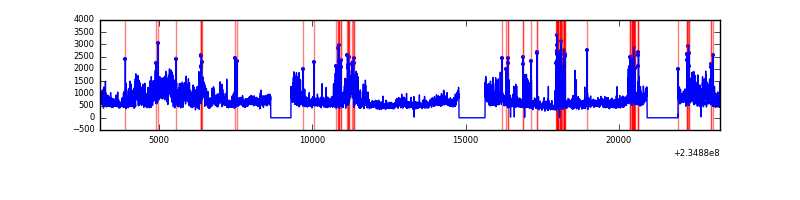 |
| B | 20221 | 17703 | 62 | 62 | 0.31% | 0.35% | 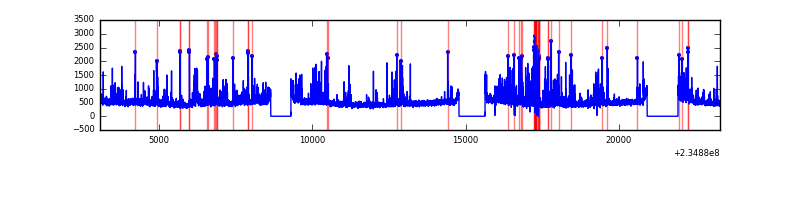 |
| C | 20221 | 17704 | 0 | 0 | 0.00% | 0.00% | 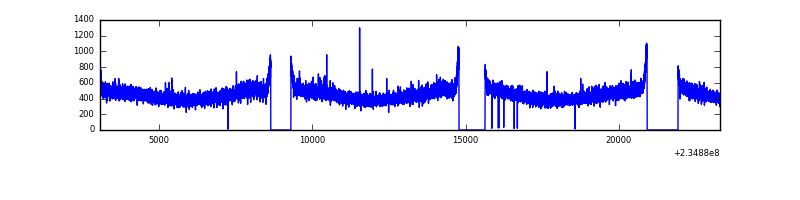 |
| D | 20221 | 17704 | 140 | 140 | 0.69% | 0.79% | 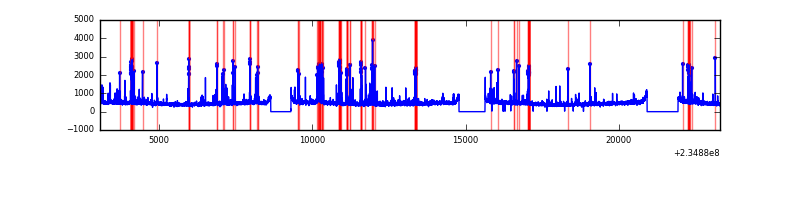 |
Top three noisy pixels from each quadrant. If the there are fewer than three noisy pixels in the level2.evt file, extra rows are filled as -1
| Pixel properties | Quadrant properties | ||||||
|---|---|---|---|---|---|---|---|
| Quadrant | DetID | PixID | Counts | Sigma | Mean | Median | Sigma |
| A | 8 | 5 | 3781900 | 8933.87 | 2098 | 2054 | 423.1 |
| A | 5 | 16 | 238128 | 557.97 | 2098 | 2054 | 423.1 |
| A | 1 | 162 | 202875 | 474.65 | 2098 | 2054 | 423.1 |
| B | 8 | 234 | 1064968 | 2652.69 | 2101 | 2055 | 400.7 |
| B | 0 | 214 | 119755 | 293.74 | 2101 | 2055 | 400.7 |
| B | 0 | 246 | 96036 | 234.54 | 2101 | 2055 | 400.7 |
| C | 3 | 233 | 49180 | 100.25 | 2022 | 2029 | 470.3 |
| C | 7 | 221 | 26757 | 52.58 | 2022 | 2029 | 470.3 |
| C | 13 | 61 | 15421 | 28.47 | 2022 | 2029 | 470.3 |
| D | 1 | 52 | 301919 | 553.06 | 2013 | 1967 | 542.3 |
| D | 9 | 64 | 246935 | 451.68 | 2013 | 1967 | 542.3 |
| D | 2 | 14 | 220189 | 402.36 | 2013 | 1967 | 542.3 |
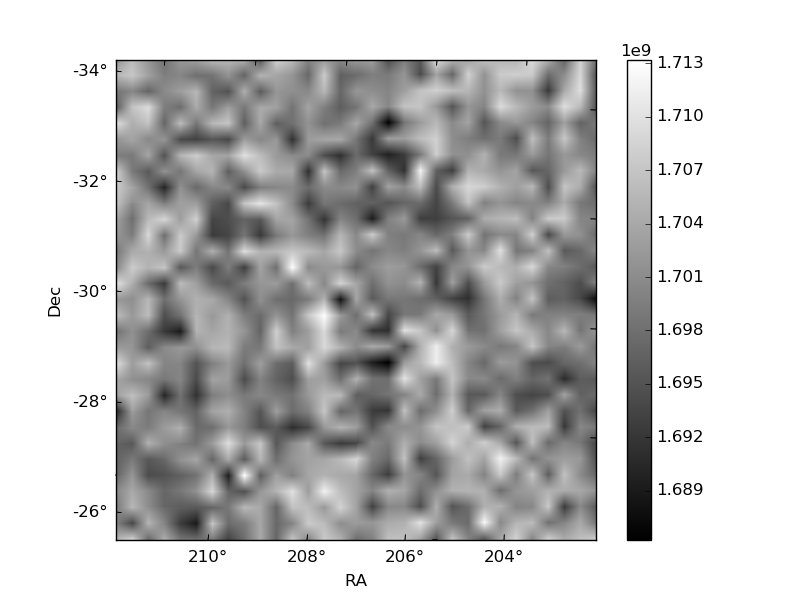
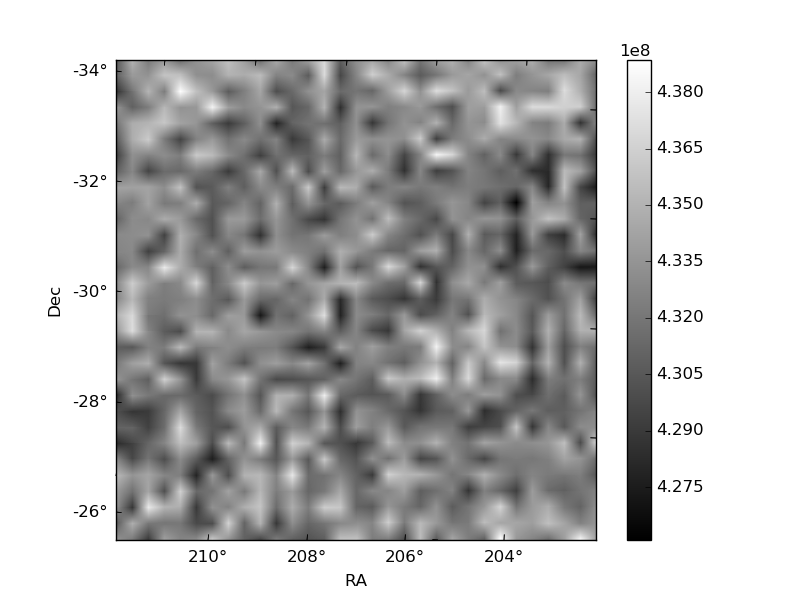
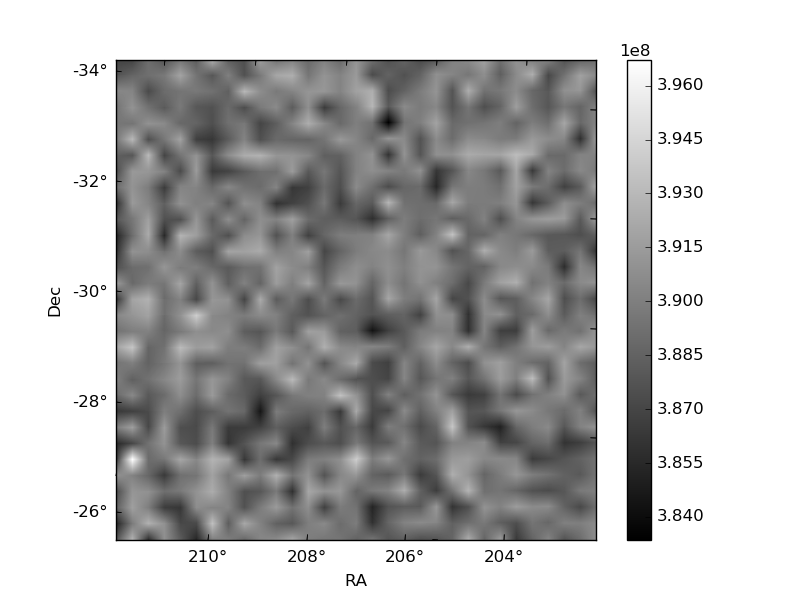
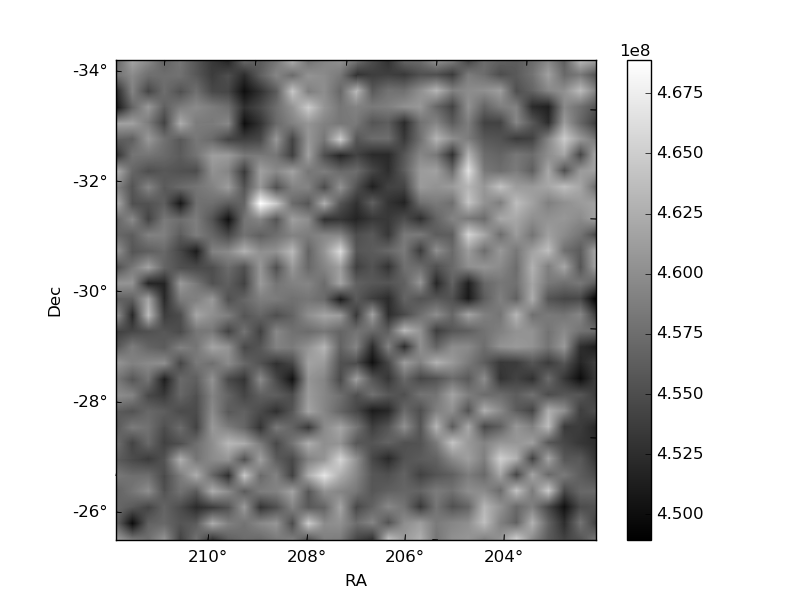
Histogram calculated using DETX and DETY for each event in the final _common_clean file
| Quadrant A | 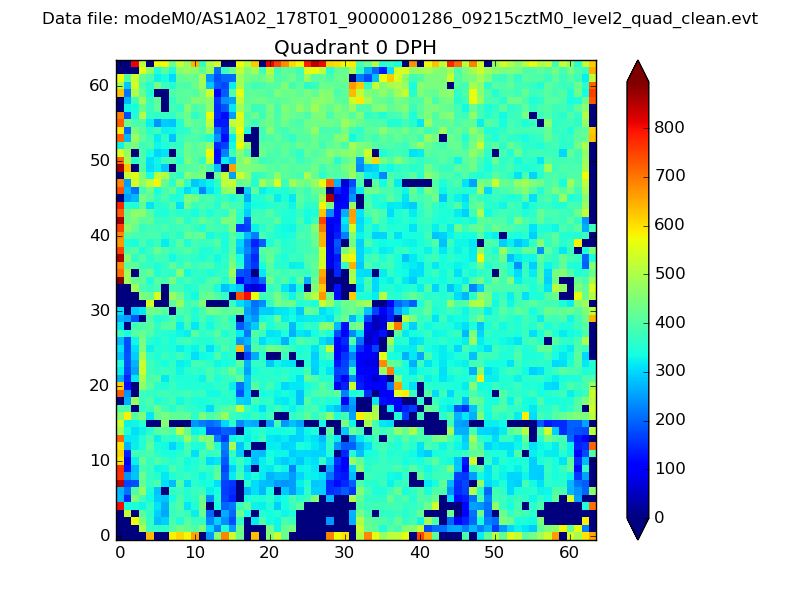 |
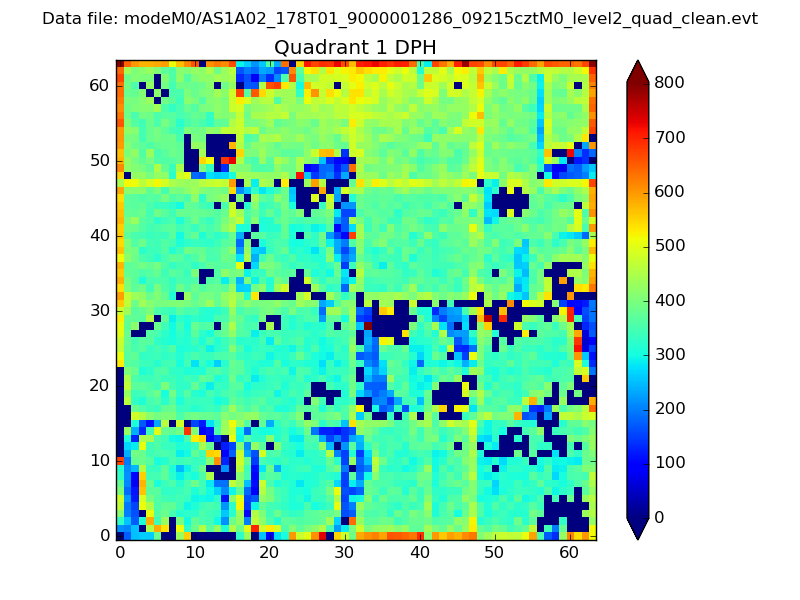 |
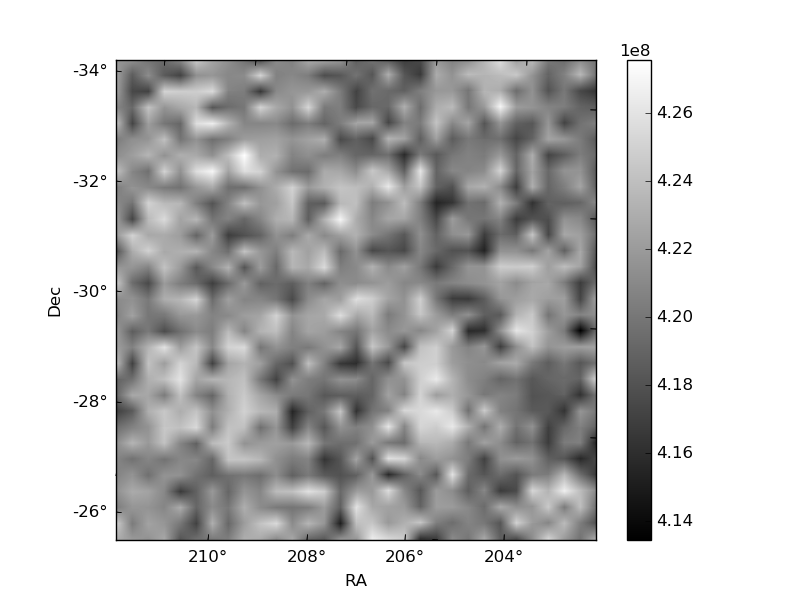
Quadrant B |
|---|---|---|---|
| Quadrant D | 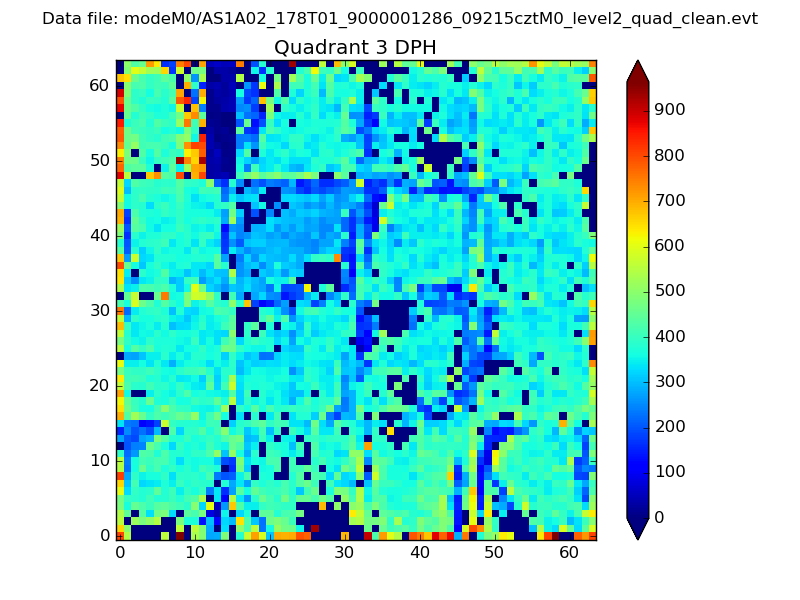 |
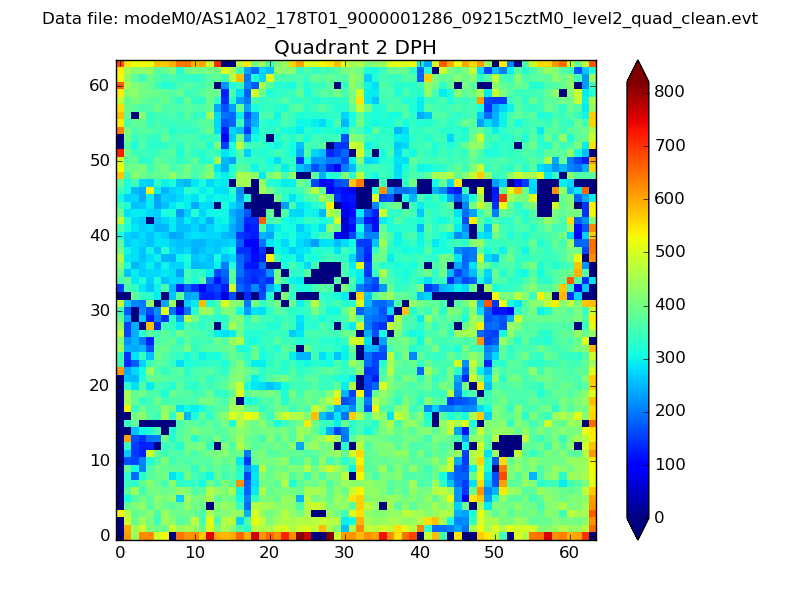 |
Quadrant C |
| Plot type | Count rate plots | Images |
|---|---|---|
| Comparison with Poisson distribution Blue bars denote a histogram of data divided into 1 sec bins. Red curve is a Poisson curve with rate = median count rate of data. |
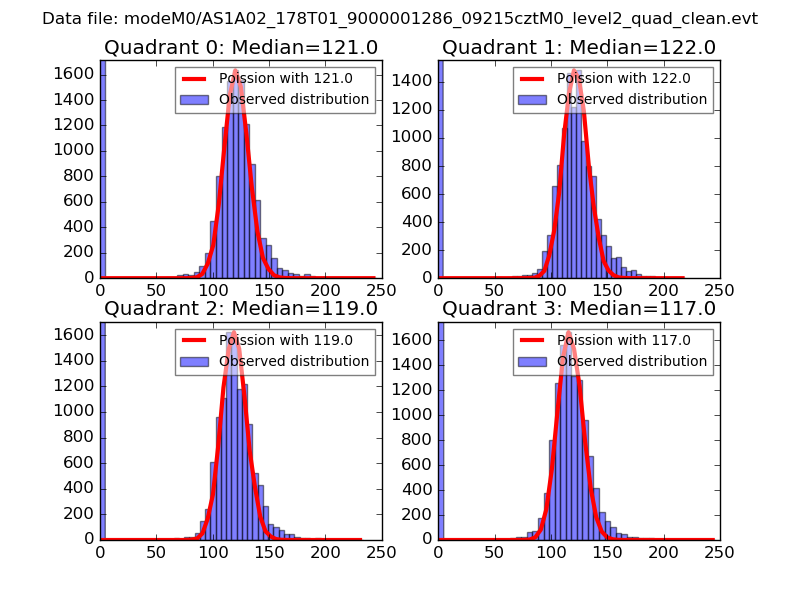 |
 |
| Quadrant-wise count rates Data is divided into 100 sec bins |
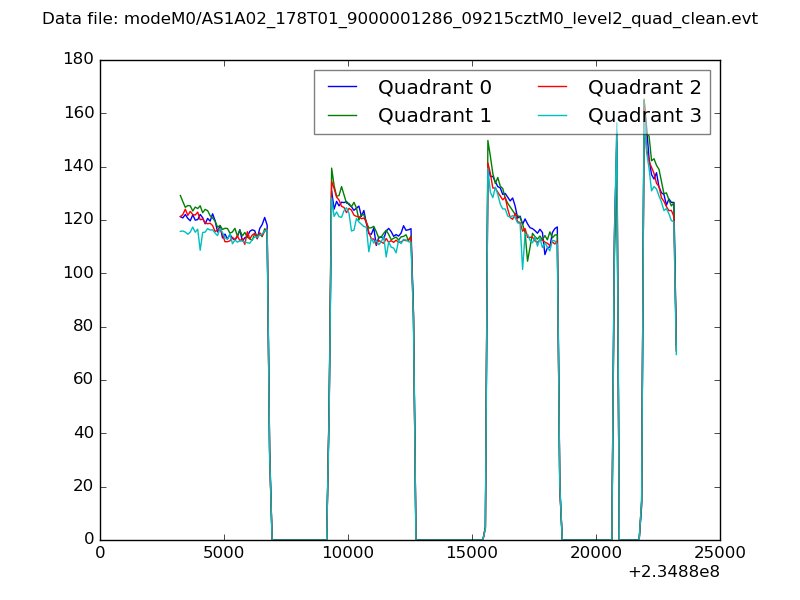 |
|
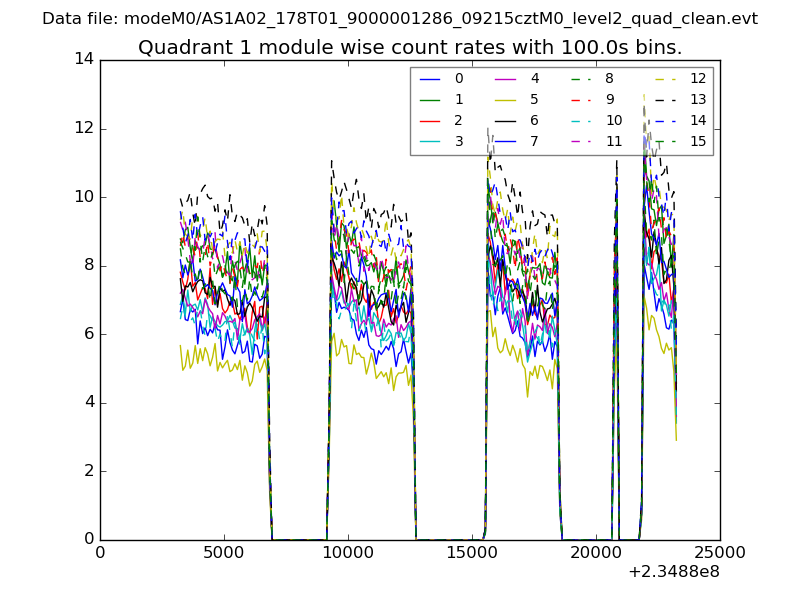
| Module-wise count rates for Quadrant A Data is divided into 100 sec bins |
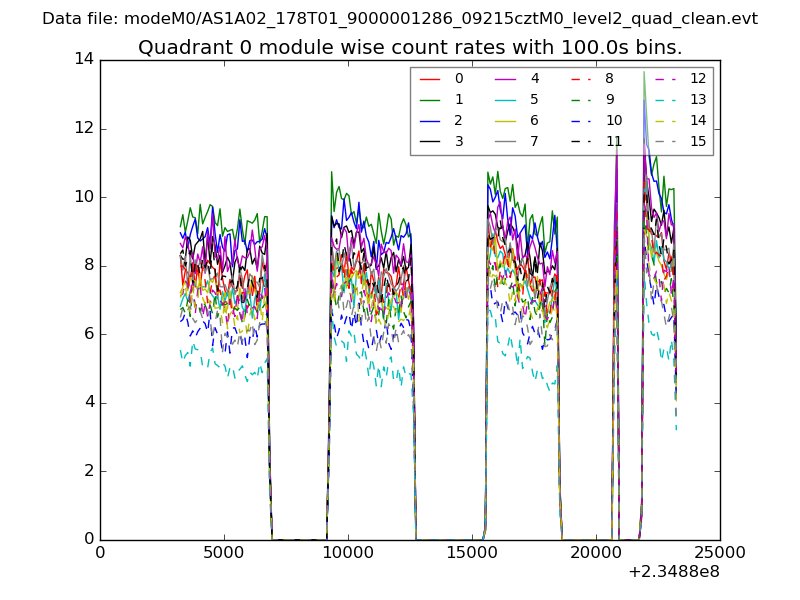 |
 |
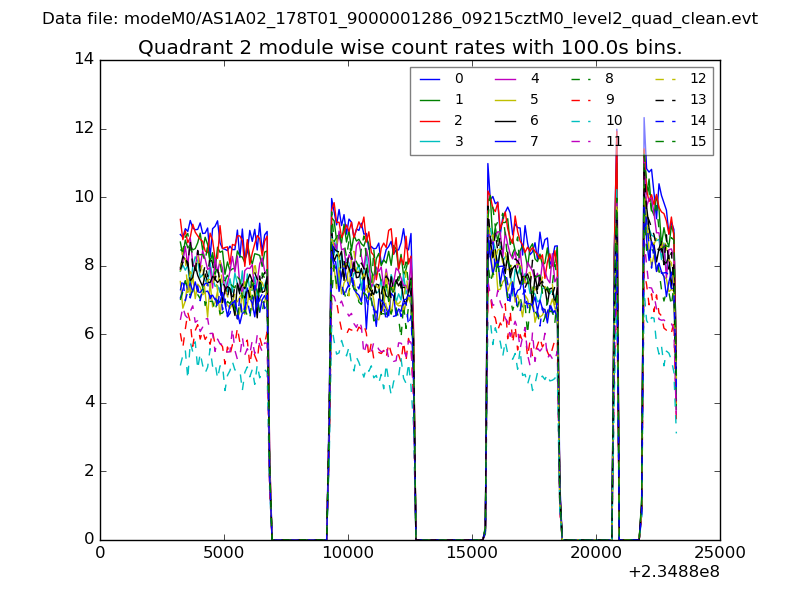
| Module-wise count rates for Quadrant B Data is divided into 100 sec bins |
 |
 |
| Module-wise count rates for Quadrant C Data is divided into 100 sec bins |
 |
 |
| Module-wise count rates for Quadrant D Data is divided into 100 sec bins |
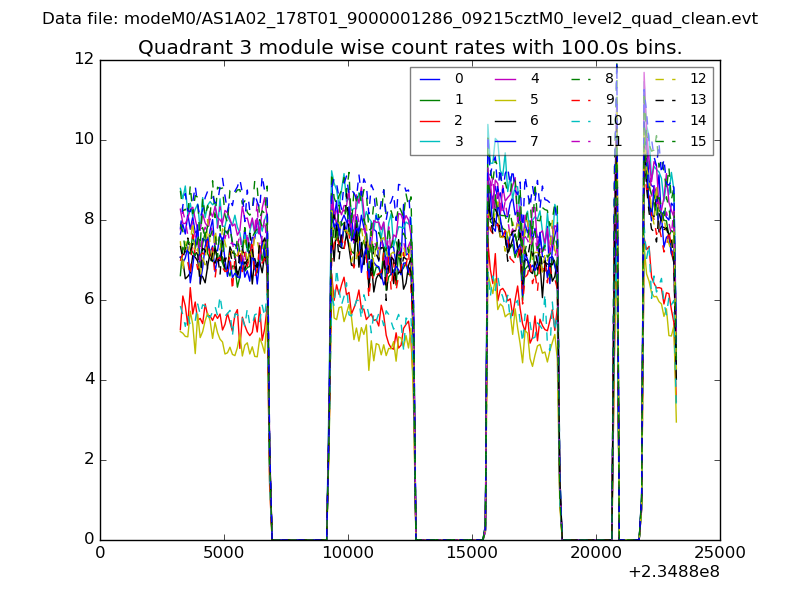 |
 |
| Parameter | Plot |
|---|---|
| CZT HV Monitor | 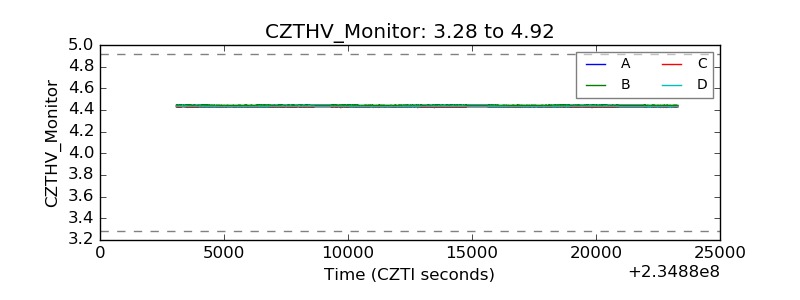 |
| D_VDD | 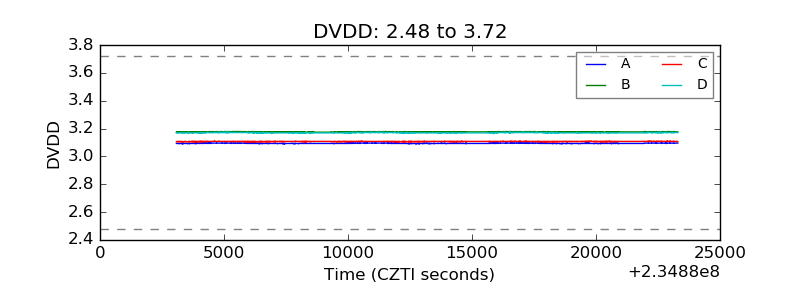 |
| Temperature 1 | 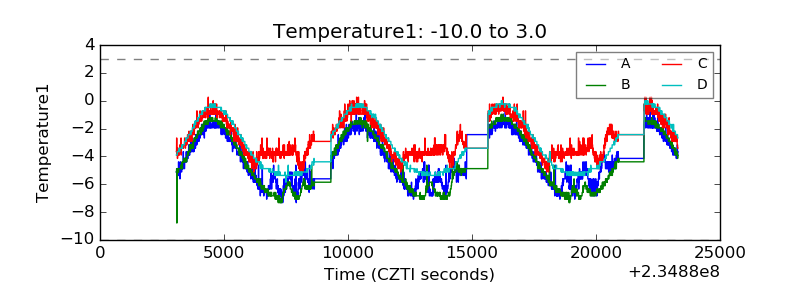 |
| Veto HV Monitor | 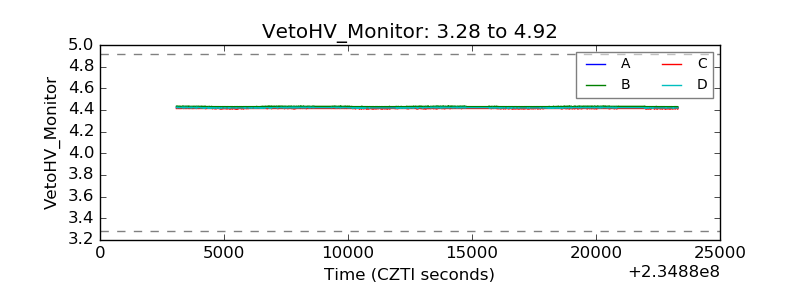 |
| Veto LLD | 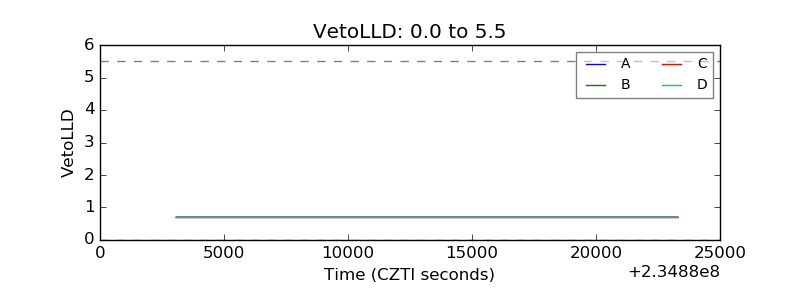 |
| Alpha Counter | 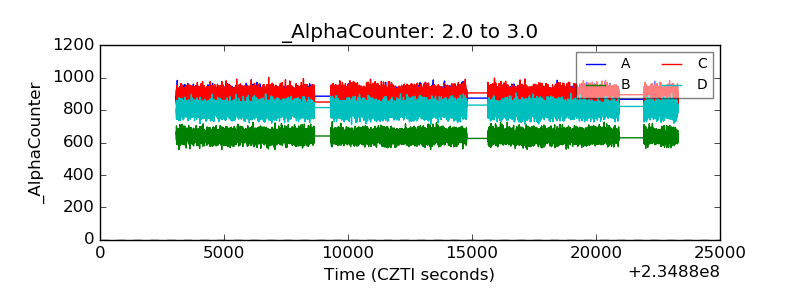 |
| _CPM_Rate | 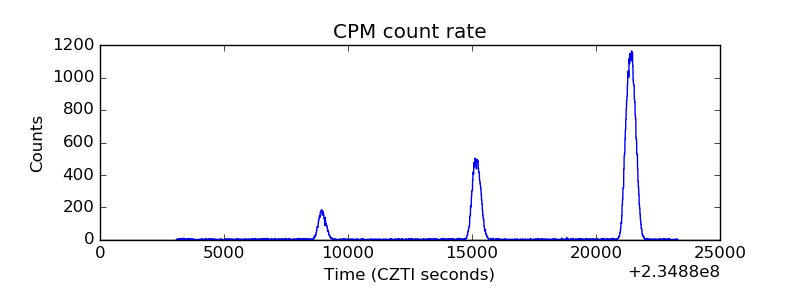 |
| CZT Counter | 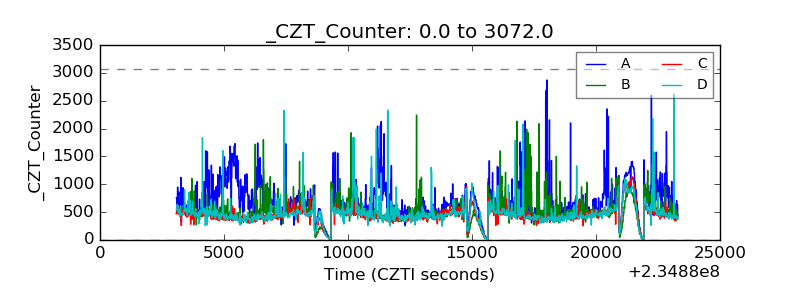 |
| +2.5 Volts monitor |  |
| +5 Volts monitor |  |
| _ROLL_ROT | 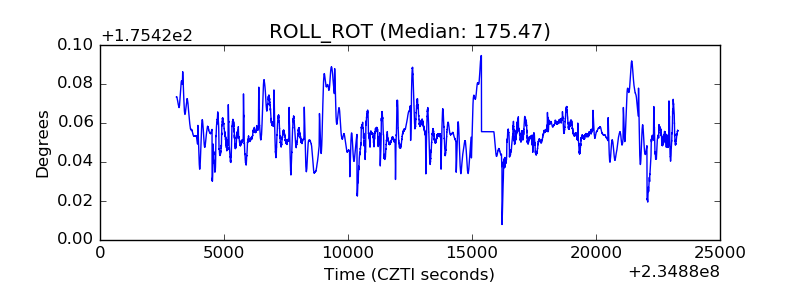 |
| _Roll_DEC | 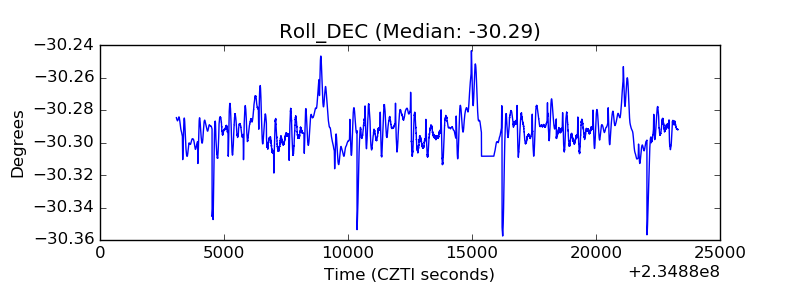 |
| _Roll_RA | 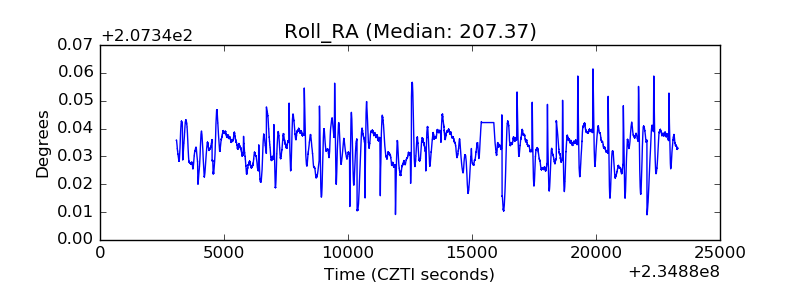 |
| Veto Counter | 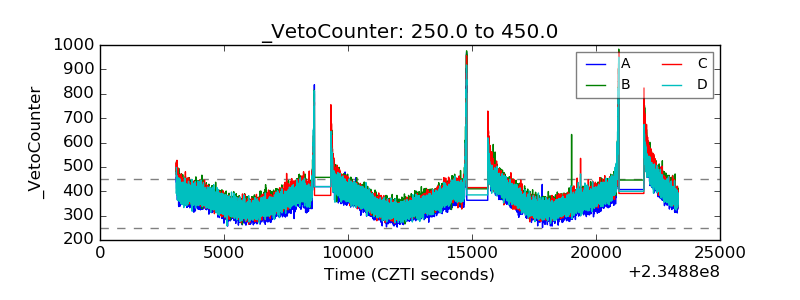 |