| Param | Original file | Final file |
|---|---|---|
| Filename | modeM0/AS1A02_178T01_9000001286_09217cztM0_level2.evt | modeM0/AS1A02_178T01_9000001286_09217cztM0_level2_quad_clean.evt |
| Size (bytes) | 498,386,880 | 86,048,640 |
| Size | 475.3 MB | 82.1 MB |
| Events in quadrant A | 4,555,945 | 552,217 |
| Events in quadrant B | 3,420,098 | 558,057 |
| Events in quadrant C | 2,877,836 | 540,898 |
| Events in quadrant D | 3,812,554 | 515,158 |
| Mode SS | |||
|---|---|---|---|
| Quadrant | BADHDUFLAG | Total packets | Discarded packets |
| A | 0 | 128 | 4 |
| B | 0 | 128 | 0 |
| C | 0 | 128 | 2 |
| D | 0 | 128 | 0 |
| Mode M9 | |||
|---|---|---|---|
| Quadrant | BADHDUFLAG | Total packets | Discarded packets |
| A | 0 | 18 | 0 |
| B | 0 | 18 | 0 |
| C | 0 | 18 | 0 |
| D | 0 | 19 | 0 |
| Mode M0 | |||
|---|---|---|---|
| Quadrant | BADHDUFLAG | Total packets | Discarded packets |
| A | 0 | 18066 | 160 |
| B | 0 | 14419 | 68 |
| C | 0 | 12969 | 77 |
| D | 0 | 15706 | 95 |
| Quadrant | Total seconds | Saturated seconds | Saturation percentage |
|---|---|---|---|
| A | 6287 | 171 | 2.719898% |
| B | 6310 | 62 | 0.982567% |
| C | 6301 | 17 | 0.269798% |
| D | 6302 | 308 | 4.887337% |
Noise dominated data is calculated using 1-second bins in cleaned event files. If a bin has >2000 counts, and if more than 50% of those come from <1% of pixels, then it is considered to be noise-dominated and hence unusable.
| Quadrant | # 1 sec bins | Bins with >0 counts | Bins with >2000 counts | High rate bins dominated by noise | Noise dominated (total time) | Noise dominated (detector-on time) | Marked lightcurve |
|---|---|---|---|---|---|---|---|
| A | 7492 | 6336 | 70 | 70 | 0.93% | 1.10% | 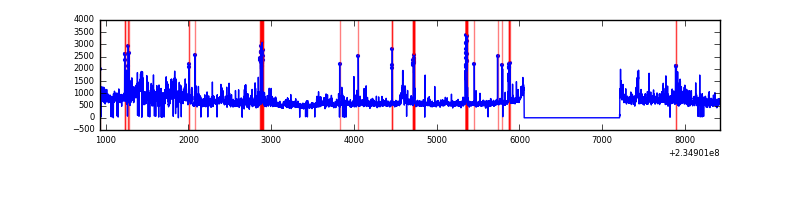 |
| B | 7492 | 6338 | 7 | 7 | 0.09% | 0.11% | 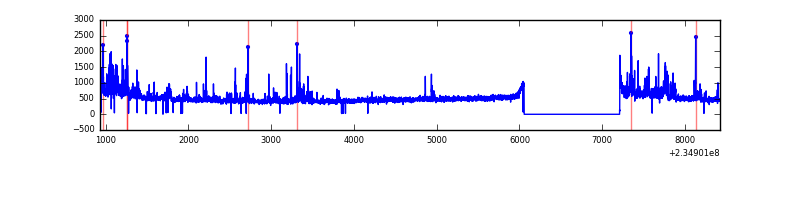 |
| C | 7492 | 6338 | 0 | 0 | 0.00% | 0.00% | 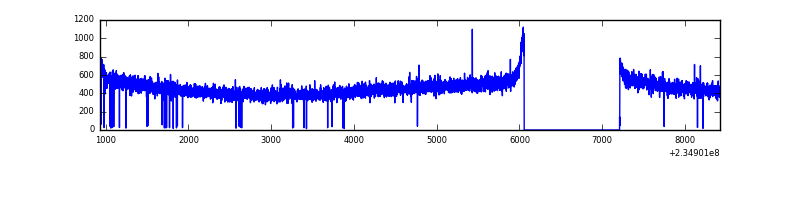 |
| D | 7492 | 6338 | 290 | 290 | 3.87% | 4.58% | 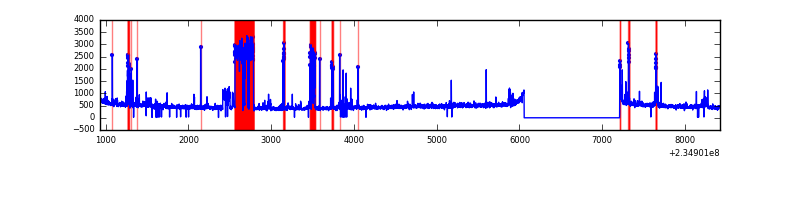 |
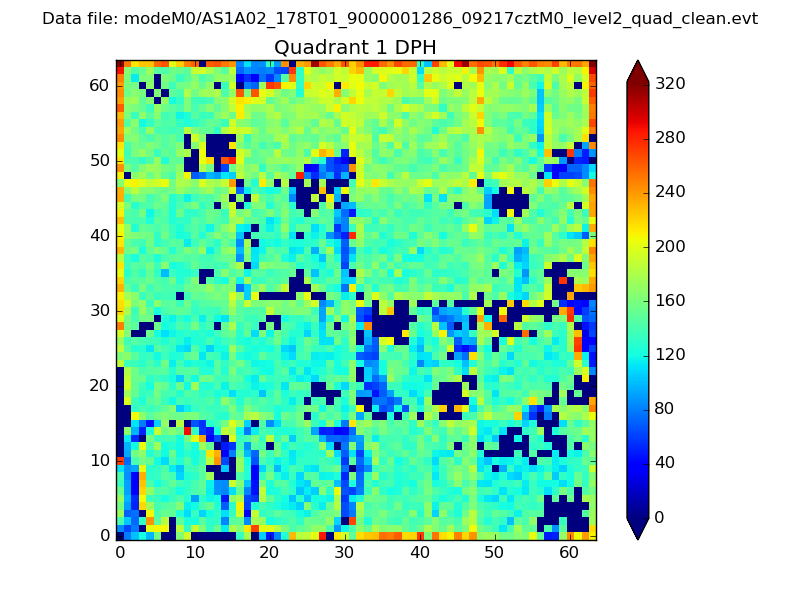
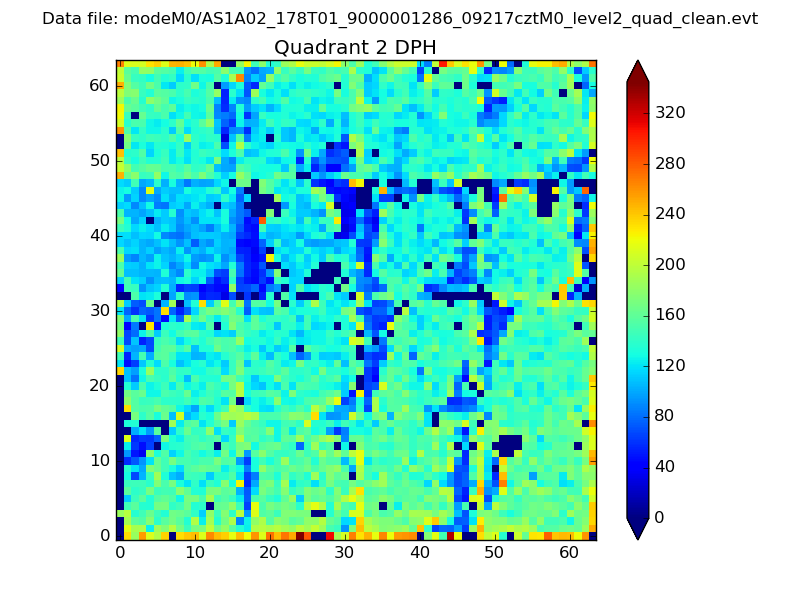
Top three noisy pixels from each quadrant. If the there are fewer than three noisy pixels in the level2.evt file, extra rows are filled as -1
| Pixel properties | Quadrant properties | ||||||
|---|---|---|---|---|---|---|---|
| Quadrant | DetID | PixID | Counts | Sigma | Mean | Median | Sigma |
| A | 8 | 5 | 1248974 | 7971.7 | 764 | 750 | 156.6 |
| A | 5 | 16 | 119710 | 759.73 | 764 | 750 | 156.6 |
| A | 15 | 174 | 88437 | 560.01 | 764 | 750 | 156.6 |
| B | 8 | 234 | 160352 | 1074.67 | 771 | 752 | 148.5 |
| B | 4 | 173 | 65802 | 438.01 | 771 | 752 | 148.5 |
| B | 0 | 214 | 54152 | 359.57 | 771 | 752 | 148.5 |
| C | 13 | 61 | 5597 | 28.45 | 735 | 737 | 170.8 |
| C | 14 | 67 | 4886 | 24.29 | 735 | 737 | 170.8 |
| C | 8 | 222 | 3715 | 17.43 | 735 | 737 | 170.8 |
| D | 1 | 52 | 719332 | 3715.76 | 717 | 700 | 193.4 |
| D | 7 | 71 | 136174 | 700.48 | 717 | 700 | 193.4 |
| D | 9 | 64 | 104152 | 534.91 | 717 | 700 | 193.4 |
Histogram calculated using DETX and DETY for each event in the final _common_clean file
| Quadrant A | 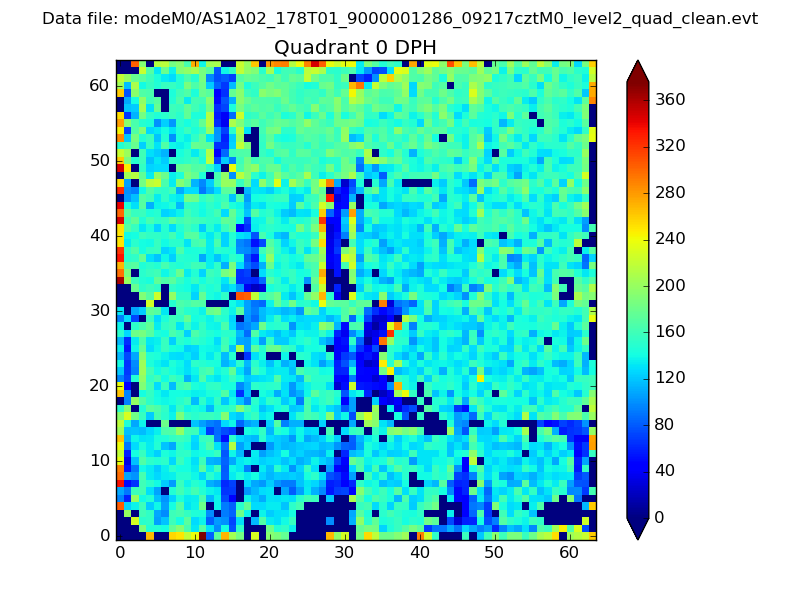 |
 |
Quadrant B |
|---|---|---|---|
| Quadrant D | 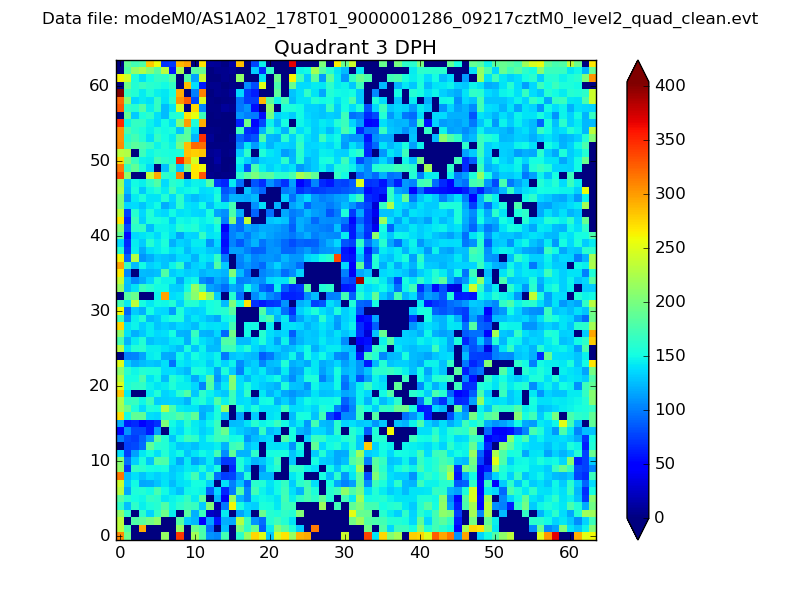 |
 |
Quadrant C |
| Plot type | Count rate plots | Images |
|---|---|---|
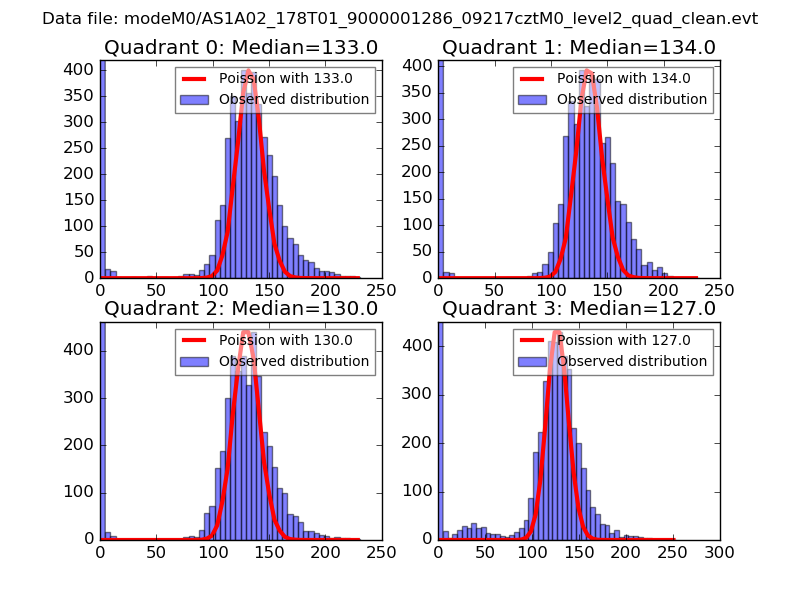
| Comparison with Poisson distribution Blue bars denote a histogram of data divided into 1 sec bins. Red curve is a Poisson curve with rate = median count rate of data. |
 |
 |
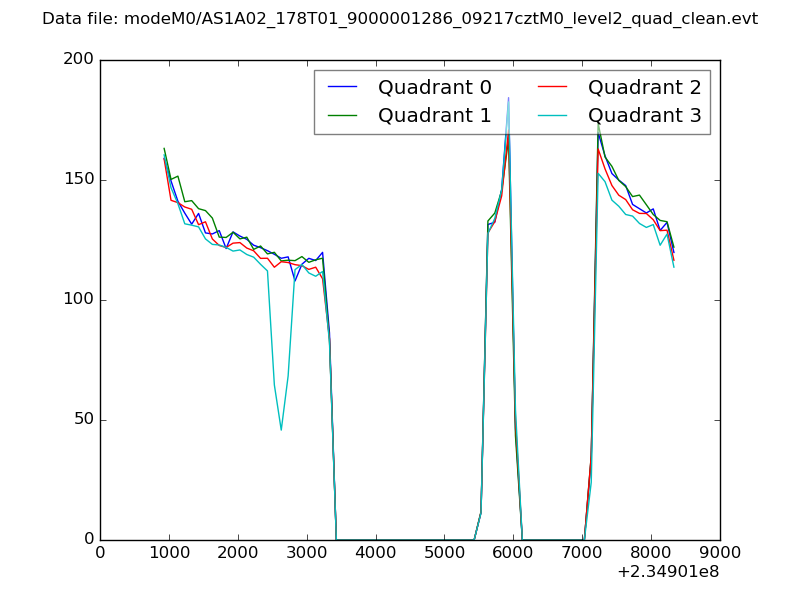
| Quadrant-wise count rates Data is divided into 100 sec bins |
 |
|
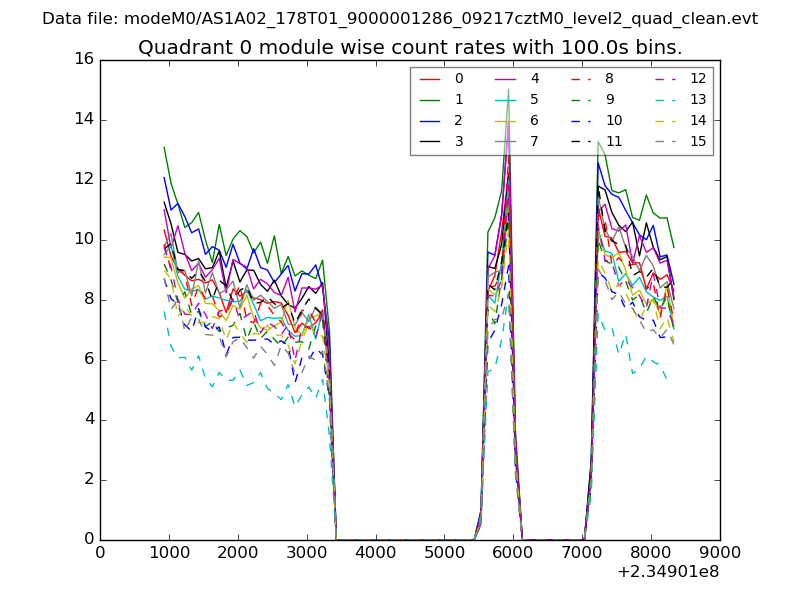
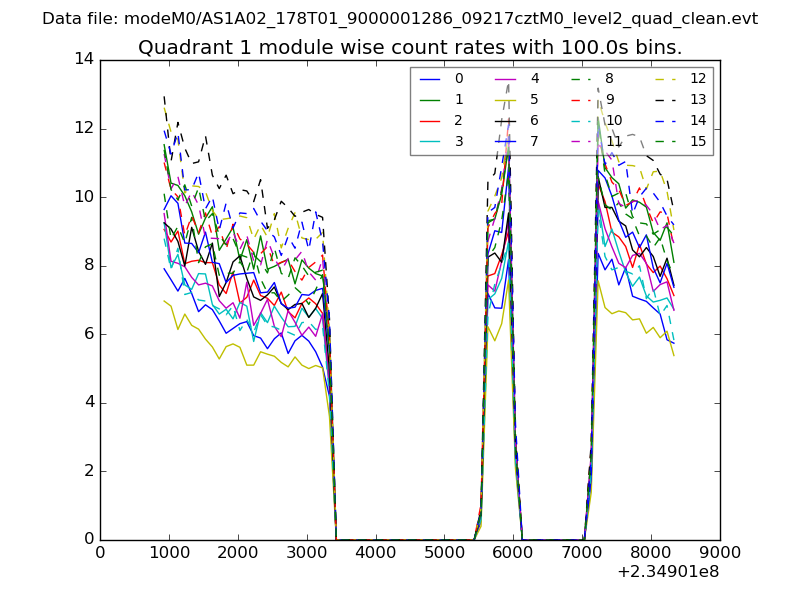
| Module-wise count rates for Quadrant A Data is divided into 100 sec bins |
 |
 |
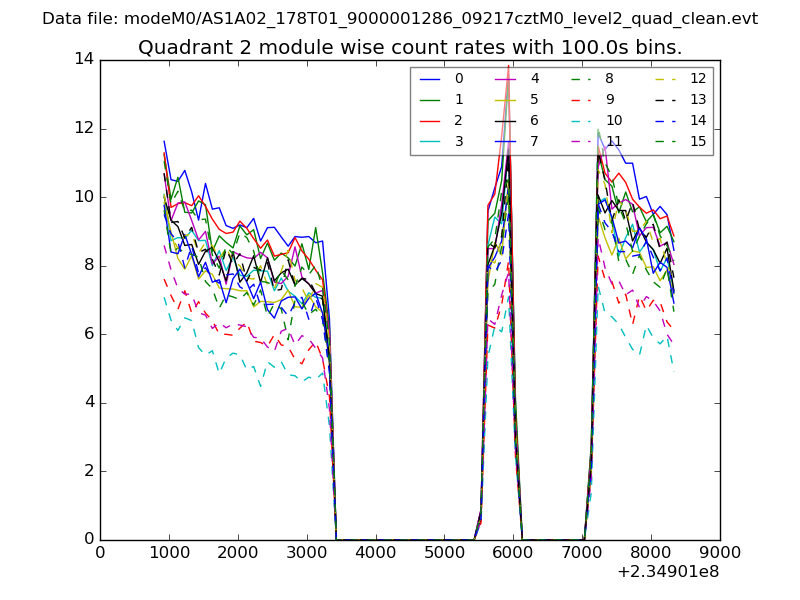
| Module-wise count rates for Quadrant B Data is divided into 100 sec bins |
 |
 |
| Module-wise count rates for Quadrant C Data is divided into 100 sec bins |
 |
 |
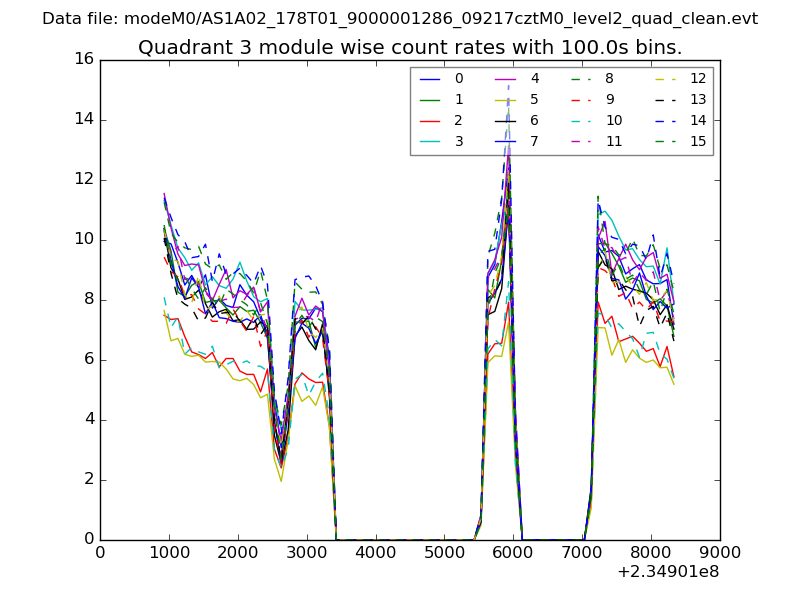
| Module-wise count rates for Quadrant D Data is divided into 100 sec bins |
 |
 |
| Parameter | Plot |
|---|---|
| CZT HV Monitor | 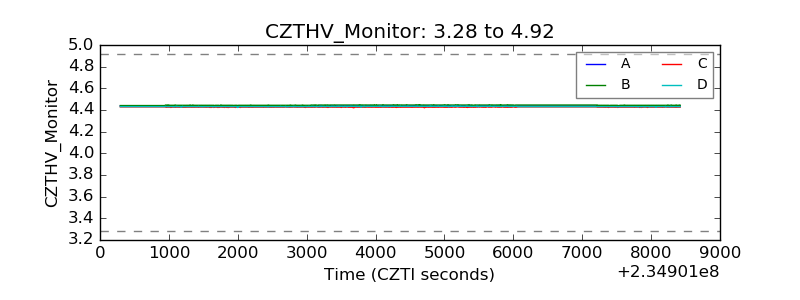 |
| D_VDD | 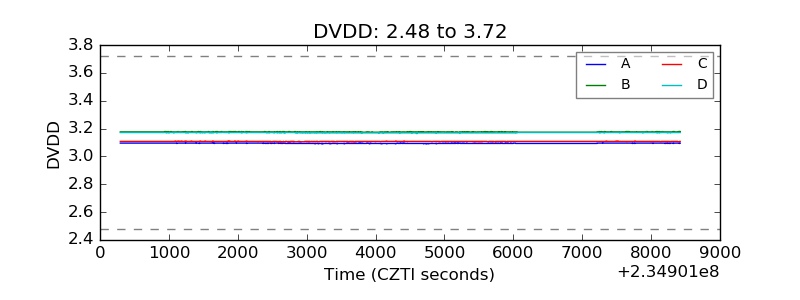 |
| Temperature 1 | 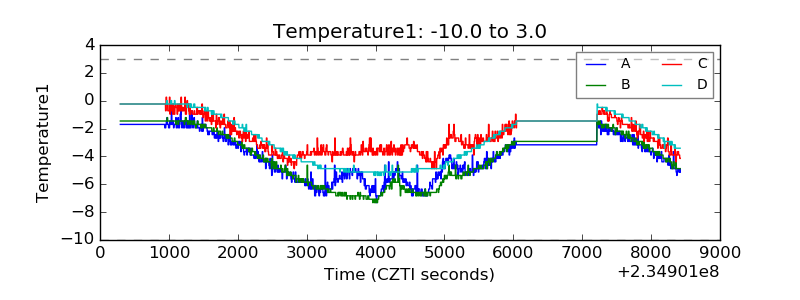 |
| Veto HV Monitor | 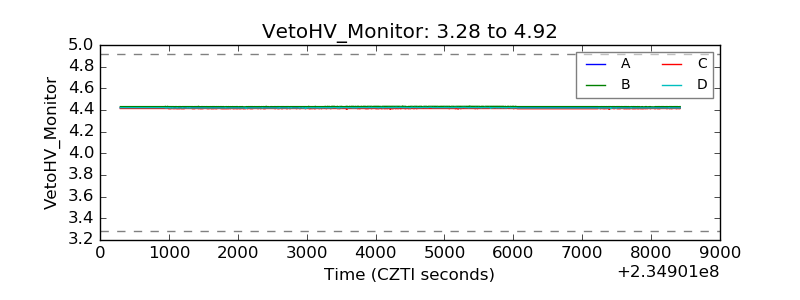 |
| Veto LLD | 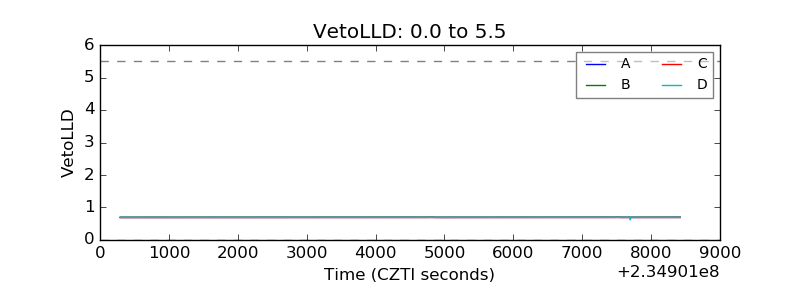 |
| Alpha Counter | 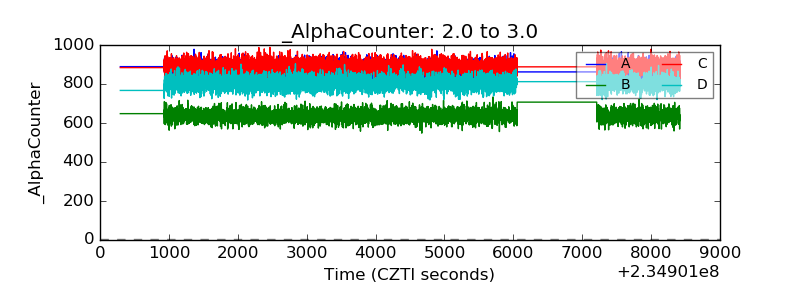 |
| _CPM_Rate | 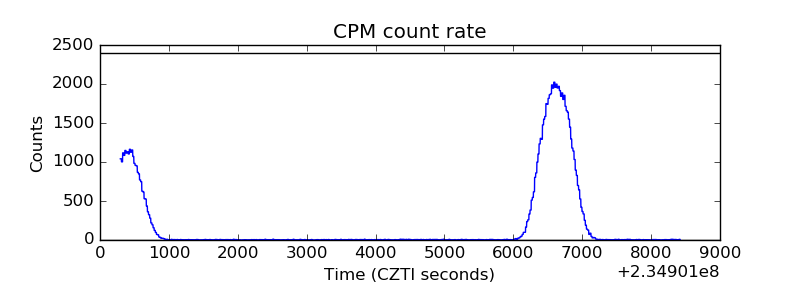 |
| CZT Counter | 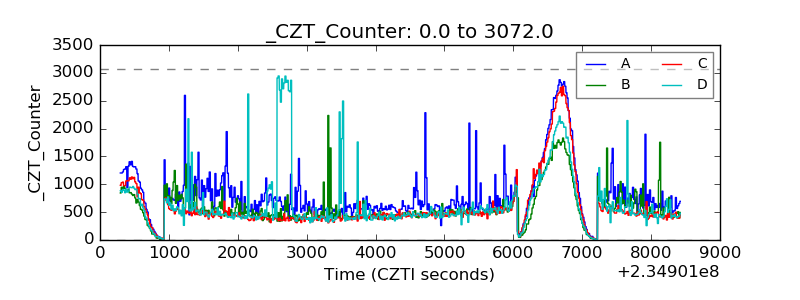 |
| +2.5 Volts monitor | 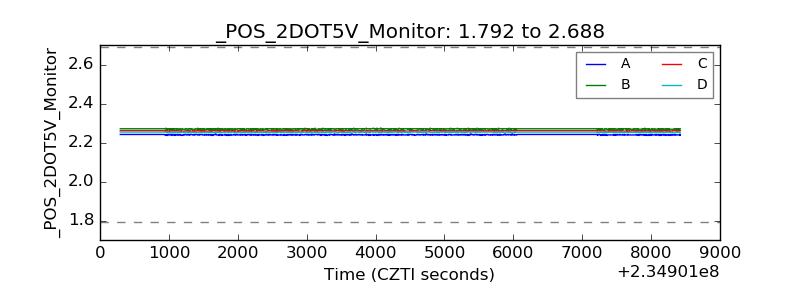 |
| +5 Volts monitor | 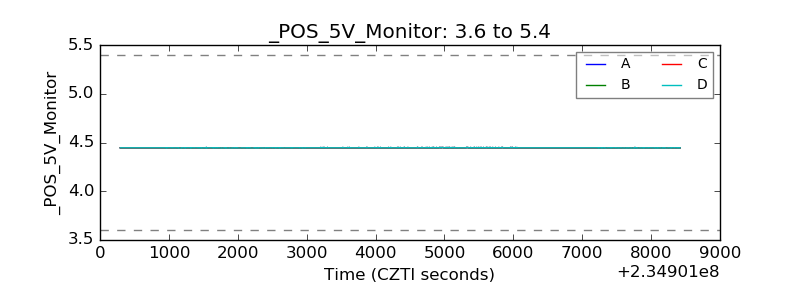 |
| _ROLL_ROT | 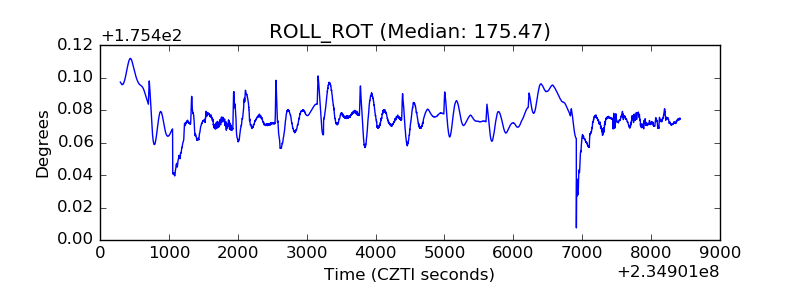 |
| _Roll_DEC | 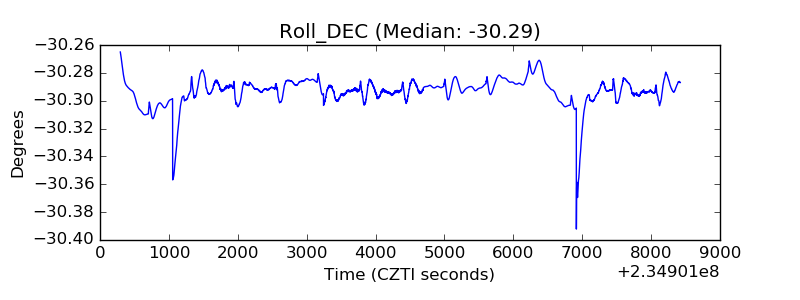 |
| _Roll_RA | 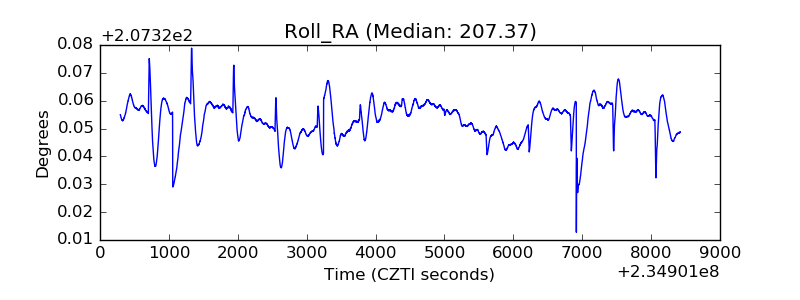 |
| Veto Counter | 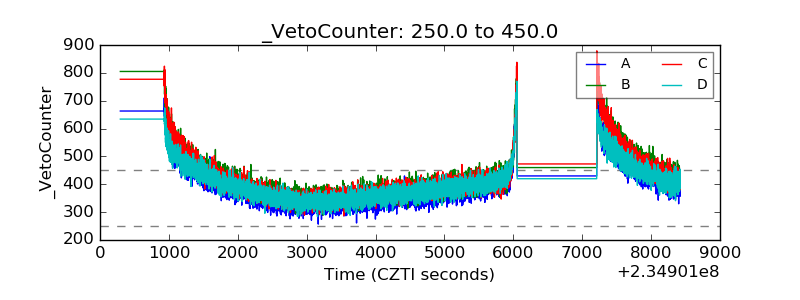 |