| Param | Original file | Final file |
|---|---|---|
| Filename | modeM0/AS1A02_178T01_9000001286_09218cztM0_level2.evt | modeM0/AS1A02_178T01_9000001286_09218cztM0_level2_quad_clean.evt |
| Size (bytes) | 480,792,960 | 86,304,960 |
| Size | 458.5 MB | 82.3 MB |
| Events in quadrant A | 4,599,627 | 547,901 |
| Events in quadrant B | 3,440,676 | 565,518 |
| Events in quadrant C | 2,860,609 | 547,808 |
| Events in quadrant D | 3,240,970 | 521,476 |
| Mode SS | |||
|---|---|---|---|
| Quadrant | BADHDUFLAG | Total packets | Discarded packets |
| A | 0 | 126 | 0 |
| B | 0 | 126 | 0 |
| C | 0 | 126 | 0 |
| D | 0 | 126 | 4 |
| Mode M9 | |||
|---|---|---|---|
| Quadrant | BADHDUFLAG | Total packets | Discarded packets |
| A | 0 | 18 | 0 |
| B | 0 | 18 | 0 |
| C | 0 | 18 | 0 |
| D | 0 | 19 | 0 |
| Mode M0 | |||
|---|---|---|---|
| Quadrant | BADHDUFLAG | Total packets | Discarded packets |
| A | 0 | 17958 | 115 |
| B | 0 | 14240 | 93 |
| C | 0 | 12692 | 73 |
| D | 0 | 13840 | 59 |
| Quadrant | Total seconds | Saturated seconds | Saturation percentage |
|---|---|---|---|
| A | 6173 | 257 | 4.163292% |
| B | 6168 | 74 | 1.199741% |
| C | 6172 | 15 | 0.243033% |
| D | 6181 | 98 | 1.585504% |
Noise dominated data is calculated using 1-second bins in cleaned event files. If a bin has >2000 counts, and if more than 50% of those come from <1% of pixels, then it is considered to be noise-dominated and hence unusable.
| Quadrant | # 1 sec bins | Bins with >0 counts | Bins with >2000 counts | High rate bins dominated by noise | Noise dominated (total time) | Noise dominated (detector-on time) | Marked lightcurve |
|---|---|---|---|---|---|---|---|
| A | 7462 | 6208 | 173 | 173 | 2.32% | 2.79% | 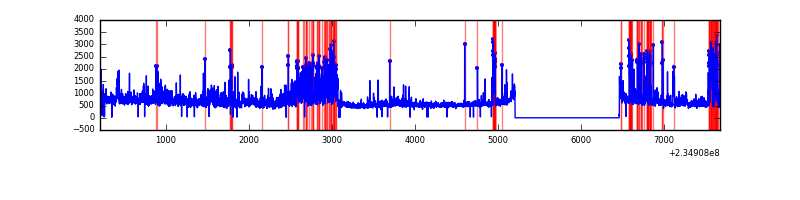 |
| B | 7462 | 6206 | 24 | 24 | 0.32% | 0.39% | 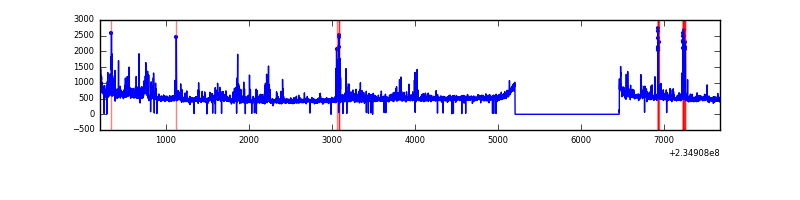 |
| C | 7462 | 6208 | 0 | 0 | 0.00% | 0.00% | 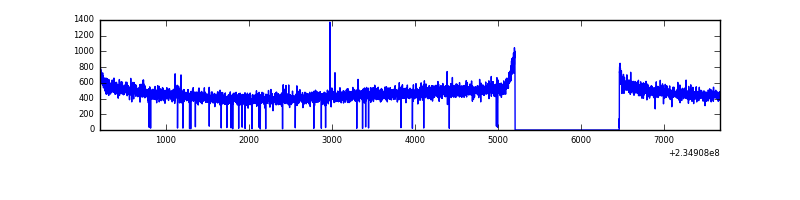 |
| D | 7462 | 6207 | 94 | 94 | 1.26% | 1.51% | 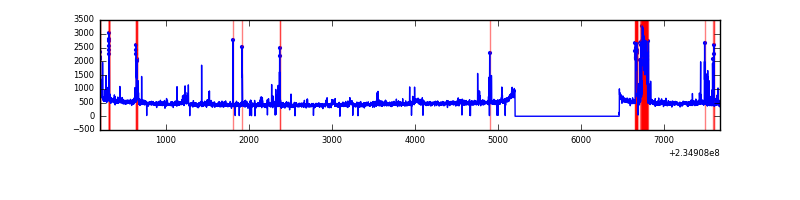 |
Top three noisy pixels from each quadrant. If the there are fewer than three noisy pixels in the level2.evt file, extra rows are filled as -1
| Pixel properties | Quadrant properties | ||||||
|---|---|---|---|---|---|---|---|
| Quadrant | DetID | PixID | Counts | Sigma | Mean | Median | Sigma |
| A | 8 | 5 | 1231691 | 8071.51 | 751 | 739 | 152.5 |
| A | 5 | 16 | 166588 | 1087.49 | 751 | 739 | 152.5 |
| A | 1 | 162 | 77611 | 504.06 | 751 | 739 | 152.5 |
| B | 8 | 234 | 193146 | 1307.77 | 768 | 752 | 147.1 |
| B | 0 | 245 | 50876 | 340.71 | 768 | 752 | 147.1 |
| B | 6 | 51 | 40115 | 267.56 | 768 | 752 | 147.1 |
| C | 13 | 61 | 5570 | 28.56 | 732 | 734 | 169.3 |
| C | 14 | 67 | 3294 | 15.12 | 732 | 734 | 169.3 |
| C | 3 | 233 | 2222 | 8.79 | 732 | 734 | 169.3 |
| D | 13 | 122 | 202212 | 1038.36 | 717 | 701 | 194.1 |
| D | 1 | 52 | 81891 | 418.36 | 717 | 701 | 194.1 |
| D | 9 | 64 | 69112 | 352.51 | 717 | 701 | 194.1 |
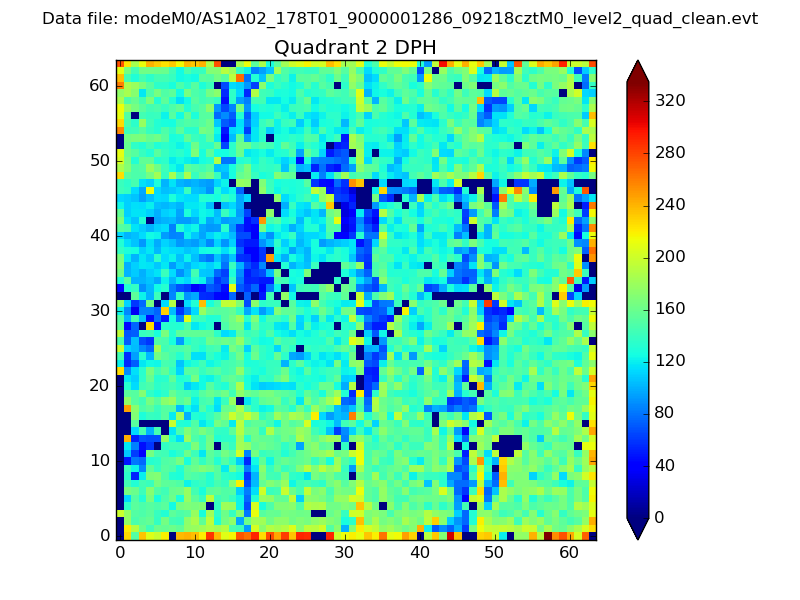
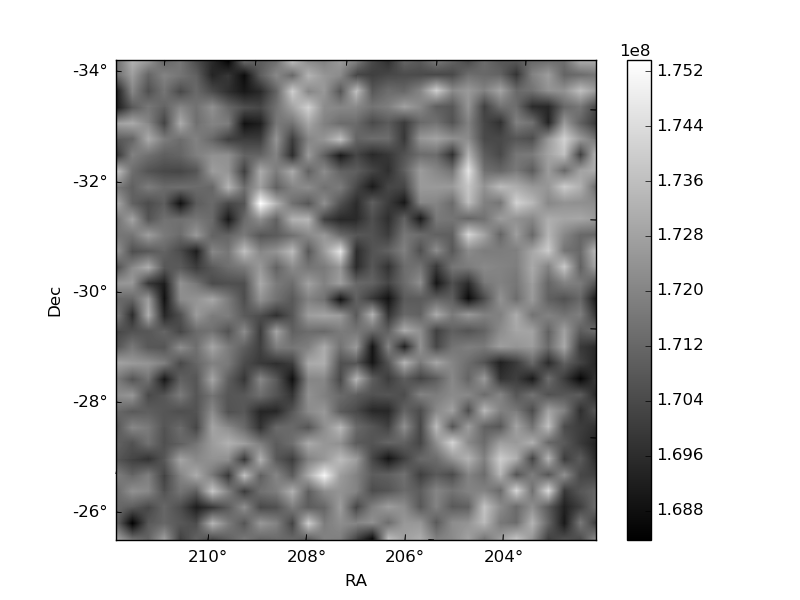
Histogram calculated using DETX and DETY for each event in the final _common_clean file
| Quadrant A | 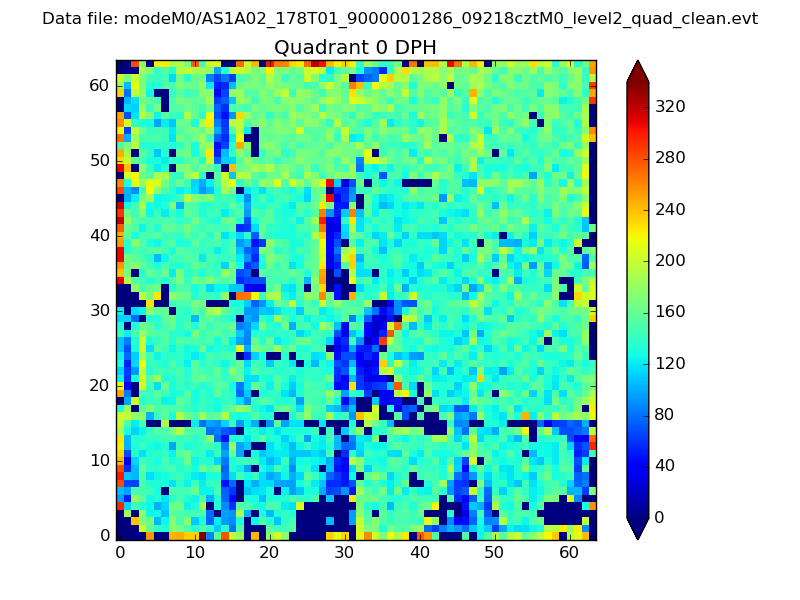 |
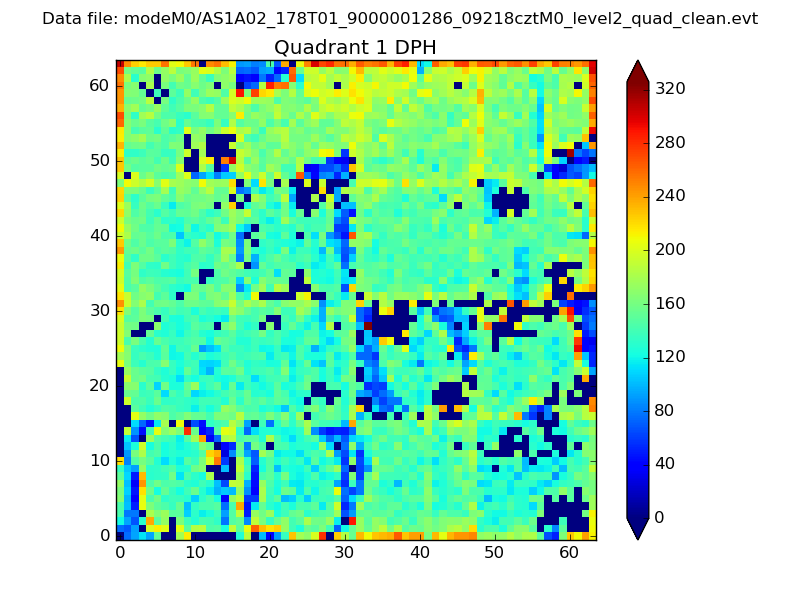 |
Quadrant B |
|---|---|---|---|
| Quadrant D | 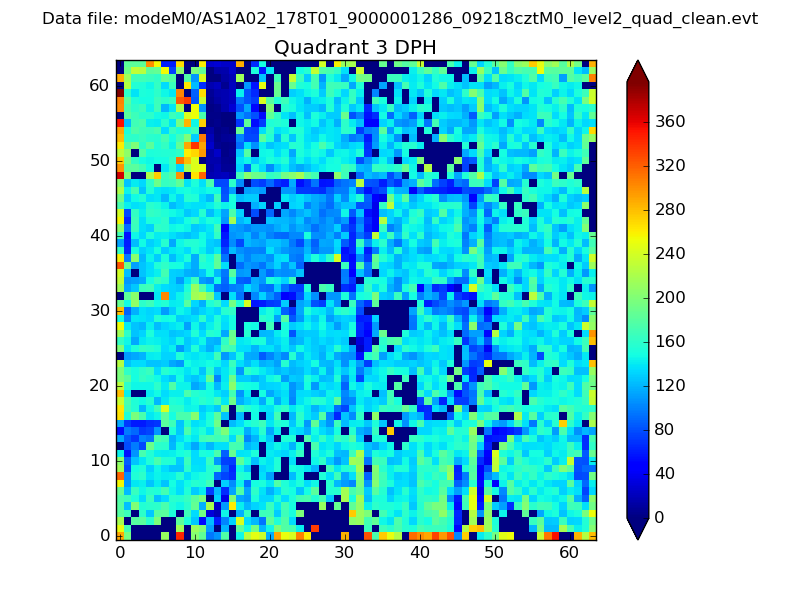 |
 |
Quadrant C |
| Plot type | Count rate plots | Images |
|---|---|---|
| Comparison with Poisson distribution Blue bars denote a histogram of data divided into 1 sec bins. Red curve is a Poisson curve with rate = median count rate of data. |
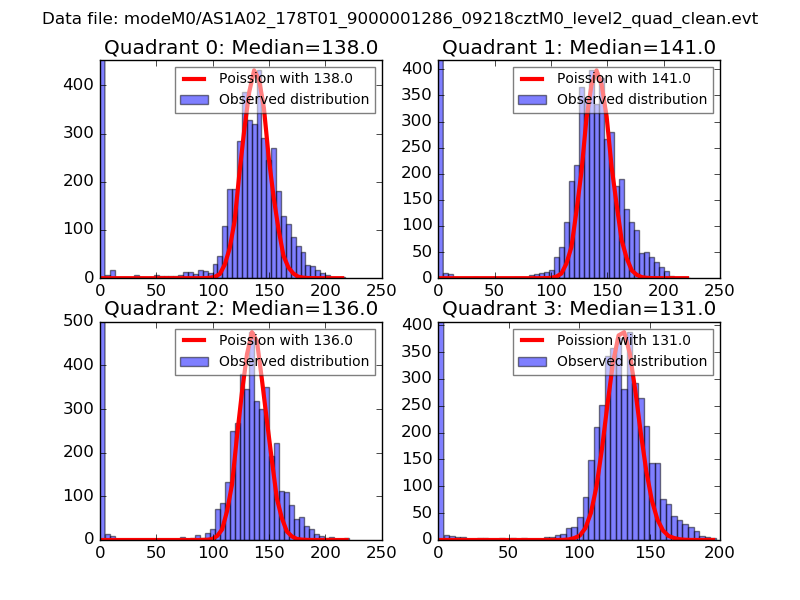 |
 |
| Quadrant-wise count rates Data is divided into 100 sec bins |
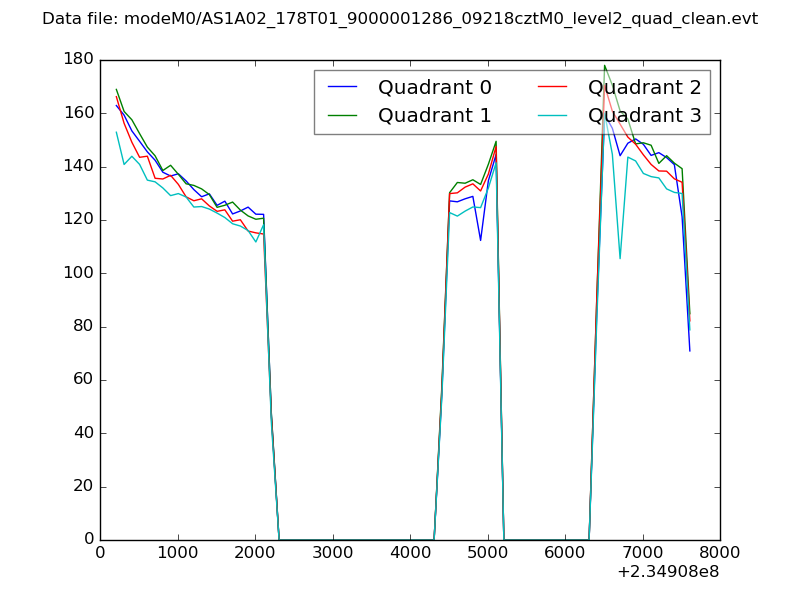 |
|
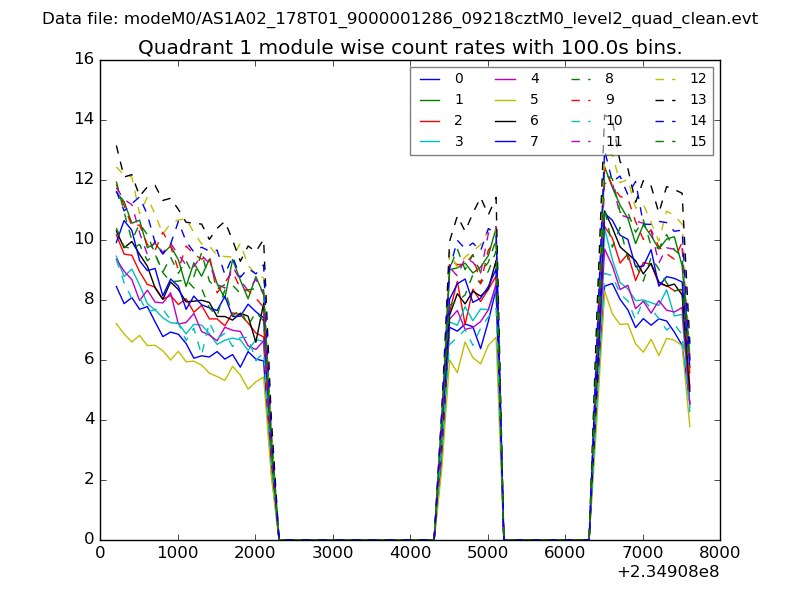
| Module-wise count rates for Quadrant A Data is divided into 100 sec bins |
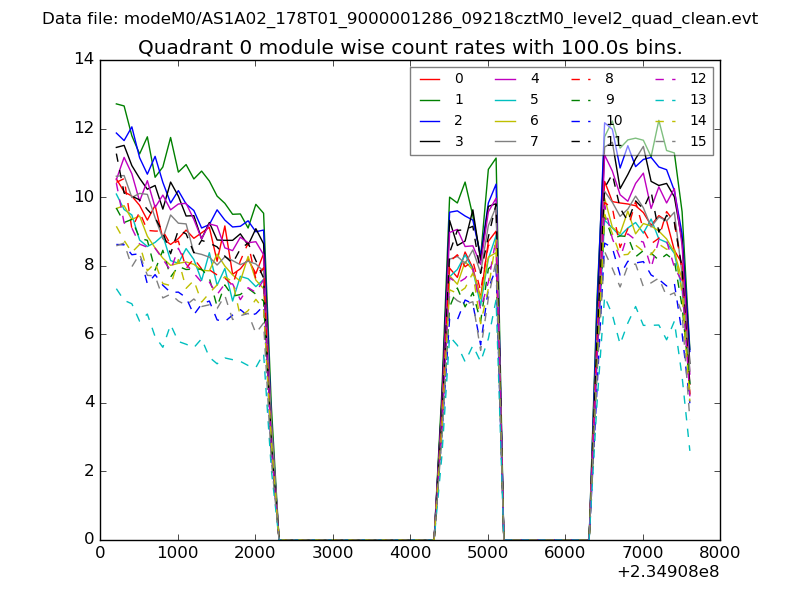 |
 |
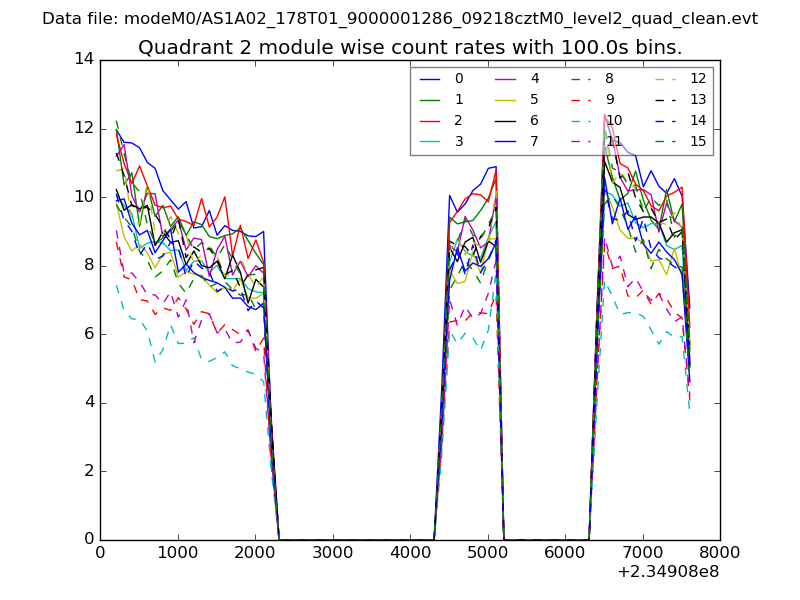
| Module-wise count rates for Quadrant B Data is divided into 100 sec bins |
 |
 |
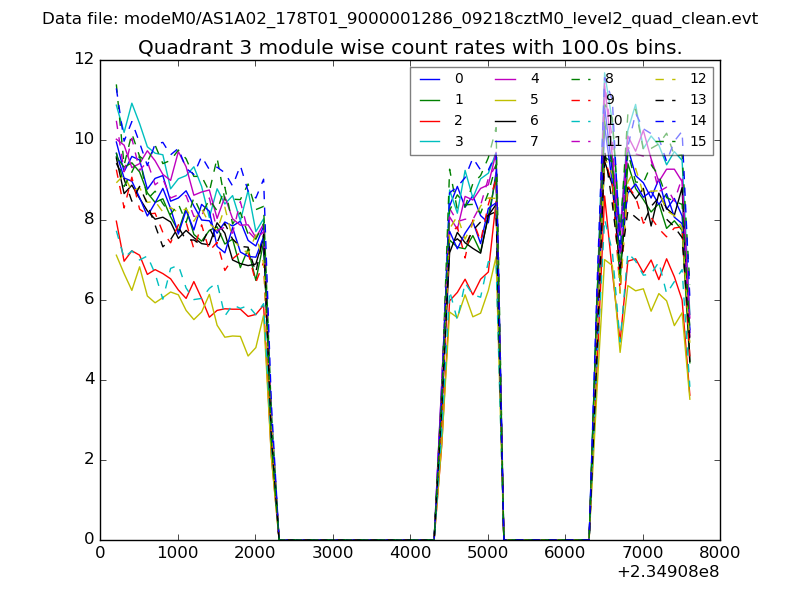
| Module-wise count rates for Quadrant C Data is divided into 100 sec bins |
 |
 |
| Module-wise count rates for Quadrant D Data is divided into 100 sec bins |
 |
 |
| Parameter | Plot |
|---|---|
| CZT HV Monitor | 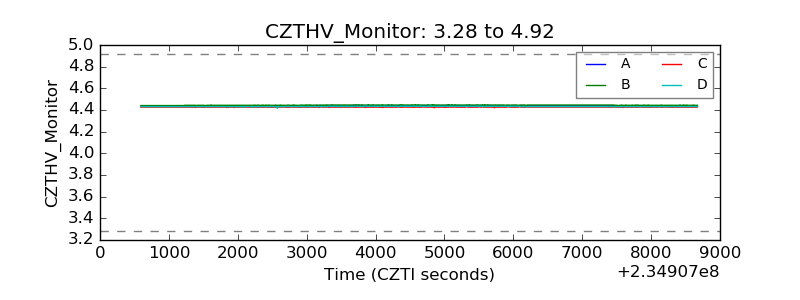 |
| D_VDD |  |
| Temperature 1 | 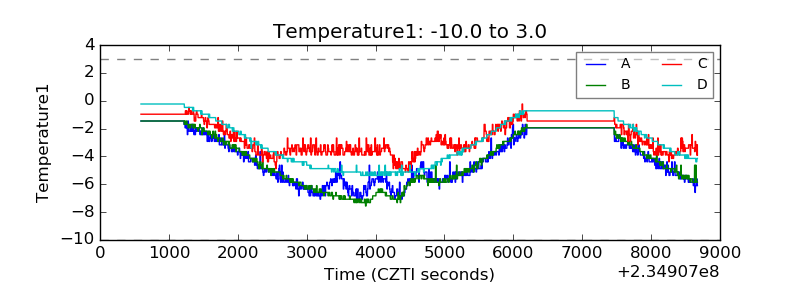 |
| Veto HV Monitor | 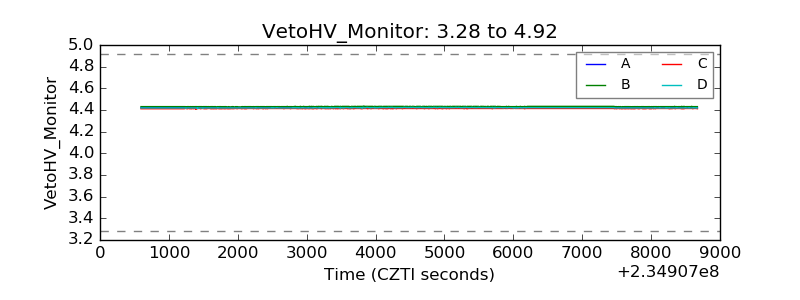 |
| Veto LLD | 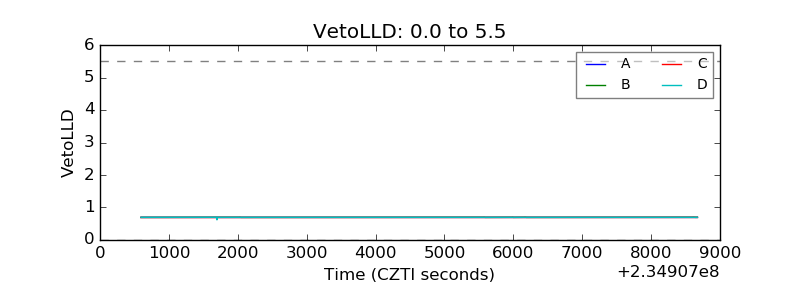 |
| Alpha Counter | 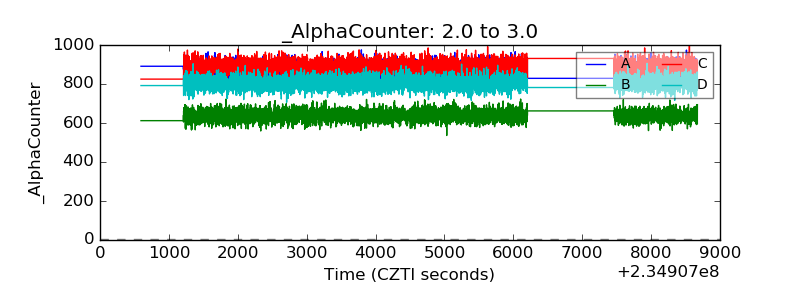 |
| _CPM_Rate | 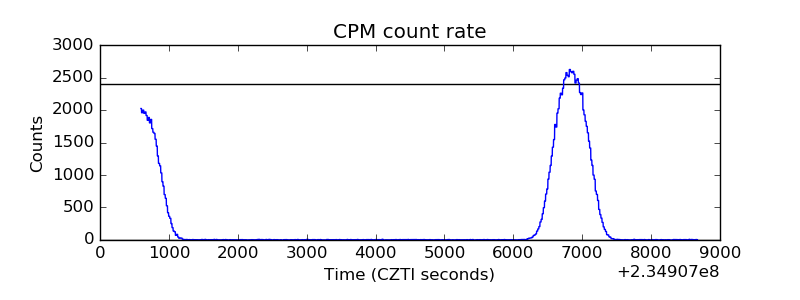 |
| CZT Counter | 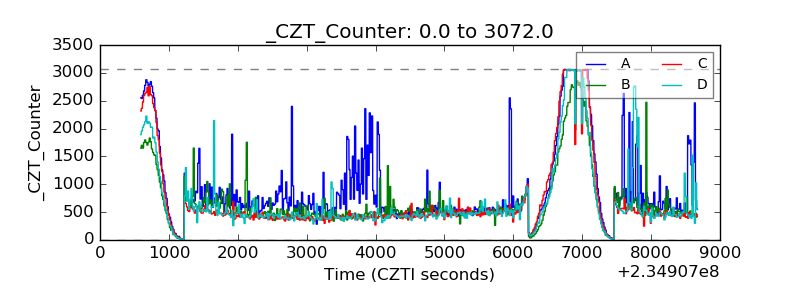 |
| +2.5 Volts monitor |  |
| +5 Volts monitor |  |
| _ROLL_ROT | 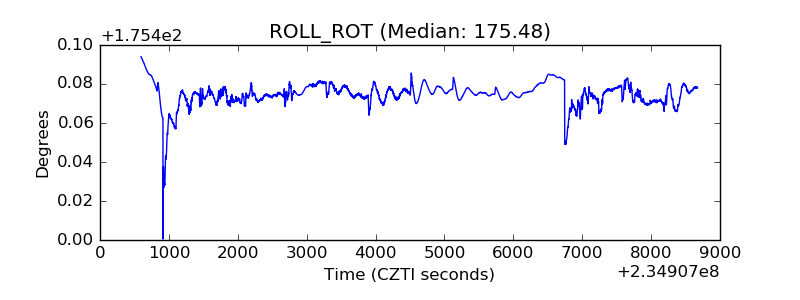 |
| _Roll_DEC | 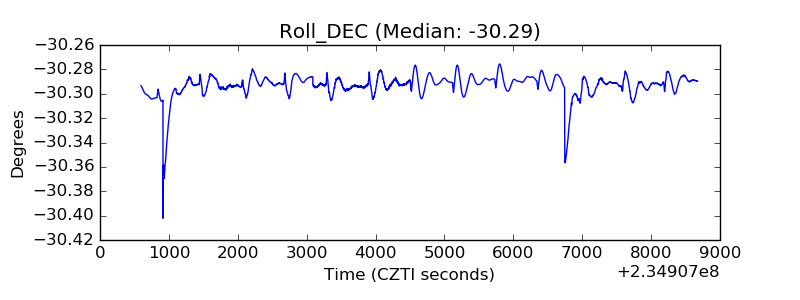 |
| _Roll_RA |  |
| Veto Counter | 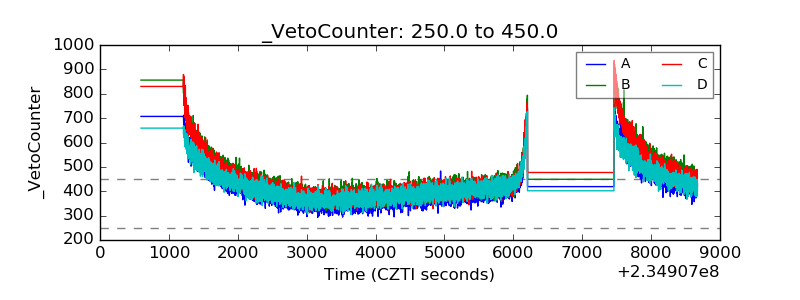 |