| Param | Original file | Final file |
|---|---|---|
| Filename | modeM0/AS1A02_178T01_9000001286_09222cztM0_level2.evt | modeM0/AS1A02_178T01_9000001286_09222cztM0_level2_quad_clean.evt |
| Size (bytes) | 466,908,480 | 65,148,480 |
| Size | 445.3 MB | 62.1 MB |
| Events in quadrant A | 4,277,422 | 376,130 |
| Events in quadrant B | 3,258,337 | 386,014 |
| Events in quadrant C | 3,074,239 | 376,313 |
| Events in quadrant D | 3,076,076 | 367,872 |
| Mode SS | |||
|---|---|---|---|
| Quadrant | BADHDUFLAG | Total packets | Discarded packets |
| A | 0 | 136 | 0 |
| B | 0 | 136 | 0 |
| C | 0 | 136 | 0 |
| D | 0 | 136 | 0 |
| Mode M9 | |||
|---|---|---|---|
| Quadrant | BADHDUFLAG | Total packets | Discarded packets |
| A | 0 | 10 | 0 |
| B | 0 | 10 | 0 |
| C | 0 | 10 | 0 |
| D | 0 | 10 | 0 |
| Mode M0 | |||
|---|---|---|---|
| Quadrant | BADHDUFLAG | Total packets | Discarded packets |
| A | 0 | 16984 | 2 |
| B | 0 | 13929 | 1 |
| C | 0 | 13633 | 1 |
| D | 0 | 13817 | 1 |
| Quadrant | Total seconds | Saturated seconds | Saturation percentage |
|---|---|---|---|
| A | 6685 | 141 | 2.109200% |
| B | 6685 | 55 | 0.822737% |
| C | 6685 | 26 | 0.388930% |
| D | 6685 | 34 | 0.508601% |
Noise dominated data is calculated using 1-second bins in cleaned event files. If a bin has >2000 counts, and if more than 50% of those come from <1% of pixels, then it is considered to be noise-dominated and hence unusable.
| Quadrant | # 1 sec bins | Bins with >0 counts | Bins with >2000 counts | High rate bins dominated by noise | Noise dominated (total time) | Noise dominated (detector-on time) | Marked lightcurve |
|---|---|---|---|---|---|---|---|
| A | 7685 | 6687 | 83 | 83 | 1.08% | 1.24% | 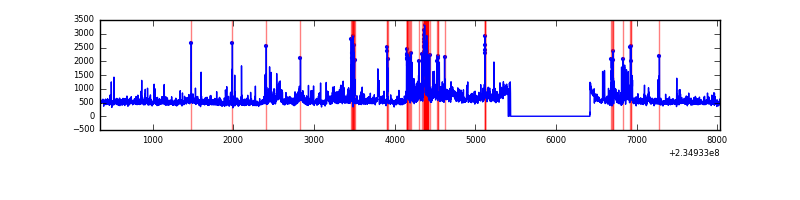 |
| B | 7685 | 6687 | 0 | 0 | 0.00% | 0.00% | 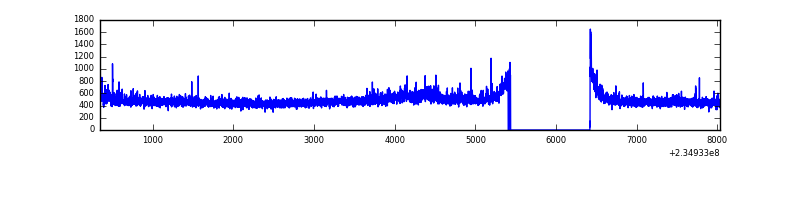 |
| C | 7685 | 6687 | 0 | 0 | 0.00% | 0.00% | 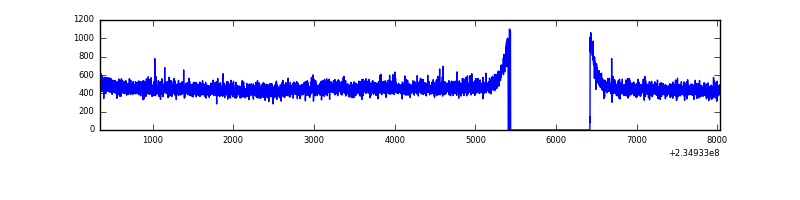 |
| D | 7685 | 6687 | 8 | 8 | 0.10% | 0.12% | 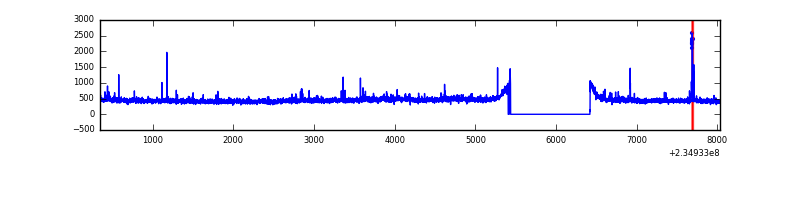 |
Top three noisy pixels from each quadrant. If the there are fewer than three noisy pixels in the level2.evt file, extra rows are filled as -1
| Pixel properties | Quadrant properties | ||||||
|---|---|---|---|---|---|---|---|
| Quadrant | DetID | PixID | Counts | Sigma | Mean | Median | Sigma |
| A | 8 | 5 | 763624 | 4705.05 | 799 | 783 | 162.1 |
| A | 5 | 16 | 121071 | 741.91 | 799 | 783 | 162.1 |
| A | 15 | 223 | 102826 | 629.38 | 799 | 783 | 162.1 |
| B | 0 | 214 | 35262 | 221.38 | 812 | 792 | 155.7 |
| B | 0 | 219 | 24630 | 153.1 | 812 | 792 | 155.7 |
| B | 4 | 48 | 19571 | 120.61 | 812 | 792 | 155.7 |
| C | 8 | 128 | 12321 | 63.05 | 781 | 784 | 183.0 |
| C | 8 | 112 | 6181 | 29.49 | 781 | 784 | 183.0 |
| C | 13 | 61 | 5985 | 28.42 | 781 | 784 | 183.0 |
| D | 1 | 52 | 57335 | 267.99 | 772 | 755 | 211.1 |
| D | 2 | 152 | 24421 | 112.09 | 772 | 755 | 211.1 |
| D | 2 | 234 | 24211 | 111.1 | 772 | 755 | 211.1 |
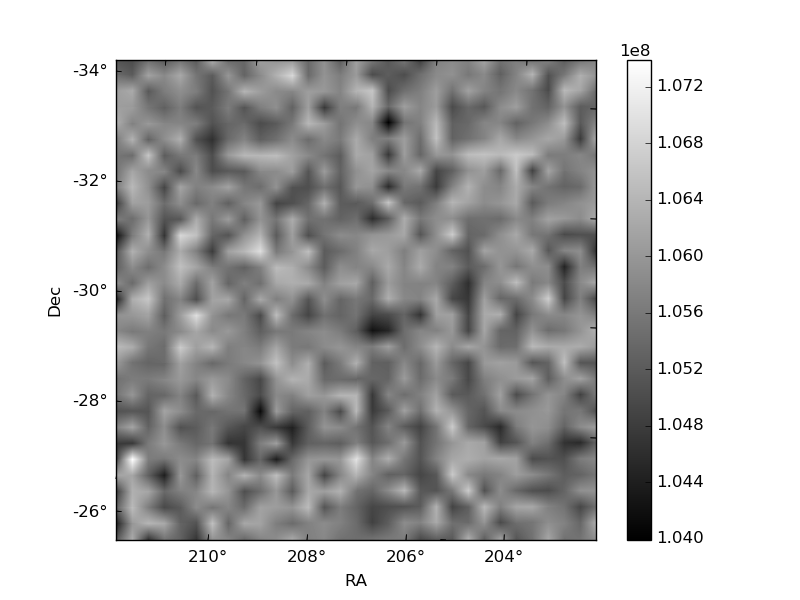
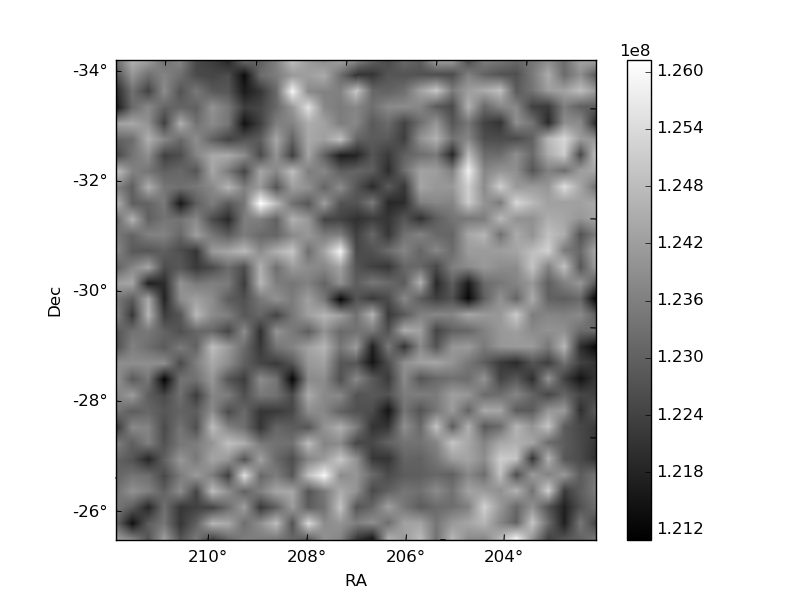
Histogram calculated using DETX and DETY for each event in the final _common_clean file
| Quadrant A | 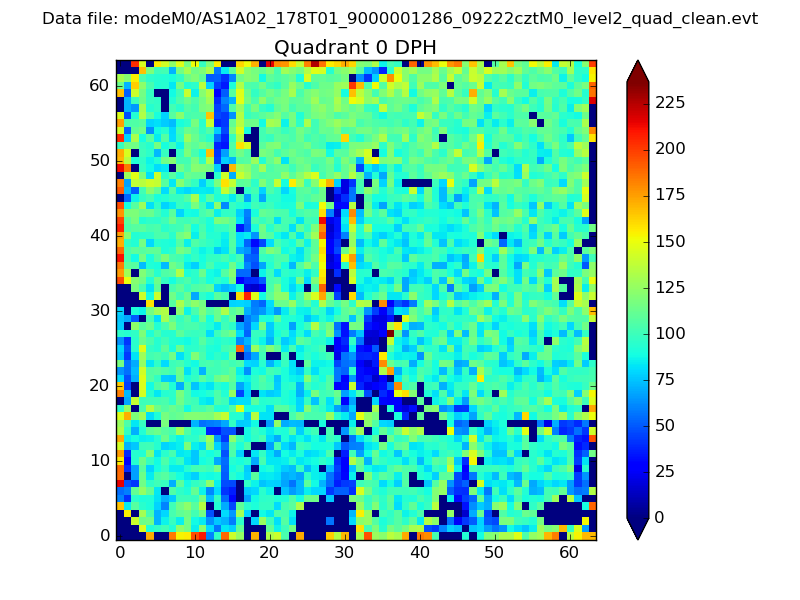 |
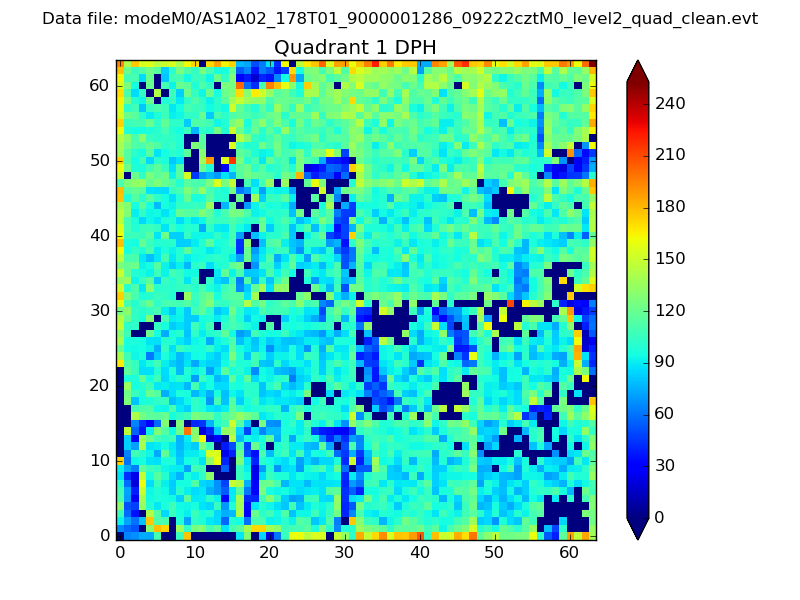 |
Quadrant B |
|---|---|---|---|
| Quadrant D | 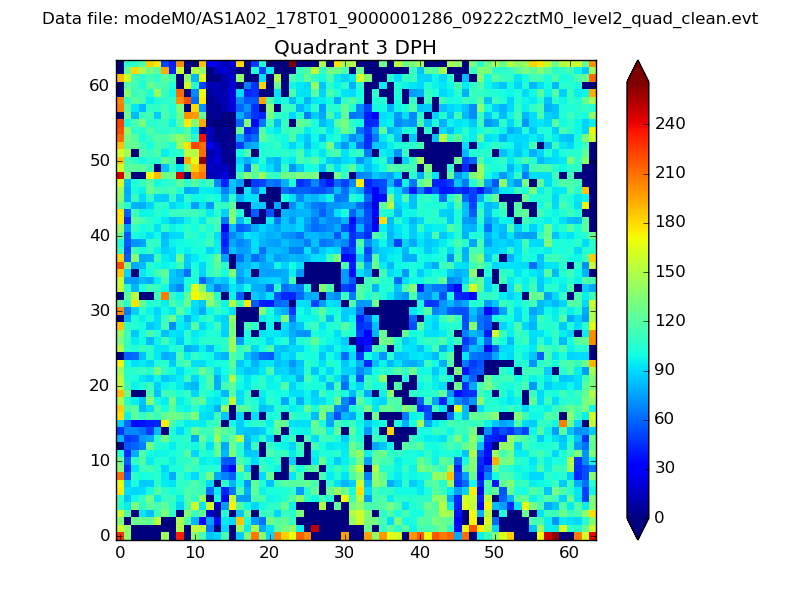 |
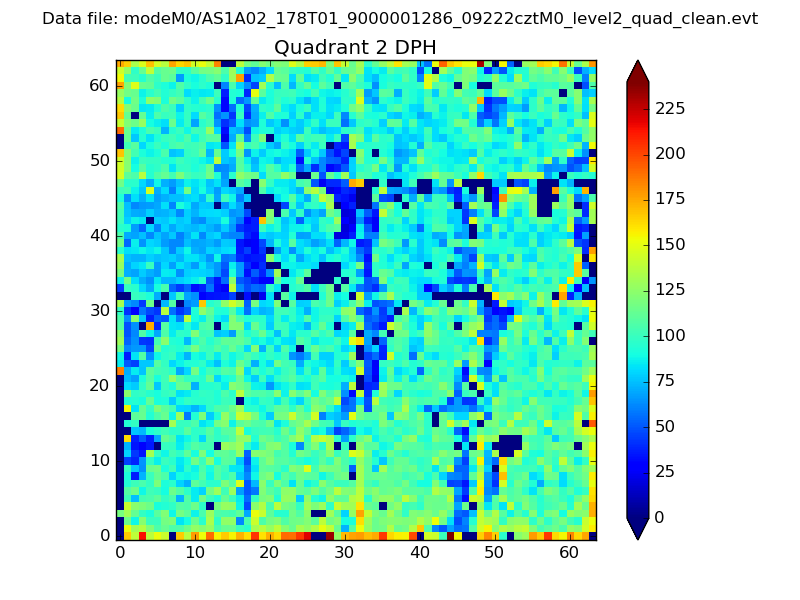 |
Quadrant C |
| Plot type | Count rate plots | Images |
|---|---|---|
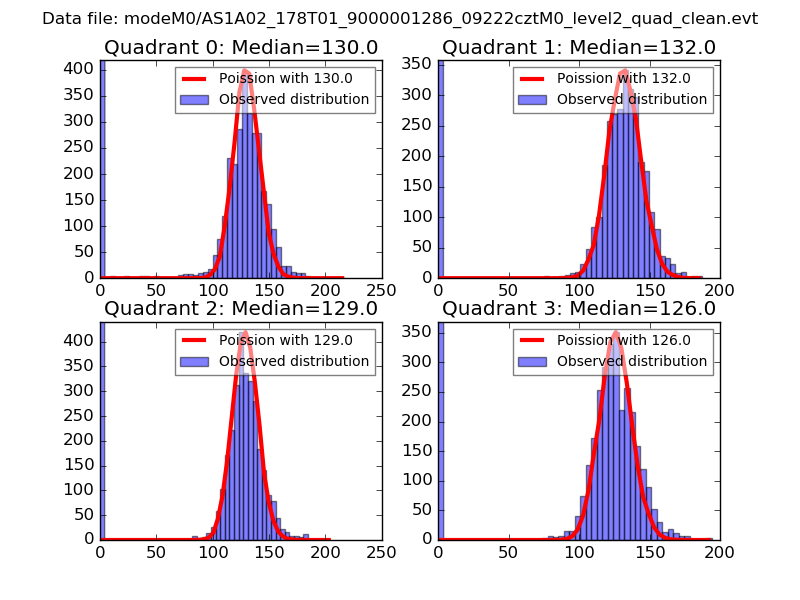
| Comparison with Poisson distribution Blue bars denote a histogram of data divided into 1 sec bins. Red curve is a Poisson curve with rate = median count rate of data. |
 |
 |
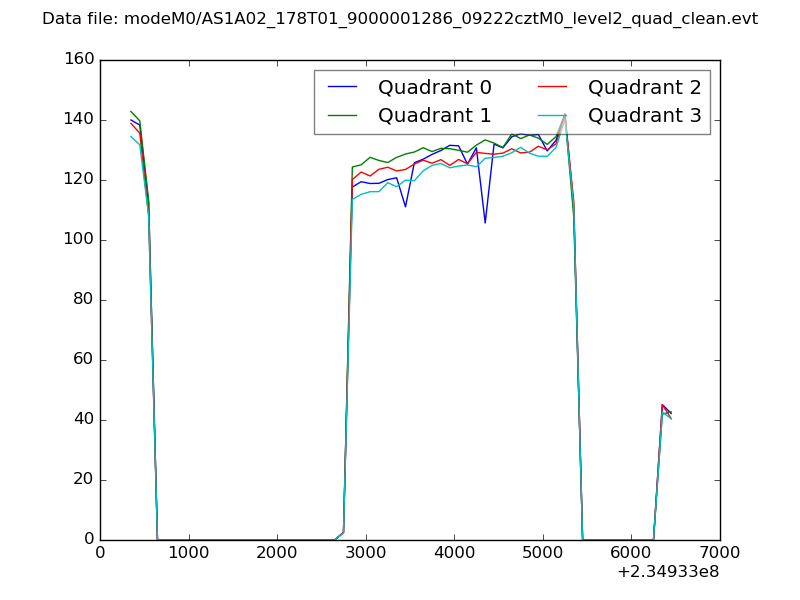
| Quadrant-wise count rates Data is divided into 100 sec bins |
 |
|
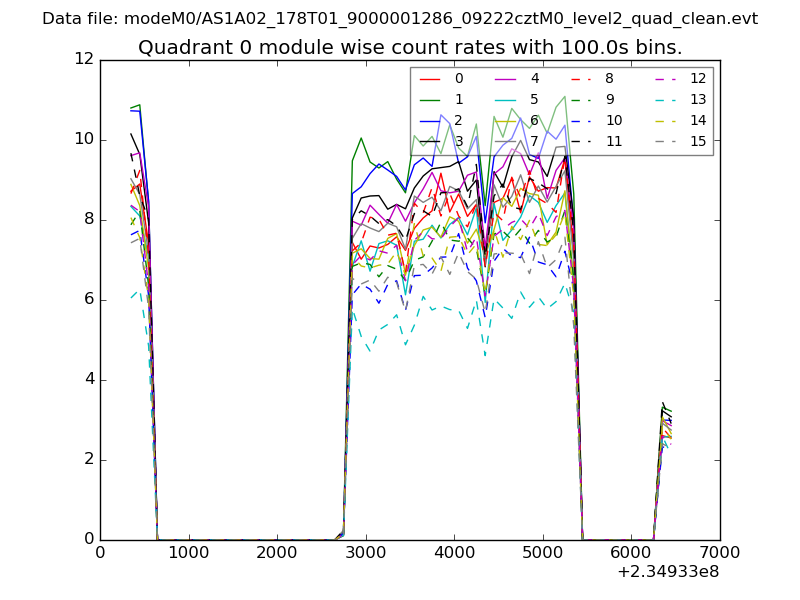
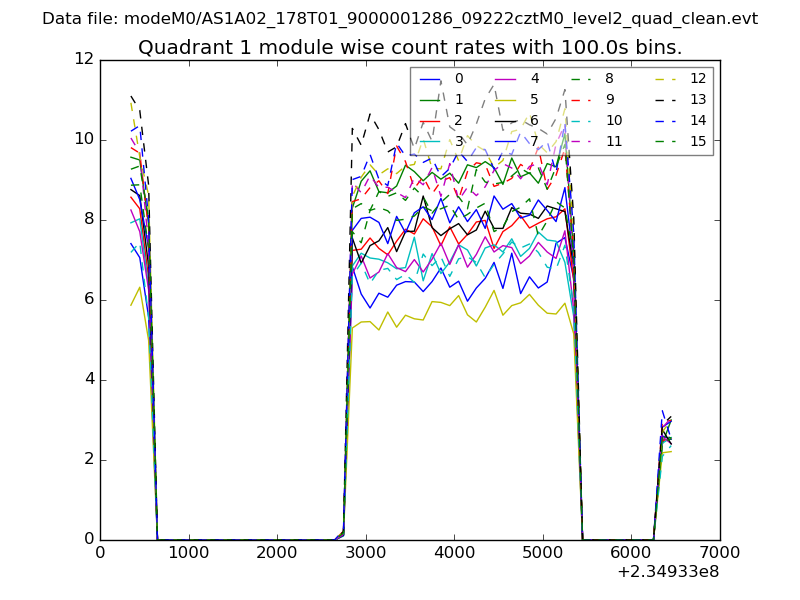
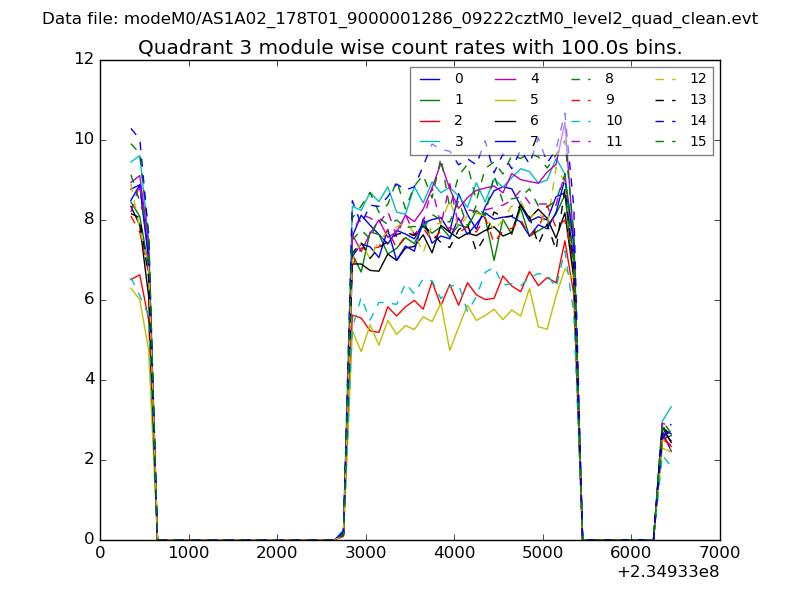
| Module-wise count rates for Quadrant A Data is divided into 100 sec bins |
 |
 |
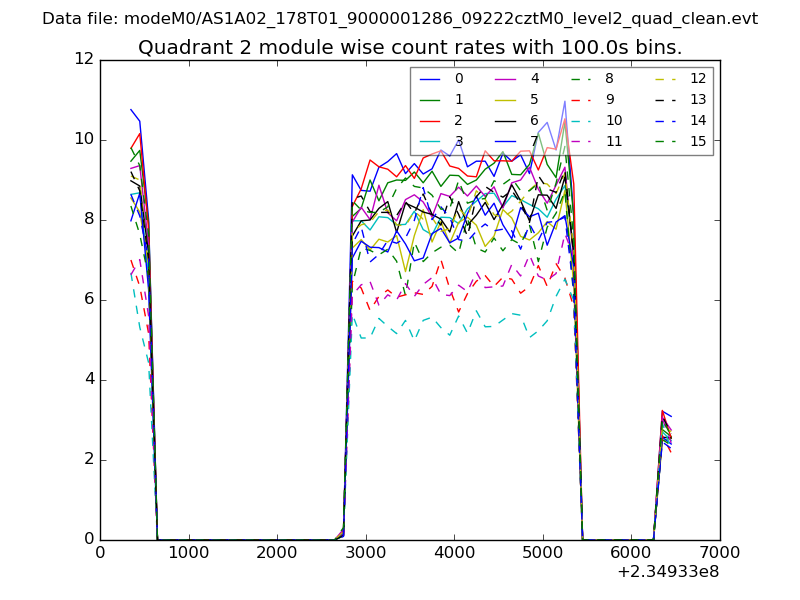
| Module-wise count rates for Quadrant B Data is divided into 100 sec bins |
 |
 |
| Module-wise count rates for Quadrant C Data is divided into 100 sec bins |
 |
 |
| Module-wise count rates for Quadrant D Data is divided into 100 sec bins |
 |
 |
| Parameter | Plot |
|---|---|
| CZT HV Monitor | 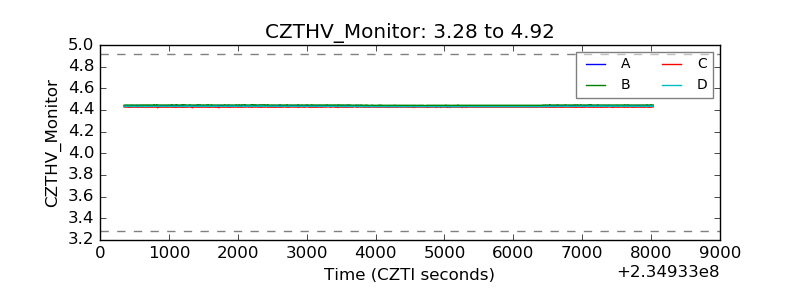 |
| D_VDD | 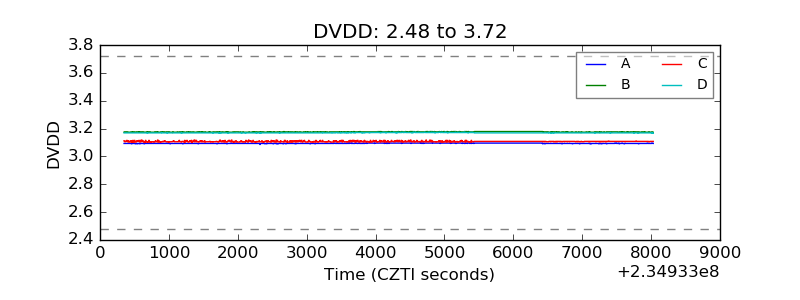 |
| Temperature 1 | 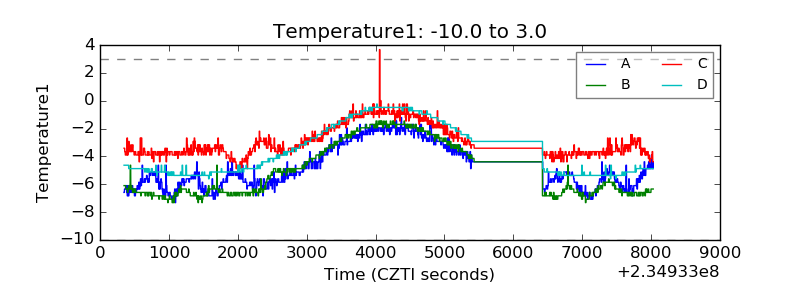 |
| Veto HV Monitor | 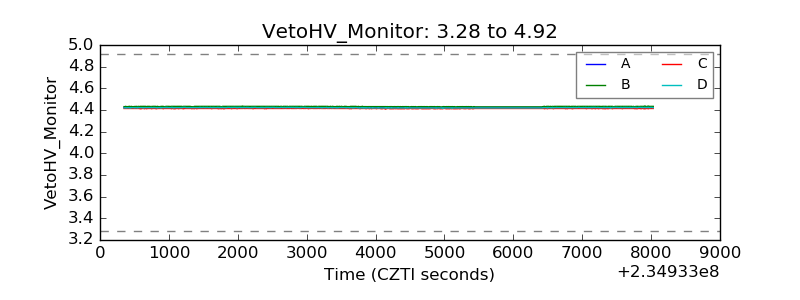 |
| Veto LLD | 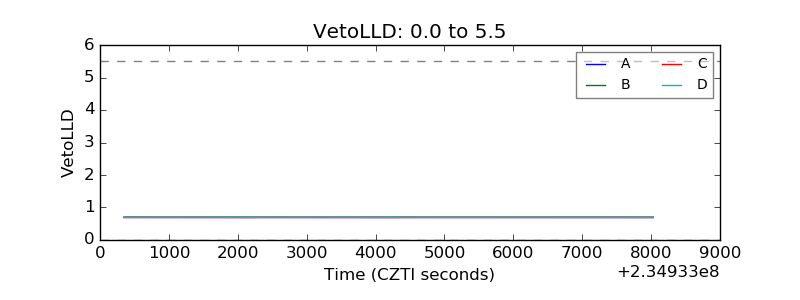 |
| Alpha Counter | 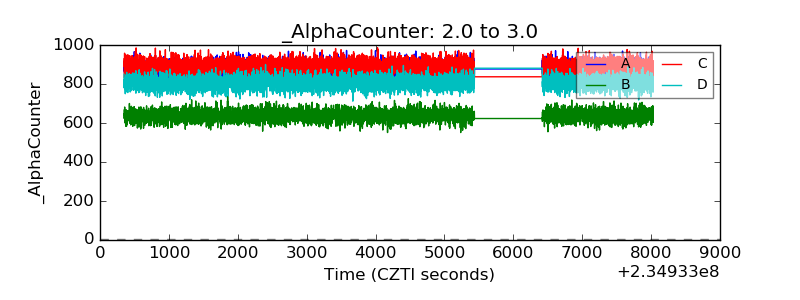 |
| _CPM_Rate | 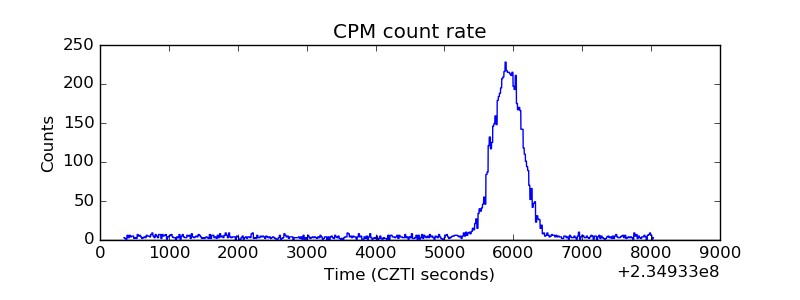 |
| CZT Counter | 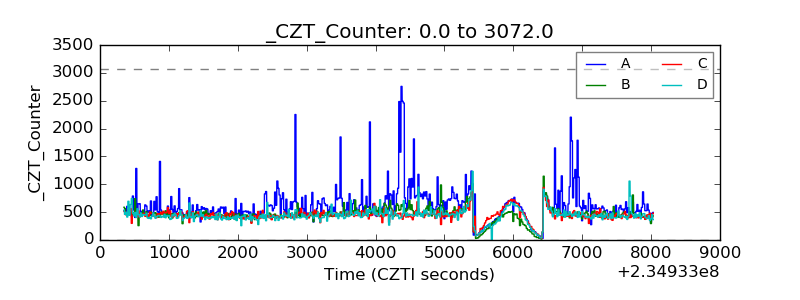 |
| +2.5 Volts monitor |  |
| +5 Volts monitor | 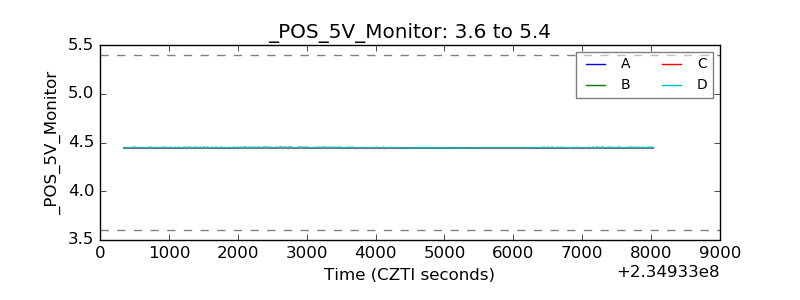 |
| _ROLL_ROT | 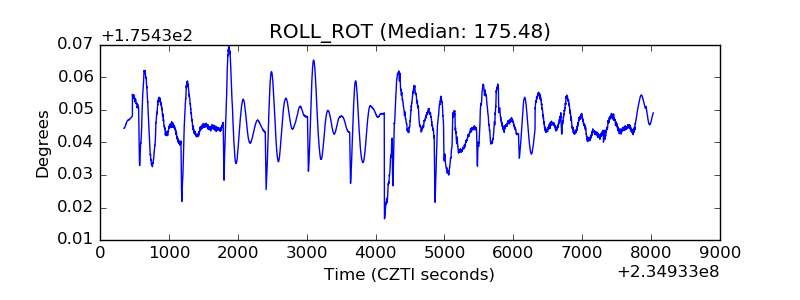 |
| _Roll_DEC | 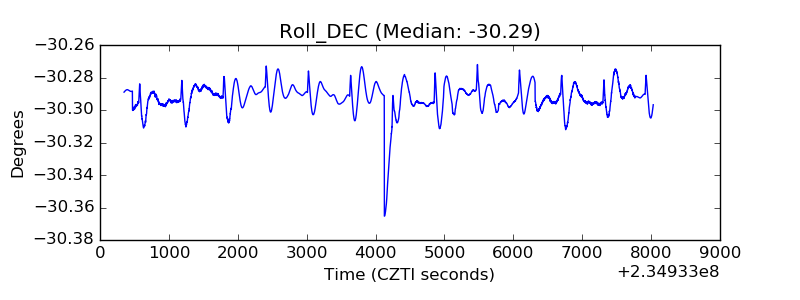 |
| _Roll_RA | 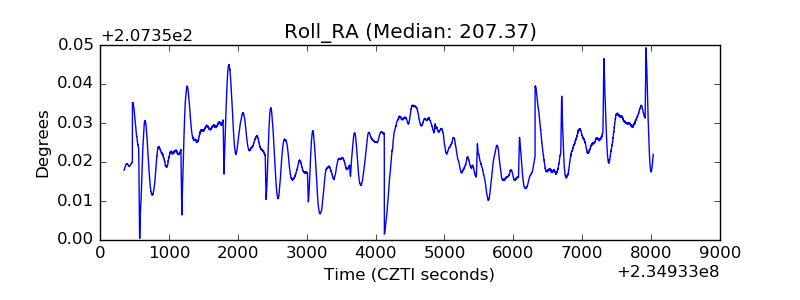 |
| Veto Counter | 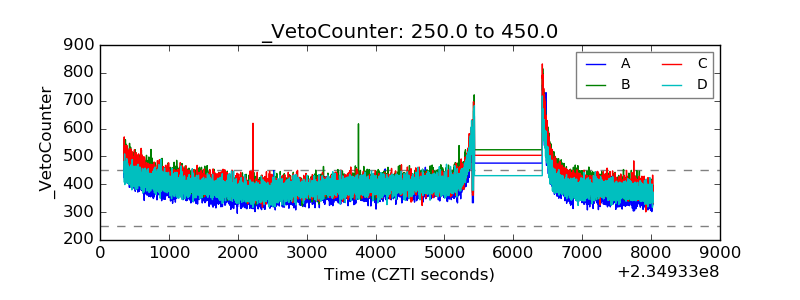 |