| Param | Original file | Final file |
|---|---|---|
| Filename | modeM0/AS1A02_178T01_9000001286_09225cztM0_level2.evt | modeM0/AS1A02_178T01_9000001286_09225cztM0_level2_quad_clean.evt |
| Size (bytes) | 517,392,000 | 77,855,040 |
| Size | 493.4 MB | 74.2 MB |
| Events in quadrant A | 4,797,387 | 461,421 |
| Events in quadrant B | 3,568,663 | 478,037 |
| Events in quadrant C | 3,373,028 | 464,111 |
| Events in quadrant D | 3,441,493 | 454,062 |
| Mode SS | |||
|---|---|---|---|
| Quadrant | BADHDUFLAG | Total packets | Discarded packets |
| A | 0 | 164 | 24 |
| B | 0 | 164 | 16 |
| C | 0 | 164 | 10 |
| D | 0 | 164 | 18 |
| Mode M9 | |||
|---|---|---|---|
| Quadrant | BADHDUFLAG | Total packets | Discarded packets |
| A | 0 | 2 | 0 |
| B | 0 | 2 | 0 |
| C | 0 | 2 | 0 |
| D | 0 | 2 | 0 |
| Mode M0 | |||
|---|---|---|---|
| Quadrant | BADHDUFLAG | Total packets | Discarded packets |
| A | 0 | 21184 | 2237 |
| B | 0 | 16648 | 1335 |
| C | 0 | 16411 | 1353 |
| D | 0 | 16884 | 1623 |
| Quadrant | Total seconds | Saturated seconds | Saturation percentage |
|---|---|---|---|
| A | 7045 | 403 | 5.720369% |
| B | 7248 | 321 | 4.428808% |
| C | 7228 | 266 | 3.680133% |
| D | 7176 | 277 | 3.860089% |
Noise dominated data is calculated using 1-second bins in cleaned event files. If a bin has >2000 counts, and if more than 50% of those come from <1% of pixels, then it is considered to be noise-dominated and hence unusable.
| Quadrant | # 1 sec bins | Bins with >0 counts | Bins with >2000 counts | High rate bins dominated by noise | Noise dominated (total time) | Noise dominated (detector-on time) | Marked lightcurve |
|---|---|---|---|---|---|---|---|
| A | 8143 | 7671 | 31 | 31 | 0.38% | 0.40% | 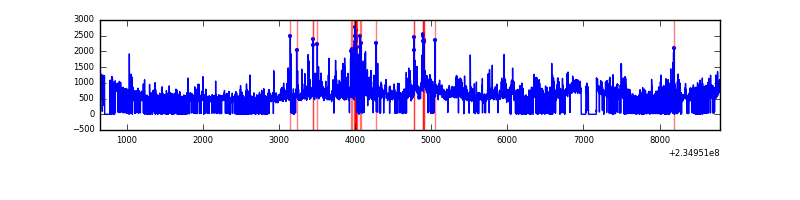 |
| B | 8143 | 7756 | 0 | 0 | 0.00% | 0.00% | 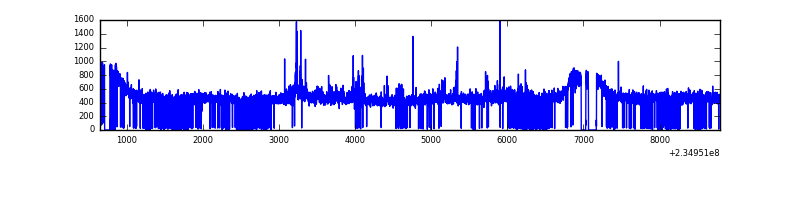 |
| C | 8143 | 7731 | 0 | 0 | 0.00% | 0.00% | 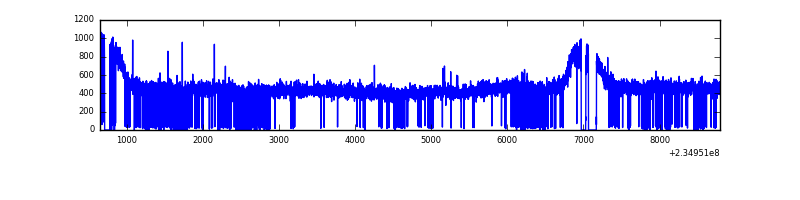 |
| D | 8142 | 7717 | 7 | 7 | 0.09% | 0.09% | 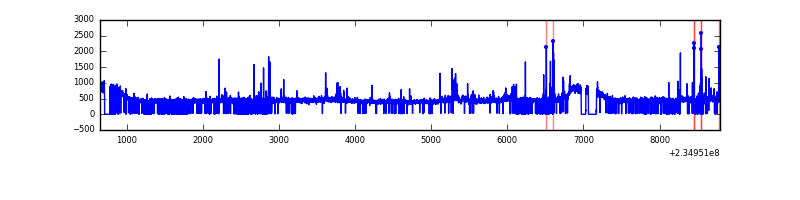 |
Top three noisy pixels from each quadrant. If the there are fewer than three noisy pixels in the level2.evt file, extra rows are filled as -1
| Pixel properties | Quadrant properties | ||||||
|---|---|---|---|---|---|---|---|
| Quadrant | DetID | PixID | Counts | Sigma | Mean | Median | Sigma |
| A | 8 | 5 | 1275795 | 7282.91 | 853 | 833 | 175.1 |
| A | 5 | 16 | 77192 | 436.18 | 853 | 833 | 175.1 |
| A | 1 | 162 | 63648 | 358.82 | 853 | 833 | 175.1 |
| B | 0 | 214 | 43656 | 246.6 | 886 | 863 | 173.5 |
| B | 0 | 245 | 35314 | 198.53 | 886 | 863 | 173.5 |
| B | 12 | 111 | 18957 | 104.27 | 886 | 863 | 173.5 |
| C | 13 | 61 | 6660 | 28.93 | 861 | 862 | 200.4 |
| C | 14 | 67 | 5536 | 23.33 | 861 | 862 | 200.4 |
| C | 8 | 222 | 4223 | 16.77 | 861 | 862 | 200.4 |
| D | 7 | 71 | 70687 | 308.16 | 847 | 822 | 226.7 |
| D | 12 | 233 | 44361 | 192.04 | 847 | 822 | 226.7 |
| D | 5 | 97 | 36231 | 156.18 | 847 | 822 | 226.7 |
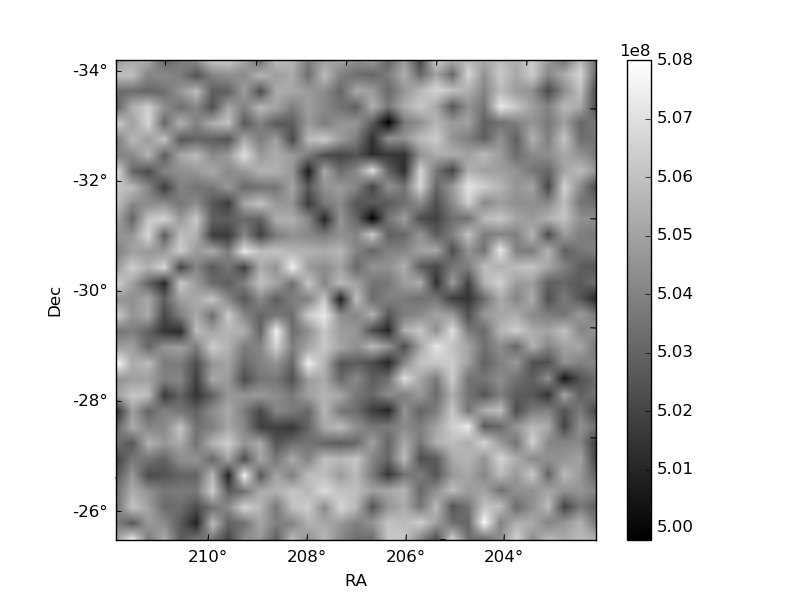
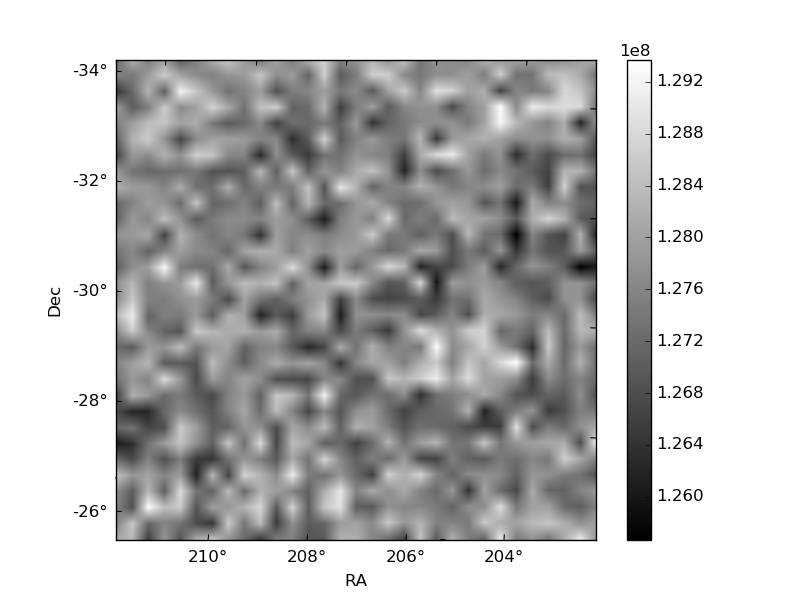
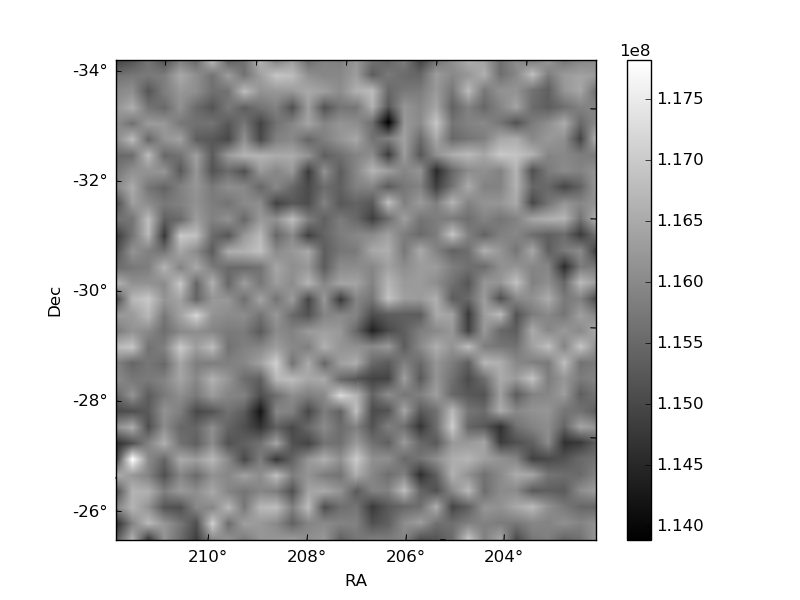
Histogram calculated using DETX and DETY for each event in the final _common_clean file
| Quadrant A | 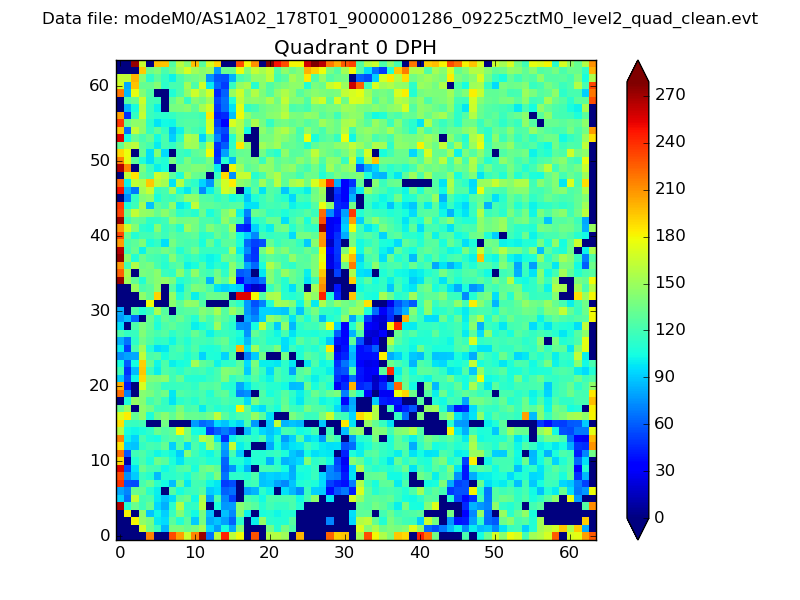 |
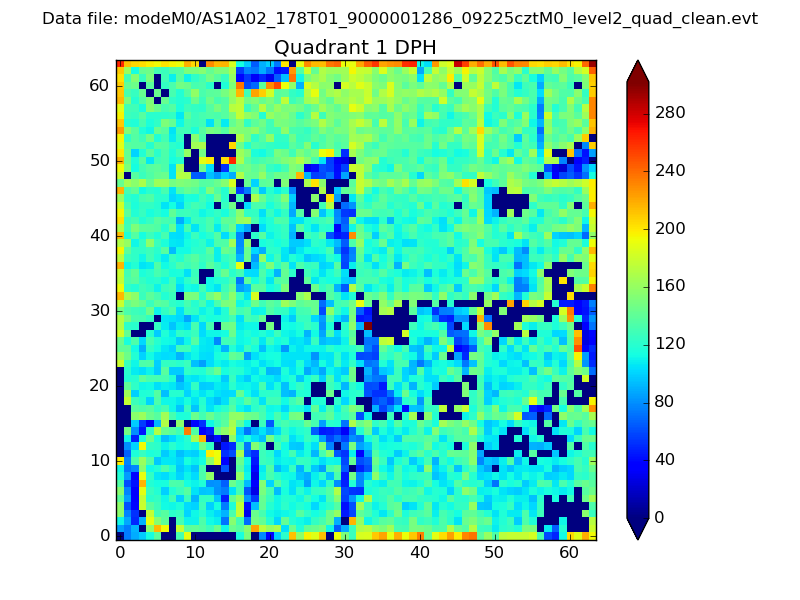 |
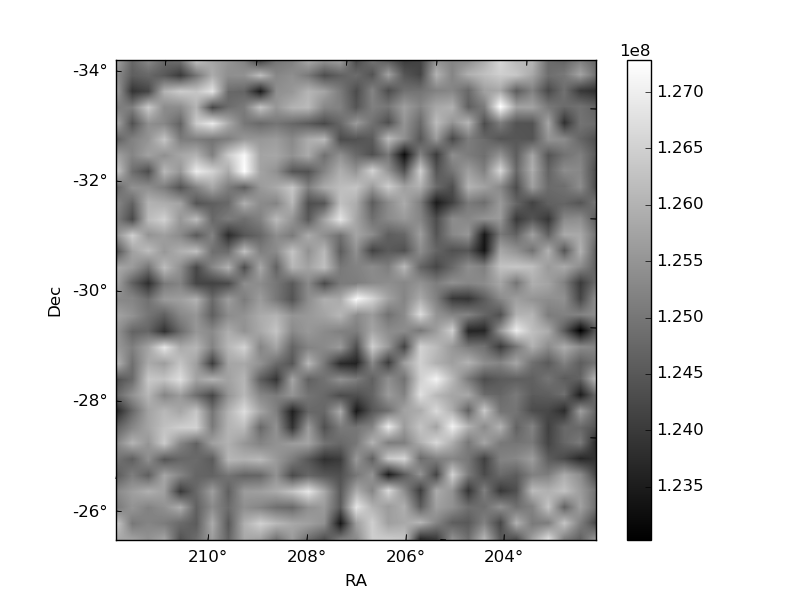
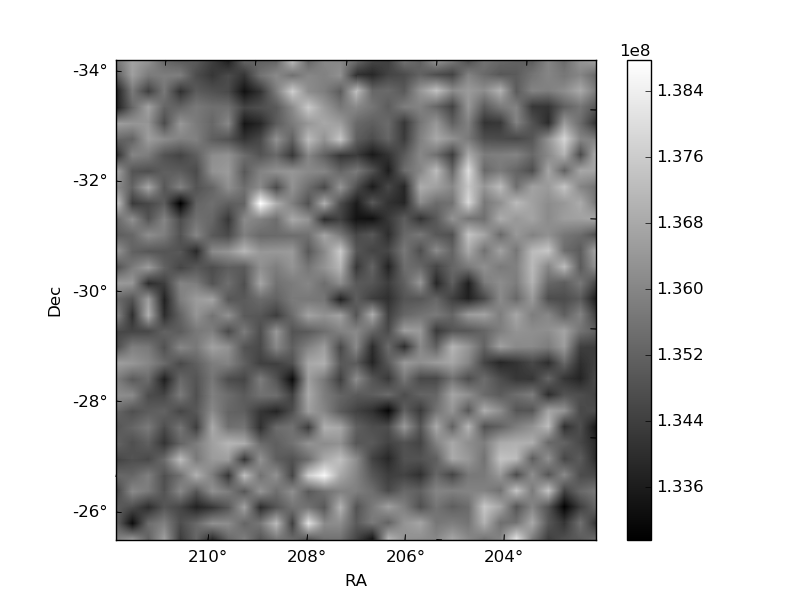
Quadrant B |
|---|---|---|---|
| Quadrant D | 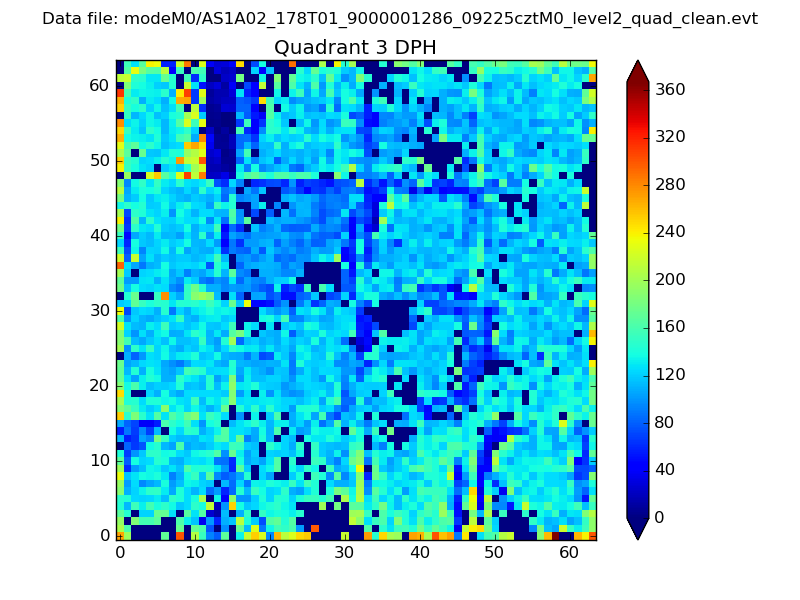 |
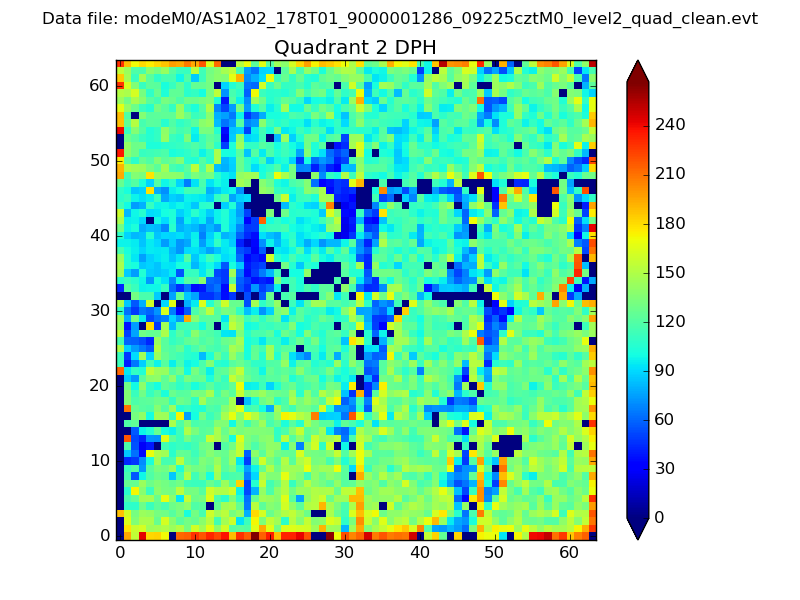 |
Quadrant C |
| Plot type | Count rate plots | Images |
|---|---|---|
| Comparison with Poisson distribution Blue bars denote a histogram of data divided into 1 sec bins. Red curve is a Poisson curve with rate = median count rate of data. |
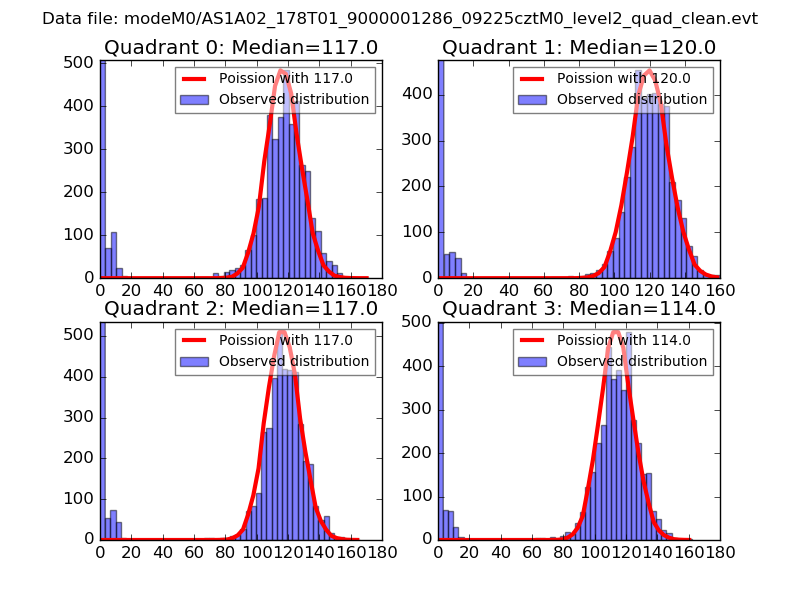 |
 |
| Quadrant-wise count rates Data is divided into 100 sec bins |
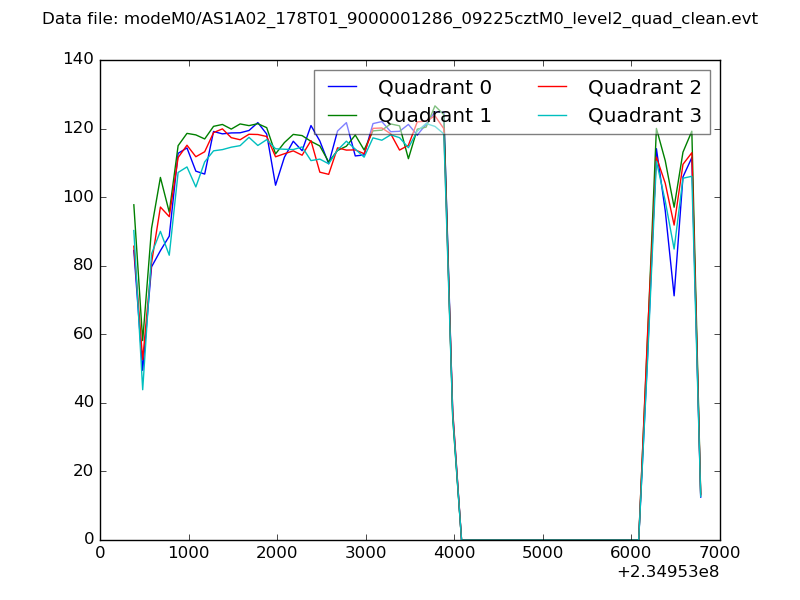 |
|
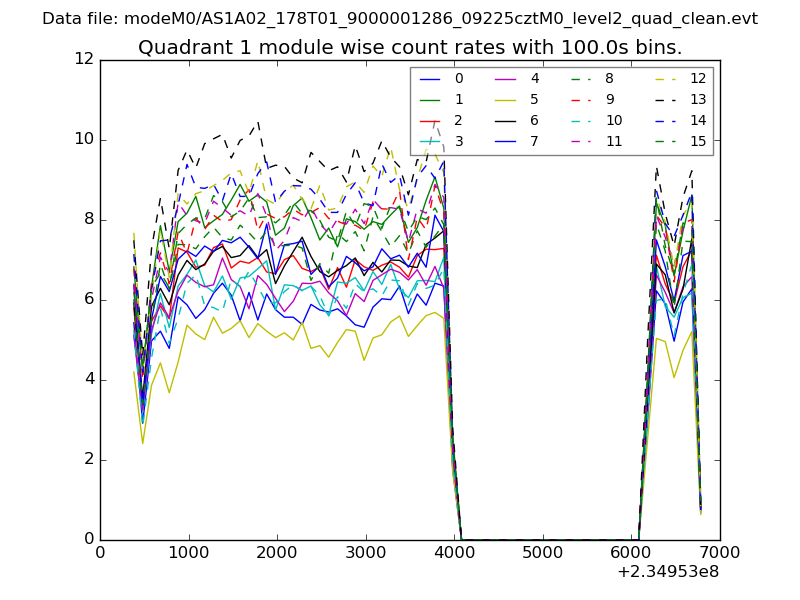
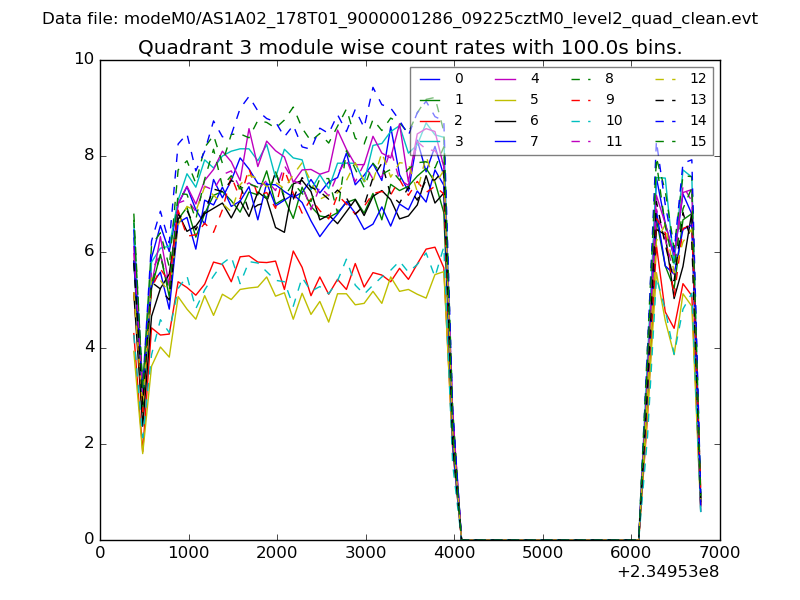
| Module-wise count rates for Quadrant A Data is divided into 100 sec bins |
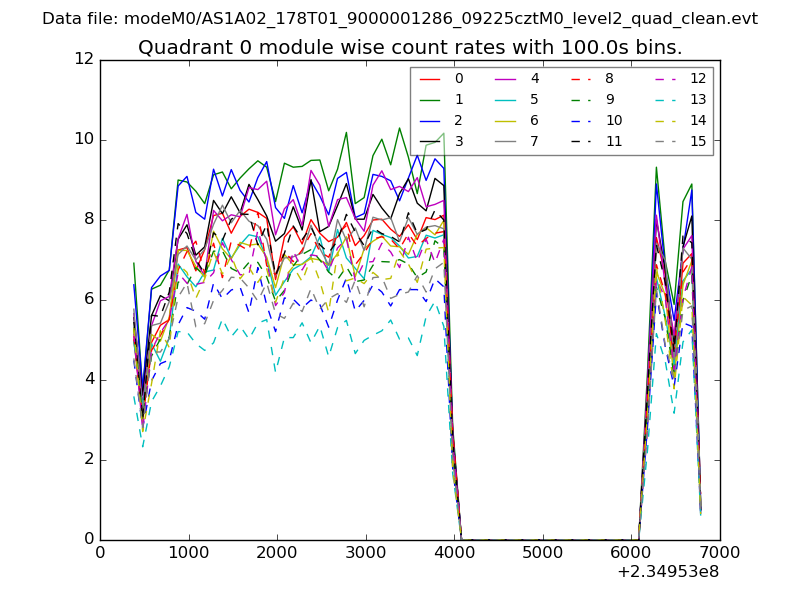 |
 |
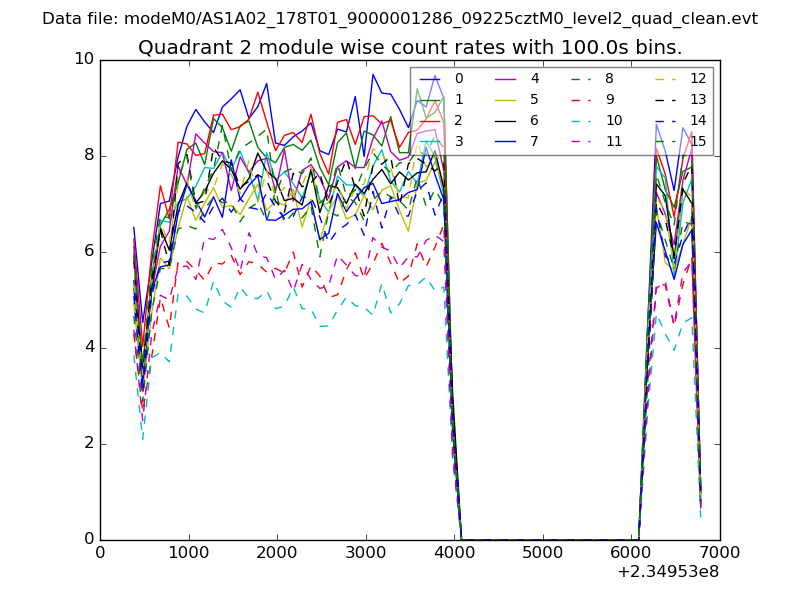
| Module-wise count rates for Quadrant B Data is divided into 100 sec bins |
 |
 |
| Module-wise count rates for Quadrant C Data is divided into 100 sec bins |
 |
 |
| Module-wise count rates for Quadrant D Data is divided into 100 sec bins |
 |
 |
| Parameter | Plot |
|---|---|
| CZT HV Monitor | 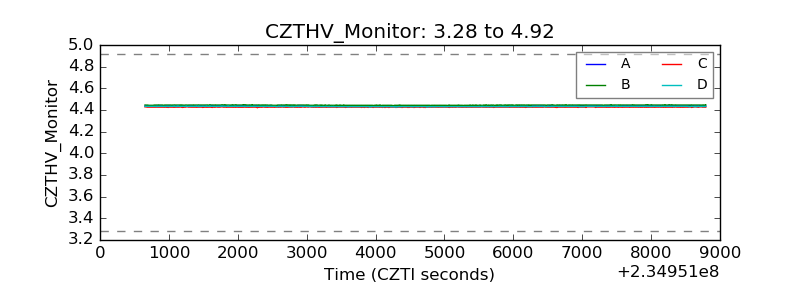 |
| D_VDD | 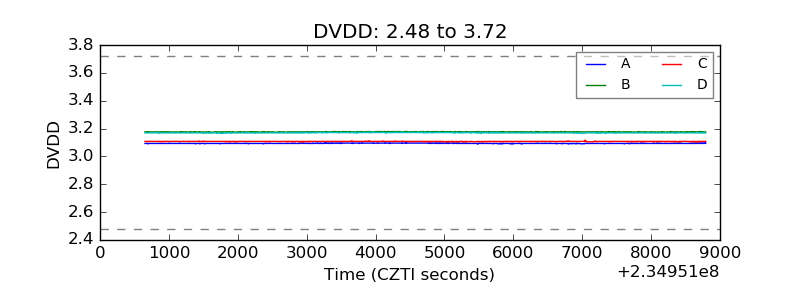 |
| Temperature 1 | 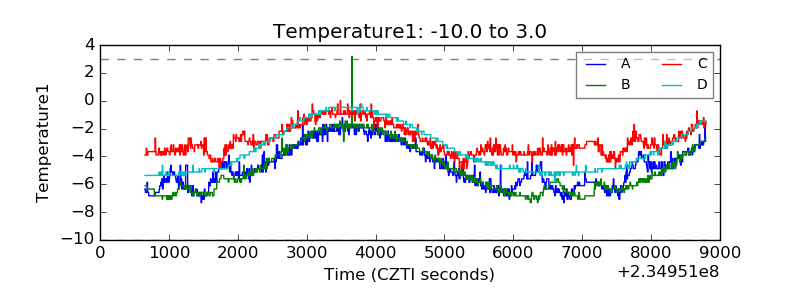 |
| Veto HV Monitor | 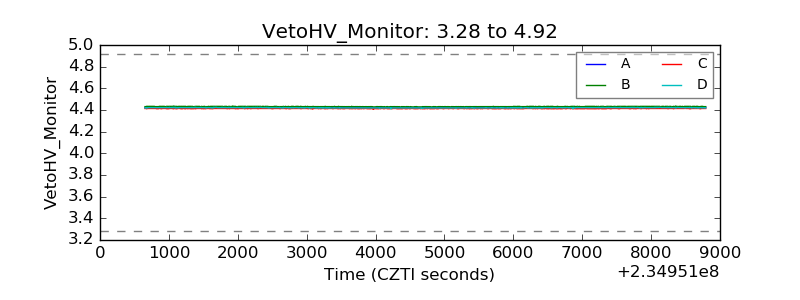 |
| Veto LLD | 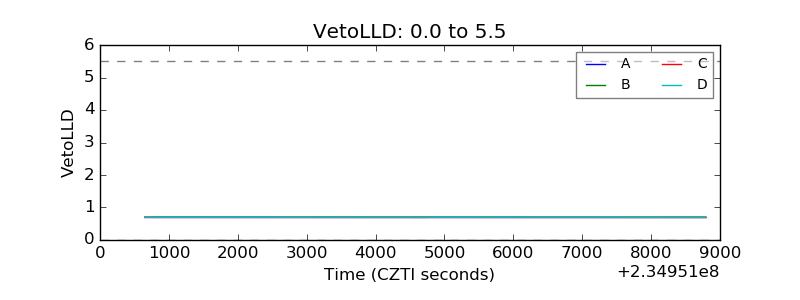 |
| Alpha Counter | 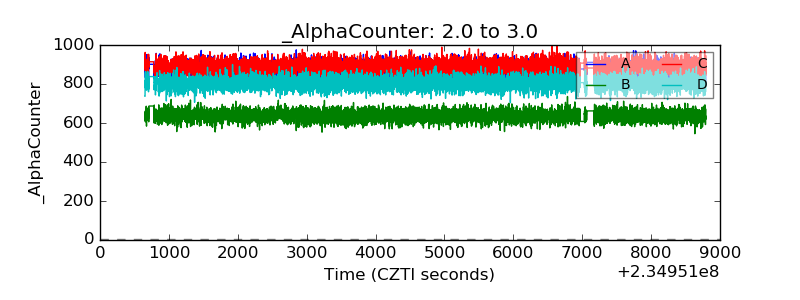 |
| _CPM_Rate | 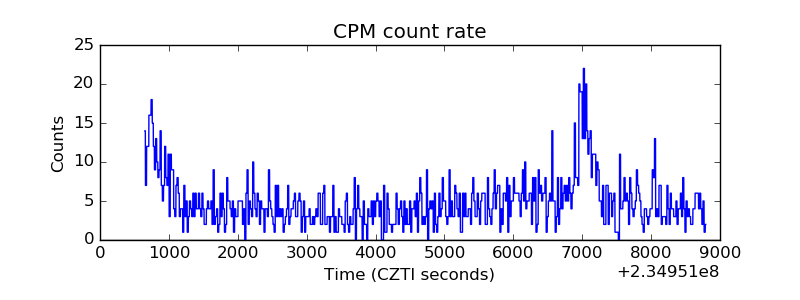 |
| CZT Counter | 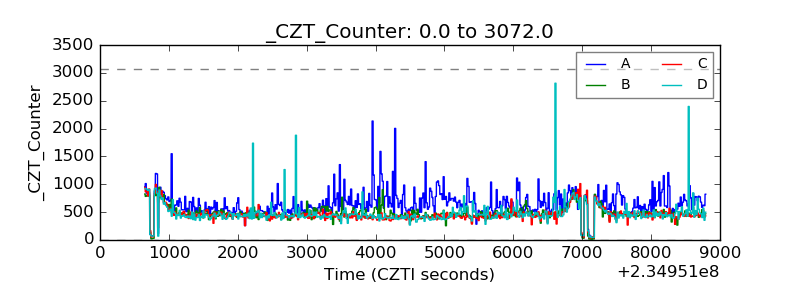 |
| +2.5 Volts monitor |  |
| +5 Volts monitor |  |
| _ROLL_ROT | 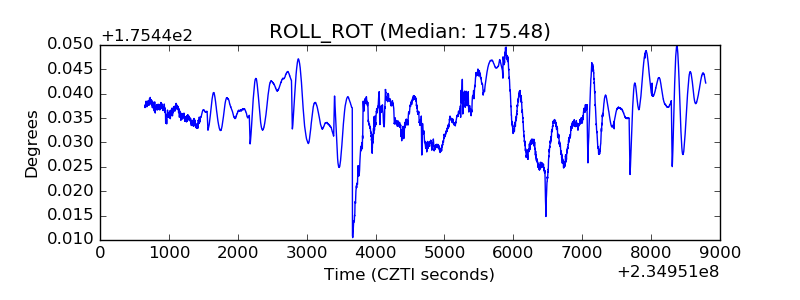 |
| _Roll_DEC | 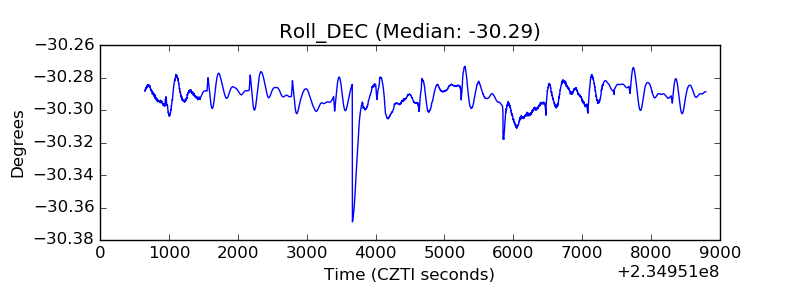 |
| _Roll_RA | 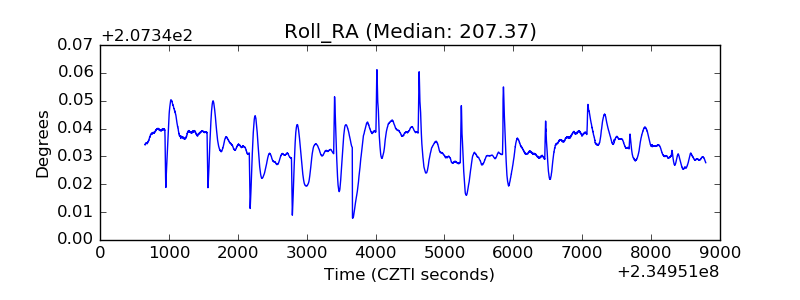 |
| Veto Counter | 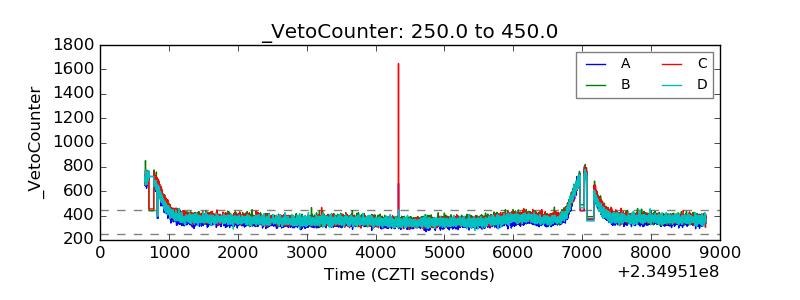 |